


The Bitcoin price attempts to stabilise following a significant decline, suggesting that the excessiveness may have dissipated from the market.
El precio de Bitcoin intenta estabilizarse luego de una caída significativa, lo que sugiere que el exceso puede haberse disipado del mercado.
After years of rejections, the commencement of trading for Bitcoin exchange-traded funds (ETFs) last week did not yield the expected price surge, resulting in total sales of approximately $4.7 billion, as CryptoSlate research and data analyst James Van Straten reported.
Después de años de rechazos, el inicio de la negociación de fondos cotizados en bolsa (ETF) de Bitcoin la semana pasada no produjo el aumento de precios esperado, lo que resultó en ventas totales de aproximadamente $ 4.7 mil millones, como informó el analista de datos e investigación de CryptoSlate James Van Straten.
The Crypto Fear & Greed Index, previously indicating “extreme greed” with a score of 76, has now shifted to a more neutral level at 52. This transition is viewed positively, indicating a potential reduction in market speculation.
El índice Crypto Fear & Greed, que anteriormente indicaba "codicia extrema" con una puntuación de 76, ahora ha cambiado a un nivel más neutral en 52. Esta transición se considera positiva, lo que indica una reducción potencial en la especulación del mercado.
With the “sell the news” event now behind us, traders are likely to shift their attention to macroeconomic data, mainly focusing on the actions of the United States Federal Reserve. The Fed is anticipated to initiate rate cuts as early as March, as CME Group’s FedWatch Tool data suggests. If this occurs, it could bode well for risk-assets.
Ahora que hemos dejado atrás el evento de “vender las noticias”, es probable que los operadores desvíen su atención a los datos macroeconómicos, centrándose principalmente en las acciones de la Reserva Federal de Estados Unidos. Se prevé que la Reserva Federal inicie recortes de tipos ya en marzo, como sugieren los datos de la herramienta FedWatch del CME Group. Si esto ocurre, podría ser un buen augurio para los activos de riesgo.
Is the correction in Bitcoin and other cryptocurrencies complete? Could major digital currencies resume their upward trend in the short term? We will assess the charts to find out.
¿Está completa la corrección en Bitcoin y otras criptomonedas? ¿Podrían las principales monedas digitales reanudar su tendencia alcista en el corto plazo? Evaluaremos los gráficos para averiguarlo.
S&P 500 Index (SPX) price analysis
Análisis de precios del índice S&P 500 (SPX)
The S&P 500 Index turned up from the 20-day exponential moving average (4,727) on Jan. 8, indicating that the uptrend remains intact and traders view the dips as a buying opportunity.
El índice S&P 500 subió desde el promedio móvil exponencial de 20 días (4.727) el 8 de enero, lo que indica que la tendencia alcista permanece intacta y los operadores ven las caídas como una oportunidad de compra.
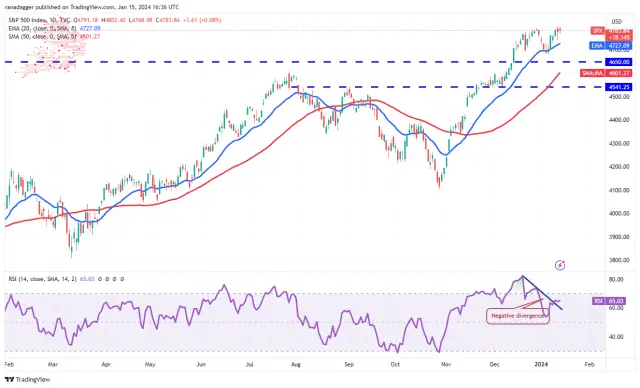
The upsloping moving averages indicate buyers have the upper hand, but the negative divergence on the relative strength index (RSI) warrants caution. If the value maintains above 4,800, the index will likely ascend to the psychologically important level of 5,000.
Las medias móviles ascendentes indican que los compradores tienen ventaja, pero la divergencia negativa en el índice de fuerza relativa (RSI) justifica cautela. Si el valor se mantiene por encima de 4.800, el índice probablemente ascenderá al nivel psicológicamente importante de 5.000.
On the downside, the 20-day EMA is the first support to watch. If this level allows, it will suggest that the buying pressure is reducing. The index may then fall to the 50-day simple moving average (4,601).
En el lado negativo, la EMA de 20 días es el primer soporte a tener en cuenta. Si este nivel lo permite, sugerirá que la presión de compra se está reduciendo. El índice podría entonces caer hasta la media móvil simple de 50 días (4.601).
U.S. Dollar Index (DXY) price analysis
Análisis de precios del índice del dólar estadounidense (DXY)
For several days, the U.S. Dollar Index has been consolidating in a downtrend near the 20-day EMA (102).
Desde hace varios días, el índice del dólar estadounidense se está consolidando en una tendencia bajista cerca de la EMA de 20 días (102).
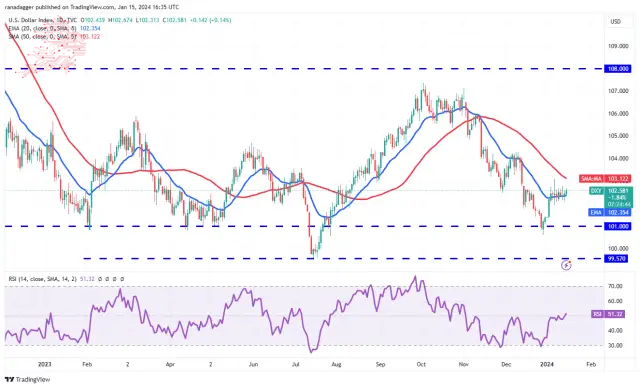
The flat 20-day EMA and the RSI near the midpoint do not give a clear advantage either to the bulls or the bears. If the price sustains below the 20-day EMA, the bears will try to pull the index to the critical support at 101.
La EMA plana de 20 días y el RSI cerca del punto medio no dan una ventaja clara ni a los alcistas ni a los bajistas. Si el precio se mantiene por debajo de la EMA de 20 días, los bajistas intentarán llevar el índice al soporte crítico en 101.
On the upside, the bulls will likely face selling at the 50-day SMA (103). A break and close above the 50-day SMA will suggest the start of a more robust recovery to 104.50. This level may again witness strong selling by the bears.
Por el lado positivo, es probable que los alcistas enfrenten ventas en la SMA de 50 días (103). Una ruptura y un cierre por encima de la SMA de 50 días sugerirán el inicio de una recuperación más sólida hasta 104,50. Este nivel puede volver a ser testigo de fuertes ventas por parte de los bajistas.
Bitcoin (BTC) price analysis
Análisis de precios de Bitcoin (BTC)
Bitcoin broke and closed below the support line on Jan. 14, signalling that the bears are trying to make a comeback.
Bitcoin rompió y cerró por debajo de la línea de soporte el 14 de enero, lo que indica que los bajistas están tratando de regresar.
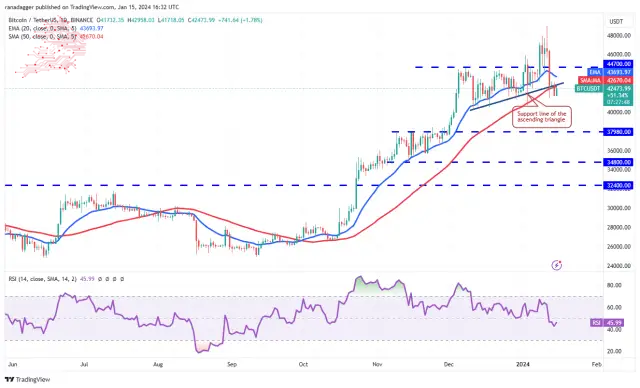
The 20-day EMA ($43,693) has started to turn down, and the RSI is near 46, suggesting that the bears hold a slight edge.
La EMA de 20 días ($43,693) ha comenzado a bajar y el RSI está cerca de 46, lo que sugiere que los bajistas tienen una ligera ventaja.
Any recovery attempt is likely to face selling at the 20-day EMA. If the price turns down from the overhead resistance, the sentiment will shift from buying on dips to selling on rallies. The BTC/USDT pair may fall to $40,000 and later to $37,980.
Es probable que cualquier intento de recuperación enfrente ventas en la EMA de 20 días. Si el precio baja debido a la resistencia superior, el sentimiento pasará de comprar en las caídas a vender en las subidas. El par BTC/USDT puede caer a $40,000 y luego a $37,980.
Contrary to this assumption, if buyers overcome the barrier at $44,700, it will suggest that the corrective phase may be over. The pair will then try to reach the psychologically important level of $50,000.
Contrariamente a esta suposición, si los compradores superan la barrera de los 44.700 dólares, sugerirá que la fase correctiva puede haber terminado. El par intentará entonces alcanzar el nivel psicológicamente importante de 50.000 dólares.
Ether (ETH) price analysis
Análisis de precios de éter (ETH)
El éter se está corrigiendo en una tendencia alcista, y los alcistas intentan mantener el precio por encima del soporte inmediato de 2.458 dólares.
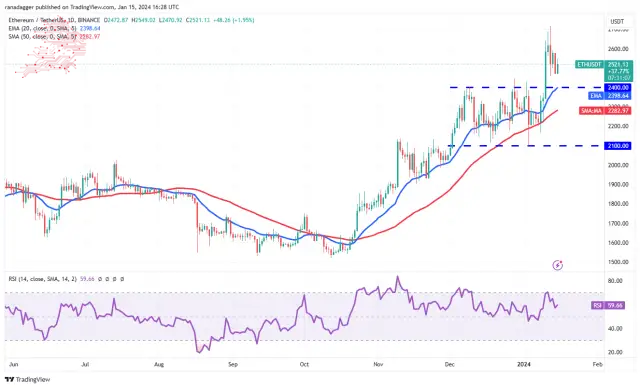
The upsloping 20-day EMA ($2,398) and the RSI in the positive zone indicate that the bulls are in command. If the price rises from the current level or rebounds off $2,400, it will signal strong buying on dips. The ETH/USDT pair may then rally to $2,717. If this level is scaled, the next stop could be $3,000.
La EMA de 20 días alcista ($2,398) y el RSI en la zona positiva indican que los alcistas tienen el mando. Si el precio sube desde el nivel actual o rebota en $ 2,400, indicará fuertes compras en las caídas. El par ETH/USDT podría subir hasta los 2.717 dólares. Si se escala este nivel, la próxima parada podría ser $3,000.
This optimistic view will be negated in the near term if the price continues lower and plunges below $2,400. That could sink the pair to the 50-day SMA ($2,282) and eventually to $2,100.
Esta visión optimista se verá anulada en el corto plazo si el precio continúa bajando y cae por debajo de los 2.400 dólares. Eso podría hundir el par hasta la SMA de 50 días ($2282) y eventualmente hasta $2100.
BNB price analysis
Análisis de precios de BNB
BNB dipped below the 20-day EMA ($301) on Jan. 12, but the bears could not sustain the price below the 61.8% Fibonacci retracement level of $291.
BNB cayó por debajo de la EMA de 20 días ($301) el 12 de enero, pero los bajistas no pudieron mantener el precio por debajo del nivel de retroceso de Fibonacci del 61,8% de $291.
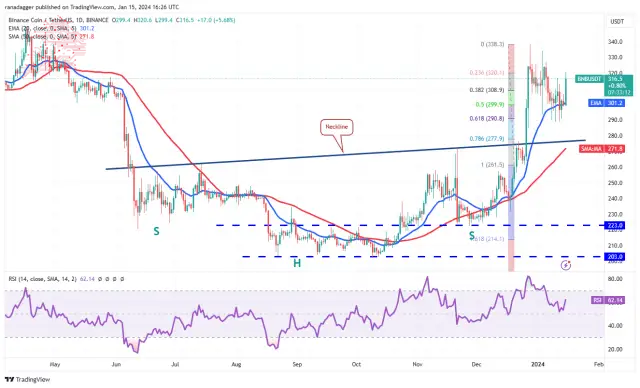
That started a relief rally, which picked up momentum on Jan. 15. If buyers hold the price above $317, the BNB/USDT pair could rise to $338 and then to $350 afterwards. The $350 level will likely attract strong selling by the bears, but if bulls overcome this barrier, the pair may soar to $400.
Eso inició un repunte de alivio, que cobró impulso el 15 de enero. Si los compradores mantienen el precio por encima de $317, el par BNB/USDT podría subir a $338 y luego a $350. El nivel de $350 probablemente atraerá fuertes ventas por parte de los bajistas, pero si los alcistas superan esta barrera, el par puede dispararse a $400.
The critical level to watch on the downside is $291 because a slump below it could tug the price to the neckline.
El nivel crítico a tener en cuenta a la baja es 291 dólares porque una caída por debajo de él podría arrastrar el precio hasta el escote.
XRP price analysis
Attempts by the bulls to start a recovery in XRP stalled near the downtrend line on Jan. 11, suggesting that the bears remain in control.
Análisis de precios de XRP Los intentos de los alcistas de iniciar una recuperación en XRP se estancaron cerca de la línea de tendencia bajista el 11 de enero, lo que sugiere que los bajistas mantienen el control.
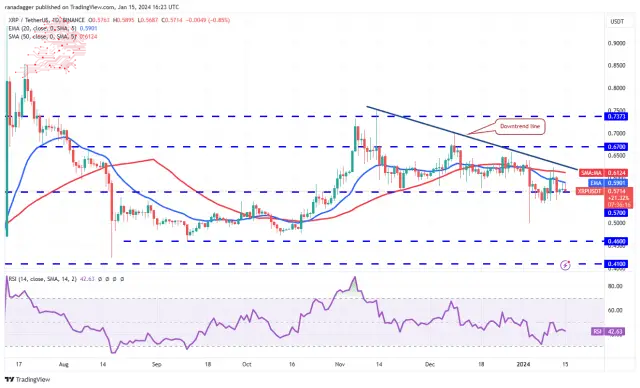
The downsloping 20-day EMA ($0.59) and the RSI below 43 suggest that the path of least resistance is to the downside. The selling could accelerate if the price plummets below the $0.56 support. That will clear the path for a drop to $0.50 and then $0.46.
La EMA de 20 días descendente (USD 0,59) y el RSI por debajo de 43 sugieren que el camino de menor resistencia es a la baja. La venta podría acelerarse si el precio cae por debajo del soporte de 0,56 dólares. Eso despejará el camino para una caída a 0,50 dólares y luego a 0,46 dólares.
To prevent the decline, buyers must shove the XRP/USDT pair above the downtrend line. That will invalidate the bearish pattern and start a relief rally to $0.67 and eventually to $0.74.
Para evitar la caída, los compradores deben empujar el par XRP/USDT por encima de la línea de tendencia bajista. Eso invalidará el patrón bajista e iniciará un repunte de alivio a 0,67 dólares y, finalmente, a 0,74 dólares.
Solana (SOL) price analysis
Análisis de precios de Solana (SOL)
Solana returned from the downtrend line on Jan. 14, indicating that the bears vigorously protect the level.
Solana regresó de la línea de tendencia bajista el 14 de enero, lo que indica que los bajistas protegen vigorosamente el nivel.
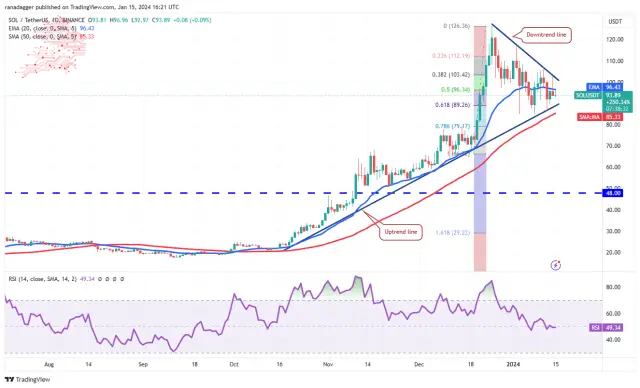
The 20-day EMA ($96) has flattened out, and the RSI is near the midpoint, signalling a balance between supply and demand. If the price skids below the uptrend line, the SOL/USDT pair may tumble to $67.
La EMA de 20 días ($96) se ha estabilizado y el RSI está cerca del punto medio, lo que indica un equilibrio entre la oferta y la demanda. Si el precio cae por debajo de la línea de tendencia alcista, el par SOL/USDT puede caer a $67.
Alternatively, if the price rises above the downtrend line, it will suggest that the correction may be over. The pair could then travel to $117 and later to $126. Buyers will have to clear this hurdle to signal the resumption of the uptrend.
Alternativamente, si el precio sube por encima de la línea de tendencia bajista, sugerirá que la corrección puede haber terminado. El par podría entonces viajar a 117 dólares y luego a 126 dólares. Los compradores tendrán que superar este obstáculo para señalar la reanudación de la tendencia alcista.
Cardano (ADA) price analysis
Cardano has been falling inside a descending channel pattern for several days, but a minor positive is that the bulls have maintained the price above the breakout level of $0.46.
Análisis de precios de Cardano (ADA) Cardano ha estado cayendo dentro de un patrón de canal descendente durante varios días, pero un aspecto positivo menor es que los alcistas han mantenido el precio por encima del nivel de ruptura de 0,46 dólares.
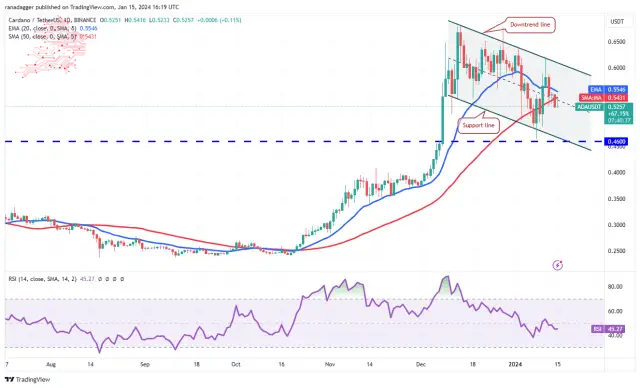
If buyers kick the price above the 20-day EMA ($0.55), the ADA/USDT pair could climb to the channel’s downtrend line. A break and close above the channel will indicate that the downtrend could be over. The pair may then surge to the overhead resistance at $0.68.
Si los compradores elevan el precio por encima de la EMA de 20 días ($0,55), el par ADA/USDT podría subir a la línea de tendencia bajista del canal. Una ruptura y un cierre por encima del canal indicarán que la tendencia bajista podría haber terminado. Luego, el par puede alcanzar la resistencia superior de USD 0,68.
Contrarily, if the price turns down from the 20-day EMA, it will suggest that the bears continue to sell on rallies. That will increase the likelihood of the pair dropping to the channel’s support line, where the buyers are likely to step in.
Por el contrario, si el precio baja desde la EMA de 20 días, sugerirá que los bajistas continúan vendiendo en los repuntes. Eso aumentará la probabilidad de que el par caiga hasta la línea de soporte del canal, donde es probable que intervengan los compradores.
Avalanche (AVAX) price analysis
Análisis de precios de Avalancha (AVAX)
Avalanche has been trading below the breakdown of $38 since Jan. 12, but the bears have failed to sink the price to the strong support at $31.
Avalanche ha estado cotizando por debajo del desglose de 38 dólares desde el 12 de enero, pero los bajistas no han logrado hundir el precio hasta el fuerte soporte de 31 dólares.
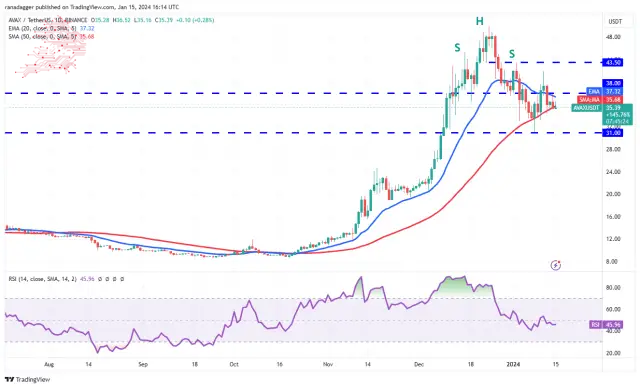
The 20-day EMA ($37.32) is gradually sloping down, and the RSI is just below the midpoint, indicating a slight advantage to the sellers. If the 50-day SMA ($35.68) support gives way, the AVAX/USDT pair may retest the $31 support. A strong bounce off this level may keep the pair rangebound between $31 and $43.50 for some time.
La EMA de 20 días ($37,32) está descendiendo gradualmente y el RSI está justo por debajo del punto medio, lo que indica una ligera ventaja para los vendedores. Si el soporte de la SMA de 50 días ($35,68) cede, el par AVAX/USDT puede volver a probar el soporte de $31. Un fuerte rebote desde este nivel puede mantener al par dentro del rango entre $31 y $43,50 durante algún tiempo.
The next trending move will likely begin after buyers drive the price above $43.50 or bears pull the pair below the crucial support at $31.
El próximo movimiento de tendencia probablemente comenzará después de que los compradores impulsen el precio por encima de USD 43,50 o los bajistas empujen al par por debajo del soporte crucial de USD 31.
Dogecoin (DOGE) price analysis
Dogecoin has been sustaining below the 20-day EMA ($0.08) for the past few days, but the bears have failed to sink the price to $0.07.
Análisis de precios de Dogecoin (DOGE) Dogecoin se ha mantenido por debajo de la EMA de 20 días ($0,08) durante los últimos días, pero los bajistas no han logrado bajar el precio a $0,07.
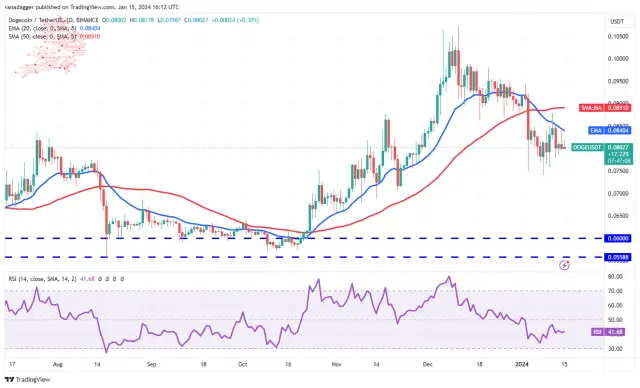
The downsloping 20-day EMA and the RSI in the negative territory indicate an advantage to sellers. If the price turns down from the current level or the 20-day EMA, the bears will again try to sink the DOGE/USDT pair to $0.07.
La EMA de 20 días descendente y el RSI en territorio negativo indican una ventaja para los vendedores. Si el precio baja desde el nivel actual o la EMA de 20 días, los bajistas intentarán nuevamente hundir el par DOGE/USDT a $0,07.
Contrary to this assumption, if the price breaks above the 20-day EMA, it will suggest that the bears are losing their grip. Buyers will then try to propel the pair to the stiff overhead resistance zone between $0.10 and $0.11.
Contrariamente a esta suposición, si el precio supera la EMA de 20 días, sugerirá que los bajistas están perdiendo el control. Luego, los compradores intentarán impulsar el par a la rígida zona de resistencia superior entre USD 0,10 y USD 0,11.
Source – Rakesh Upadhyay
Fuente - Rakesh Upadhyay
Source: https://thebittimes.com/latest-market-overview-15th-jan-spx-dxy-btc-eth-bnb-sol-xrp-ada-avax-doge-tbt76679.html
Fuente: https://thebittimes.com/latest-market-overview-15th-jan-spx-dxy-btc-eth-bnb-sol-xrp-ada-avax-doge-tbt76679.html
 Crypto Intelligence
 DogeHome
 Crypto News Land
 Crypto Daily™
 Crypto Intelligence
 Crypto Daily™
 CaptainAltcoin
 Thecryptoupdates
 Crypto Intelligence


