


The Bitcoin price attempts to stabilise following a significant decline, suggesting that the excessiveness may have dissipated from the market.
比特幣價格在大幅下跌後試圖穩穩,這表明過度交易可能已經從市場上消失。
After years of rejections, the commencement of trading for Bitcoin exchange-traded funds (ETFs) last week did not yield the expected price surge, resulting in total sales of approximately $4.7 billion, as CryptoSlate research and data analyst James Van Straten reported.
根據 CryptoSlate 研究和數據分析師 James Van Straten 報道,經過多年的拒絕,比特幣交易所交易基金 (ETF) 上週開始交易並沒有產生預期的價格飆升,導致總銷售額約為 47 億美元。
The Crypto Fear & Greed Index, previously indicating “extreme greed” with a score of 76, has now shifted to a more neutral level at 52. This transition is viewed positively, indicating a potential reduction in market speculation.
加密貨幣恐懼與貪婪指數先前為 76 分,表示“極度貪婪”,現在已轉向更中性的 52 分。這種轉變被積極看待,表明市場投機活動可能會減少。
With the “sell the news” event now behind us, traders are likely to shift their attention to macroeconomic data, mainly focusing on the actions of the United States Federal Reserve. The Fed is anticipated to initiate rate cuts as early as March, as CME Group’s FedWatch Tool data suggests. If this occurs, it could bode well for risk-assets.
隨著「拋售消息」事件的過去,交易者可能會將注意力轉向宏觀經濟數據,主要關注聯準會的行動。正如芝商所 (CME Group) 的 FedWatch 工具數據所示,預計聯準會最快將於 3 月開始降息。如果發生這種情況,這對風險資產來說可能是個好兆頭。
Is the correction in Bitcoin and other cryptocurrencies complete? Could major digital currencies resume their upward trend in the short term? We will assess the charts to find out.
比特幣和其他加密貨幣的修正完成了嗎?各大數位貨幣短期內能否恢復上漲動能?我們將評估圖表來找出答案。
S&P 500 Index (SPX) price analysis
標準普爾 500 指數 (SPX) 價格分析
The S&P 500 Index turned up from the 20-day exponential moving average (4,727) on Jan. 8, indicating that the uptrend remains intact and traders view the dips as a buying opportunity.
1 月 8 日,標準普爾 500 指數從 20 天指數移動平均線(4,727 點)回升,顯示上升趨勢仍然完好,交易員將逢低視為買入機會。
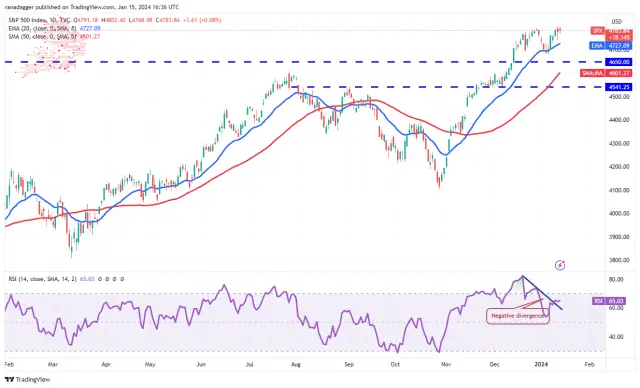
The upsloping moving averages indicate buyers have the upper hand, but the negative divergence on the relative strength index (RSI) warrants caution. If the value maintains above 4,800, the index will likely ascend to the psychologically important level of 5,000.
向上傾斜的移動平均線表示買家佔上風,但相對強弱指數(RSI)的負背離值得謹慎對待。如果該數值維持在4,800點以上,該指數可能會升至5,000點的重要心理水準。
On the downside, the 20-day EMA is the first support to watch. If this level allows, it will suggest that the buying pressure is reducing. The index may then fall to the 50-day simple moving average (4,601).
下檔方面,20 日均線是第一個值得關注的支撐位。如果該水平允許,則表示購買壓力正在減輕。隨後該指數可能會跌至50日簡單移動平均線(4,601)。
U.S. Dollar Index (DXY) price analysis
美元指數(DXY)價格分析
For several days, the U.S. Dollar Index has been consolidating in a downtrend near the 20-day EMA (102).
連續幾天,美元指數一直在 20 日均線(102)附近的下跌趨勢中盤整。
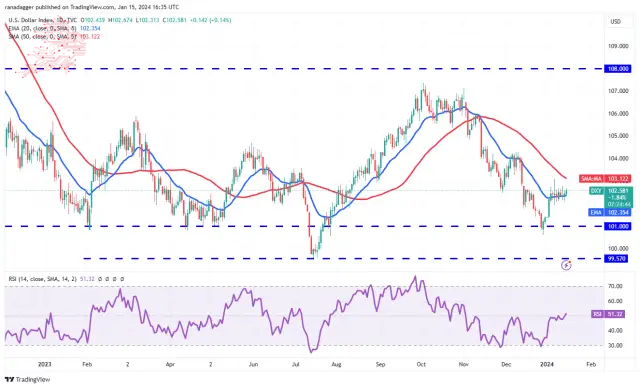
The flat 20-day EMA and the RSI near the midpoint do not give a clear advantage either to the bulls or the bears. If the price sustains below the 20-day EMA, the bears will try to pull the index to the critical support at 101.
持平的 20 日均線和 RSI 接近中點,無論多頭或空頭都沒有明顯的優勢。如果價格維持在 20 日均線下方,空頭將試圖將指數拉至 101 的關鍵支撐位。
On the upside, the bulls will likely face selling at the 50-day SMA (103). A break and close above the 50-day SMA will suggest the start of a more robust recovery to 104.50. This level may again witness strong selling by the bears.
從好的方面來看,多頭可能會面臨 50 日移動平均線 (103) 的拋售。突破並收盤於 50 日移動平均線上方將表明將開始更強勁的復甦至 104.50。該水平可能會再次見證空頭的強勁拋售。
Bitcoin (BTC) price analysis
比特幣(BTC)價格分析
Bitcoin broke and closed below the support line on Jan. 14, signalling that the bears are trying to make a comeback.
1 月 14 日,比特幣突破並收在支撐線下方,顯示空頭正試圖捲土重來。
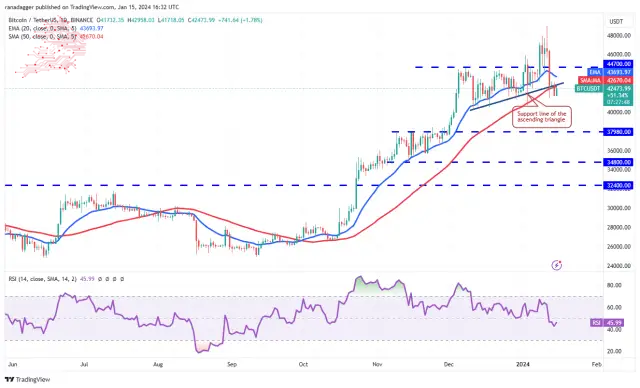
The 20-day EMA ($43,693) has started to turn down, and the RSI is near 46, suggesting that the bears hold a slight edge.
20 日均線(43,693 美元)已開始下跌,RSI 接近 46,顯示空頭略有優勢。
Any recovery attempt is likely to face selling at the 20-day EMA. If the price turns down from the overhead resistance, the sentiment will shift from buying on dips to selling on rallies. The BTC/USDT pair may fall to $40,000 and later to $37,980.
任何復甦嘗試都可能面臨 20 日均線的拋售。如果價格從上方阻力位回落,市場情緒將從逢低買進轉向逢高賣出。 BTC/USDT 貨幣對可能會跌至 40,000 美元,隨後跌至 37,980 美元。
Contrary to this assumption, if buyers overcome the barrier at $44,700, it will suggest that the corrective phase may be over. The pair will then try to reach the psychologically important level of $50,000.
與這一假設相反,如果買家突破 44,700 美元的關口,則表示修正階段可能已經結束。然後,該貨幣對將嘗試達到 50,000 美元的重要心理水平。
Ether (ETH) price analysis
以太幣(ETH)價格分析
以太幣正在上升趨勢中進行修正,多頭試圖將價格保持在 2,458 美元的直接支撐位之上。
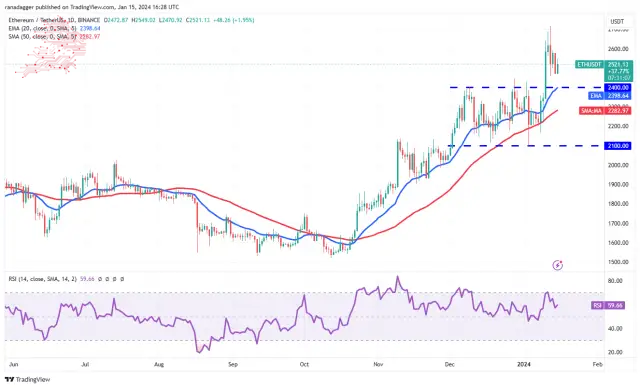
The upsloping 20-day EMA ($2,398) and the RSI in the positive zone indicate that the bulls are in command. If the price rises from the current level or rebounds off $2,400, it will signal strong buying on dips. The ETH/USDT pair may then rally to $2,717. If this level is scaled, the next stop could be $3,000.
上升的 20 日均線(2,398 美元)和 RSI 處於正區表明多頭處於主導地位。如果價格從當前水準上漲或從 2,400 美元反彈,則將表明逢低買盤強勁。隨後 ETH/USDT 貨幣對可能會上漲至 2,717 美元。如果突破這個水平,下一站可能是 3,000 美元。
This optimistic view will be negated in the near term if the price continues lower and plunges below $2,400. That could sink the pair to the 50-day SMA ($2,282) and eventually to $2,100.
如果價格繼續走低並跌破 2,400 美元,這種樂觀看法將在短期內被否定。這可能導致該貨幣對跌至 50 日移動平均線(2,282 美元),並最終跌至 2,100 美元。
BNB price analysis
BNB價格分析
BNB dipped below the 20-day EMA ($301) on Jan. 12, but the bears could not sustain the price below the 61.8% Fibonacci retracement level of $291.
BNB 於 1 月 12 日跌破 20 日均線(301 美元),但空頭無法將價格維持在 61.8% 斐波那契回檔位 291 美元以下。
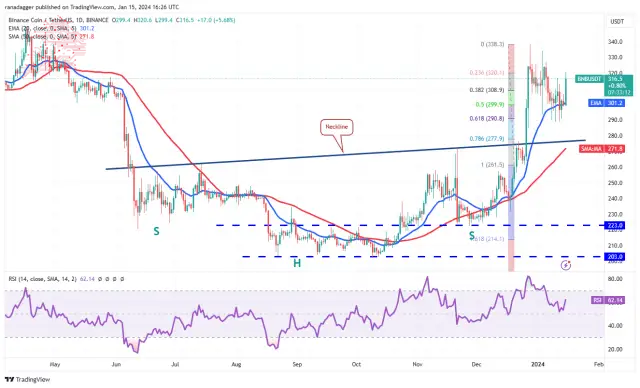
That started a relief rally, which picked up momentum on Jan. 15. If buyers hold the price above $317, the BNB/USDT pair could rise to $338 and then to $350 afterwards. The $350 level will likely attract strong selling by the bears, but if bulls overcome this barrier, the pair may soar to $400.
這引發了一輪緩解性反彈,並於 1 月 15 日加速上漲勢頭。如果買家將價格維持在 317 美元以上,BNB/USDT 貨幣對可能會升至 338 美元,然後升至 350 美元。 350 美元的水平可能會吸引空頭的強烈拋售,但如果多頭克服這一障礙,該貨幣對可能會飆升至 400 美元。
The critical level to watch on the downside is $291 because a slump below it could tug the price to the neckline.
下檔方面值得關注的關鍵水準是 291 美元,因為跌破該水準可能會將價格拉至頸線。
XRP price analysis
Attempts by the bulls to start a recovery in XRP stalled near the downtrend line on Jan. 11, suggesting that the bears remain in control.
XRP 價格分析 1 月 11 日,多頭試圖開始恢復 XRP,但在下降趨勢線附近陷入停滯,這表明空頭仍處於控制之中。
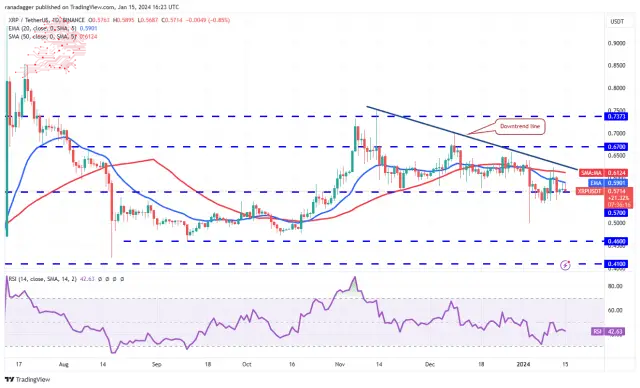
The downsloping 20-day EMA ($0.59) and the RSI below 43 suggest that the path of least resistance is to the downside. The selling could accelerate if the price plummets below the $0.56 support. That will clear the path for a drop to $0.50 and then $0.46.
向下傾斜的 20 日均線(0.59 美元)和 RSI 低於 43 表明阻力最小的路徑是下行。如果價格跌破 0.56 美元的支撐位,拋售可能會加速。這將為價格跌至 0.50 美元,然後跌至 0.46 美元掃清道路。
To prevent the decline, buyers must shove the XRP/USDT pair above the downtrend line. That will invalidate the bearish pattern and start a relief rally to $0.67 and eventually to $0.74.
為了防止下跌,買家必須將 XRP/USDT 貨幣對推至下降趨勢線上方。這將使看跌模式失效,並開始反彈至 0.67 美元,最終至 0.74 美元。
Solana (SOL) price analysis
Solana (SOL) 價格分析
Solana returned from the downtrend line on Jan. 14, indicating that the bears vigorously protect the level.
Solana 於 1 月 14 日從下降趨勢線回歸,表明空頭大力保護該水平。
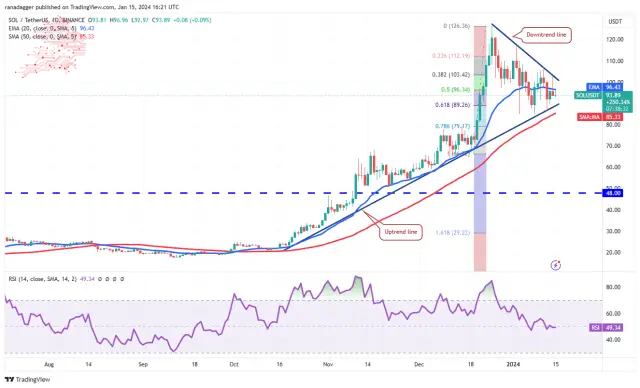
The 20-day EMA ($96) has flattened out, and the RSI is near the midpoint, signalling a balance between supply and demand. If the price skids below the uptrend line, the SOL/USDT pair may tumble to $67.
20 日均線(96 美元)已趨於平緩,RSI 接近中點,顯示供需平衡。如果價格跌破上升趨勢線,SOL/USDT 貨幣對可能會跌至 67 美元。
Alternatively, if the price rises above the downtrend line, it will suggest that the correction may be over. The pair could then travel to $117 and later to $126. Buyers will have to clear this hurdle to signal the resumption of the uptrend.
或者,如果價格升至下降趨勢線之上,則表示調整可能已經結束。隨後該貨幣對可能升至 117 美元,隨後升至 126 美元。買家必須清除這一障礙才能發出上升趨勢恢復的信號。
Cardano (ADA) price analysis
Cardano has been falling inside a descending channel pattern for several days, but a minor positive is that the bulls have maintained the price above the breakout level of $0.46.
卡爾達諾 (ADA) 價格分析 卡爾達諾幾天來一直處於下降通道模式內,但一個小小的積極因素是多頭將價格維持在 0.46 美元的突破水平之上。
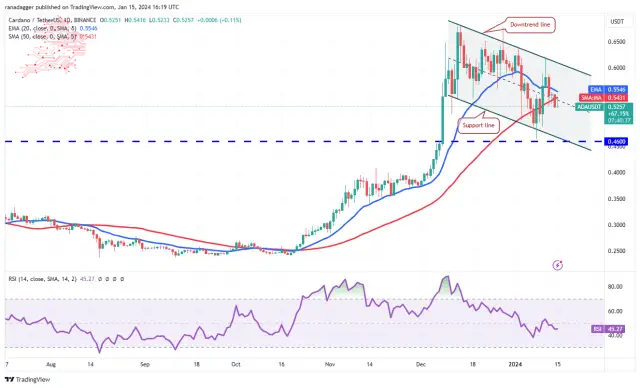
If buyers kick the price above the 20-day EMA ($0.55), the ADA/USDT pair could climb to the channel’s downtrend line. A break and close above the channel will indicate that the downtrend could be over. The pair may then surge to the overhead resistance at $0.68.
如果買家將價格推至 20 日均線(0.55 美元)上方,ADA/USDT 貨幣對可能會攀升至該通道的下降趨勢線。突破並收於通道上方將表示下降趨勢可能結束。隨後該貨幣對可能會飆升至上方阻力位 0.68 美元。
Contrarily, if the price turns down from the 20-day EMA, it will suggest that the bears continue to sell on rallies. That will increase the likelihood of the pair dropping to the channel’s support line, where the buyers are likely to step in.
反之,如果價格從20日均線下跌,則表示空頭繼續逢高賣出。這將增加該貨幣對跌至通道支撐線的可能性,買家可能會介入。
Avalanche (AVAX) price analysis
雪崩 (AVAX) 價格分析
Avalanche has been trading below the breakdown of $38 since Jan. 12, but the bears have failed to sink the price to the strong support at $31.
自 1 月 12 日以來,Avalanche 的交易價格一直低於 38 美元,但空頭未能將價格降至 31 美元的強勁支撐位。
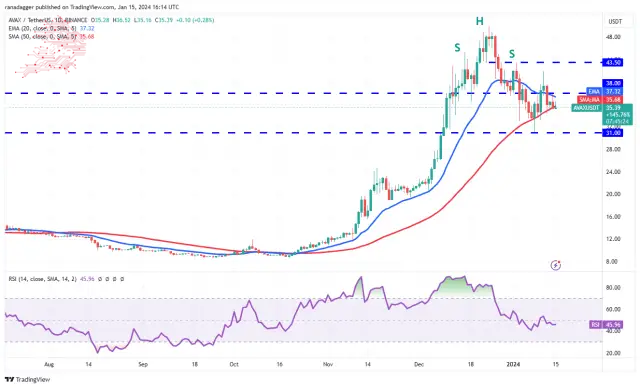
The 20-day EMA ($37.32) is gradually sloping down, and the RSI is just below the midpoint, indicating a slight advantage to the sellers. If the 50-day SMA ($35.68) support gives way, the AVAX/USDT pair may retest the $31 support. A strong bounce off this level may keep the pair rangebound between $31 and $43.50 for some time.
20 日均線(37.32 美元)逐漸向下,RSI 略低於中點,顯示空頭略有優勢。如果 50 日移動平均線(35.68 美元)支撐位失守,AVAX/USDT 貨幣對可能會重新測試 31 美元支撐位。從該水平強勁反彈可能會在一段時間內使該貨幣對在 31 美元至 43.50 美元之間波動。
The next trending move will likely begin after buyers drive the price above $43.50 or bears pull the pair below the crucial support at $31.
下一個趨勢走勢可能會在買家將價格推高至 43.50 美元上方或空頭將貨幣對拉至關鍵支撐位 31 美元以下後開始。
Dogecoin (DOGE) price analysis
Dogecoin has been sustaining below the 20-day EMA ($0.08) for the past few days, but the bears have failed to sink the price to $0.07.
狗狗幣 (DOGE) 價格分析 過去幾天狗狗幣一直維持在 20 日均線(0.08 美元)下方,但空頭未能將價格降至 0.07 美元。
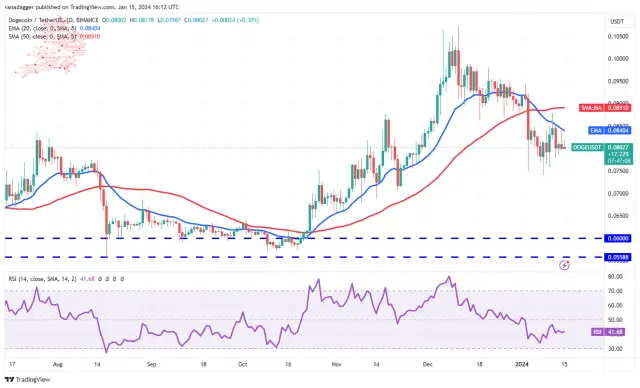
The downsloping 20-day EMA and the RSI in the negative territory indicate an advantage to sellers. If the price turns down from the current level or the 20-day EMA, the bears will again try to sink the DOGE/USDT pair to $0.07.
下降的 20 日均線和 RSI 處於負值區域表示賣家有優勢。如果價格從目前水準或 20 日均線下跌,空頭將再次嘗試將 DOGE/USDT 貨幣對跌至 0.07 美元。
Contrary to this assumption, if the price breaks above the 20-day EMA, it will suggest that the bears are losing their grip. Buyers will then try to propel the pair to the stiff overhead resistance zone between $0.10 and $0.11.
與這一假設相反,如果價格突破 20 日均線,則表示空頭正在失去控制。然後,買家將嘗試將該貨幣對推至 0.10 美元至 0.11 美元之間的剛性上方阻力區。
Source – Rakesh Upadhyay
來源——Rakesh Upadhyay
Source: https://thebittimes.com/latest-market-overview-15th-jan-spx-dxy-btc-eth-bnb-sol-xrp-ada-avax-doge-tbt76679.html
資料來源:https://thebittimes.com/latest-market-overview-15th-jan-spx-dxy-btc-eth-bnb-sol-xrp-ada-avax-doge-tbt76679.html
 DT News
 DogeHome
 TheCoinrise
 Optimisus
 Optimisus
 COINTURK NEWS
 Crypto News Land
 Cryptopolitan_News
 BlockchainReporter


