


The Bitcoin price attempts to stabilise following a significant decline, suggesting that the excessiveness may have dissipated from the market.
비트코인 가격은 크게 하락한 후 안정을 시도하며, 이는 과잉 가격이 시장에서 사라졌을 수 있음을 시사합니다.
After years of rejections, the commencement of trading for Bitcoin exchange-traded funds (ETFs) last week did not yield the expected price surge, resulting in total sales of approximately $4.7 billion, as CryptoSlate research and data analyst James Van Straten reported.
수년간의 거부 끝에 지난주 비트코인 상장지수펀드(ETF) 거래 개시는 예상했던 가격 급등을 가져오지 못했고, CryptoSlate 연구 및 데이터 분석가인 James Van Straten이 보고한 대로 약 47억 달러의 총 매출을 기록했습니다.
The Crypto Fear & Greed Index, previously indicating “extreme greed” with a score of 76, has now shifted to a more neutral level at 52. This transition is viewed positively, indicating a potential reduction in market speculation.
이전에 76점으로 '극단적인 탐욕'을 나타냈던 암호화폐 공포 및 탐욕 지수는 이제 52점으로 좀 더 중립적인 수준으로 이동했습니다. 이러한 변화는 긍정적으로 평가되어 시장 투기의 잠재적 감소를 나타냅니다.
With the “sell the news” event now behind us, traders are likely to shift their attention to macroeconomic data, mainly focusing on the actions of the United States Federal Reserve. The Fed is anticipated to initiate rate cuts as early as March, as CME Group’s FedWatch Tool data suggests. If this occurs, it could bode well for risk-assets.
이제 "뉴스 판매" 이벤트가 종료됨에 따라 거래자들은 주로 미국 연방준비제도(Fed)의 조치에 초점을 맞춘 거시경제 데이터로 관심을 돌릴 가능성이 높습니다. CME 그룹의 FedWatch Tool 데이터에 따르면 연준은 이르면 3월부터 금리 인하를 시작할 것으로 예상됩니다. 이런 일이 발생하면 위험 자산에 좋은 징조가 될 수 있습니다.
Is the correction in Bitcoin and other cryptocurrencies complete? Could major digital currencies resume their upward trend in the short term? We will assess the charts to find out.
비트코인 및 기타 암호화폐의 수정이 완료되었나요? 주요 디지털 화폐가 단기적으로 상승세를 재개할 수 있을까요? 우리는 차트를 평가하여 알아낼 것입니다.
S&P 500 Index (SPX) price analysis
S&P 500 지수(SPX) 가격 분석
The S&P 500 Index turned up from the 20-day exponential moving average (4,727) on Jan. 8, indicating that the uptrend remains intact and traders view the dips as a buying opportunity.
S&P 500 지수는 1월 8일 20일 지수 이동 평균(4,727)에서 상승세를 유지하고 있으며 트레이더들은 하락세를 매수 기회로 보고 있음을 나타냅니다.
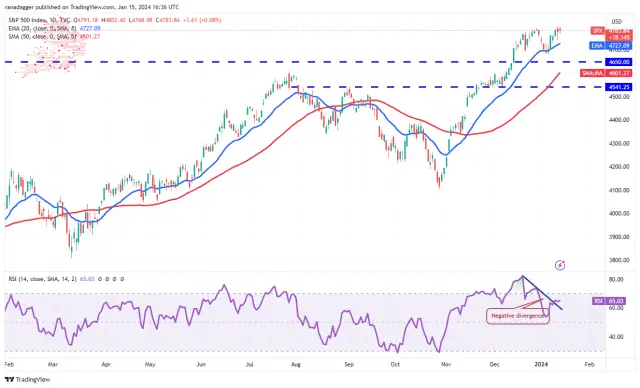
The upsloping moving averages indicate buyers have the upper hand, but the negative divergence on the relative strength index (RSI) warrants caution. If the value maintains above 4,800, the index will likely ascend to the psychologically important level of 5,000.
상승하는 이동평균은 구매자가 우위를 점하고 있음을 의미하지만 상대강도지수(RSI)의 마이너스 다이버전스는 주의가 필요합니다. 4,800 이상을 유지한다면 심리적으로 중요한 수준인 5,000까지 상승할 가능성이 높습니다.
On the downside, the 20-day EMA is the first support to watch. If this level allows, it will suggest that the buying pressure is reducing. The index may then fall to the 50-day simple moving average (4,601).
단점은 20일 EMA가 가장 먼저 주목해야 할 지지선이라는 것입니다. 이 수준이 허용된다면 구매 압력이 감소하고 있음을 의미합니다. 그러면 지수는 50일 단순 이동 평균(4,601)까지 떨어질 수 있습니다.
U.S. Dollar Index (DXY) price analysis
미국 달러 지수(DXY) 가격 분석
For several days, the U.S. Dollar Index has been consolidating in a downtrend near the 20-day EMA (102).
며칠 동안 미국 달러 지수는 20일 EMA(102) 근처에서 하락 추세로 굳건해졌습니다.
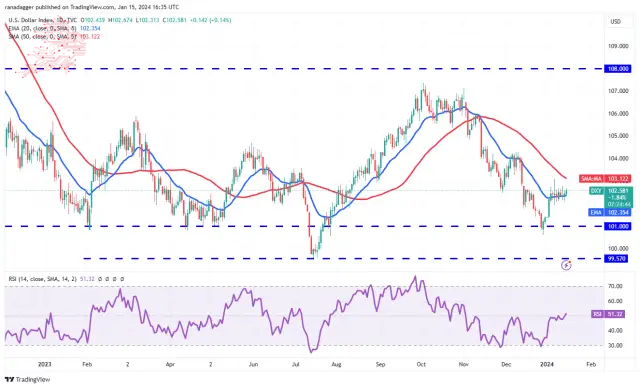
The flat 20-day EMA and the RSI near the midpoint do not give a clear advantage either to the bulls or the bears. If the price sustains below the 20-day EMA, the bears will try to pull the index to the critical support at 101.
20일 EMA와 중간 지점 근처의 RSI는 상승세나 하락세 모두에게 확실한 이점을 제공하지 않습니다. 가격이 20일 EMA 아래로 유지되면 하락세는 지수를 중요한 지지선인 101까지 끌어내리려고 시도할 것입니다.
On the upside, the bulls will likely face selling at the 50-day SMA (103). A break and close above the 50-day SMA will suggest the start of a more robust recovery to 104.50. This level may again witness strong selling by the bears.
긍정적인 측면에서는 상승세가 50일 SMA(103)에서 매도될 가능성이 높습니다. 50일 SMA 위의 중단 및 마감은 104.50까지 더욱 강력한 회복의 시작을 의미합니다. 이 수준에서는 곰의 강력한 매도가 다시 나타날 수 있습니다.
Bitcoin (BTC) price analysis
비트코인(BTC) 가격 분석
Bitcoin broke and closed below the support line on Jan. 14, signalling that the bears are trying to make a comeback.
비트코인은 1월 14일 지지선 아래에서 무너지고 마감되었으며, 이는 하락세가 복귀를 시도하고 있음을 나타냅니다.
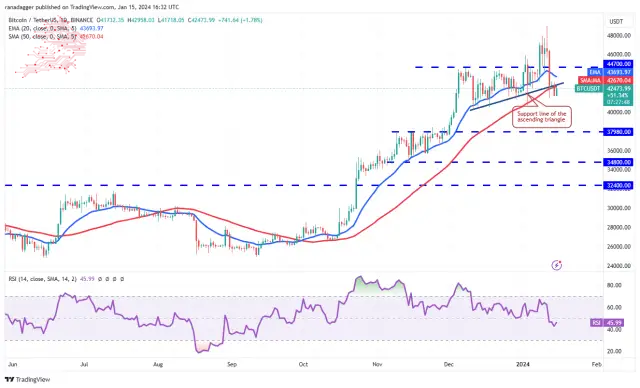
The 20-day EMA ($43,693) has started to turn down, and the RSI is near 46, suggesting that the bears hold a slight edge.
20일 EMA($43,693)가 하락하기 시작했고 RSI가 46에 가까워 하락세가 약간 우위를 점하고 있음을 시사합니다.
Any recovery attempt is likely to face selling at the 20-day EMA. If the price turns down from the overhead resistance, the sentiment will shift from buying on dips to selling on rallies. The BTC/USDT pair may fall to $40,000 and later to $37,980.
모든 회복 시도는 20일 EMA에서 매도될 가능성이 높습니다. 가격이 간접 저항으로 인해 하락하면 심리는 하락 시 매수에서 상승 시 매도로 전환됩니다. BTC/USDT 쌍은 $40,000까지 하락할 수 있으며 나중에는 $37,980까지 떨어질 수 있습니다.
Contrary to this assumption, if buyers overcome the barrier at $44,700, it will suggest that the corrective phase may be over. The pair will then try to reach the psychologically important level of $50,000.
이러한 가정과는 반대로 구매자가 $44,700의 장벽을 극복하면 조정 단계가 끝났을 수 있음을 의미합니다. 그러면 그 쌍은 심리적으로 중요한 $50,000 수준에 도달하려고 노력할 것입니다.
Ether (ETH) price analysis
이더(ETH) 가격 분석
Ether는 상승 추세에서 조정을 받고 있으며 상승세는 가격을 즉각적인 지지선인 2,458달러 이상으로 유지하려고 노력하고 있습니다.
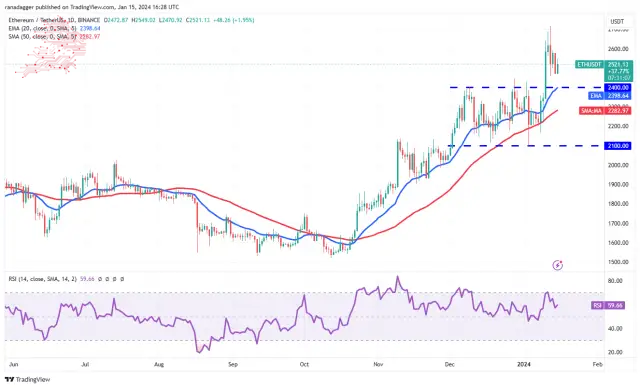
The upsloping 20-day EMA ($2,398) and the RSI in the positive zone indicate that the bulls are in command. If the price rises from the current level or rebounds off $2,400, it will signal strong buying on dips. The ETH/USDT pair may then rally to $2,717. If this level is scaled, the next stop could be $3,000.
상승세를 보이는 20일 EMA($2,398)와 플러스 영역의 RSI는 강세가 지배하고 있음을 나타냅니다. 가격이 현재 수준에서 상승하거나 $2,400에서 반등한다면 하락 시 강력한 매수 신호가 될 것입니다. 그러면 ETH/USDT 쌍은 $2,717까지 상승할 수 있습니다. 이 수준이 확장되면 다음 정류장은 $3,000가 될 수 있습니다.
This optimistic view will be negated in the near term if the price continues lower and plunges below $2,400. That could sink the pair to the 50-day SMA ($2,282) and eventually to $2,100.
가격이 계속 낮아지고 2,400달러 아래로 떨어지면 이러한 낙관적인 견해는 단기적으로 무효화될 것입니다. 이로 인해 해당 쌍은 50일 SMA($2,282)로 하락하고 결국 $2,100까지 하락할 수 있습니다.
BNB price analysis
BNB 가격 분석
BNB dipped below the 20-day EMA ($301) on Jan. 12, but the bears could not sustain the price below the 61.8% Fibonacci retracement level of $291.
BNB는 1월 12일 20일 EMA($301) 아래로 떨어졌지만 하락세는 61.8% 피보나치 되돌림 수준인 $291 아래에서 가격을 유지할 수 없었습니다.
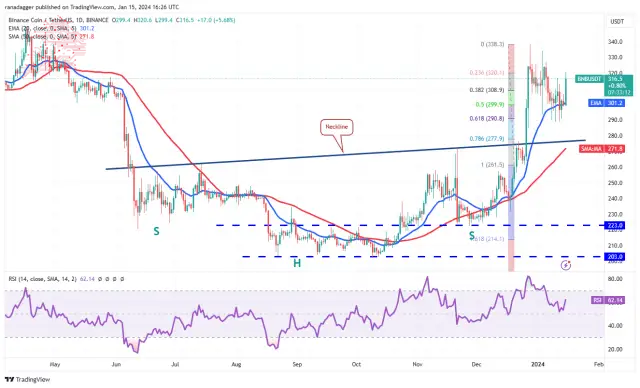
That started a relief rally, which picked up momentum on Jan. 15. If buyers hold the price above $317, the BNB/USDT pair could rise to $338 and then to $350 afterwards. The $350 level will likely attract strong selling by the bears, but if bulls overcome this barrier, the pair may soar to $400.
이로 인해 안도의 랠리가 시작되었고 1월 15일에 탄력이 붙었습니다. 구매자가 가격을 317달러 이상으로 유지하면 BNB/USDT 쌍은 338달러까지 상승한 다음 나중에 350달러까지 상승할 수 있습니다. $350 수준은 약세자들의 강력한 매도를 유도할 가능성이 높지만 강세가 이 장벽을 극복하면 쌍은 $400까지 급등할 수 있습니다.
The critical level to watch on the downside is $291 because a slump below it could tug the price to the neckline.
하락세를 관찰해야 할 중요한 수준은 $291입니다. 그 아래로 하락하면 가격이 목선까지 끌어당길 수 있기 때문입니다.
XRP price analysis
Attempts by the bulls to start a recovery in XRP stalled near the downtrend line on Jan. 11, suggesting that the bears remain in control.
XRP 가격 분석 XRP 회복을 시작하려는 상승세의 시도는 1월 11일 하락 추세선 근처에서 중단되었으며, 이는 하락세가 여전히 통제력을 유지하고 있음을 시사합니다.
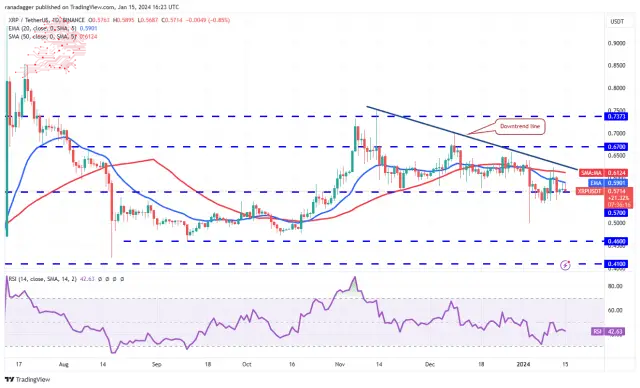
The downsloping 20-day EMA ($0.59) and the RSI below 43 suggest that the path of least resistance is to the downside. The selling could accelerate if the price plummets below the $0.56 support. That will clear the path for a drop to $0.50 and then $0.46.
하락세를 보이는 20일 EMA($0.59)와 RSI가 43 미만인 것은 저항이 가장 적은 경로가 하락세임을 나타냅니다. 가격이 $0.56 지지선 아래로 떨어지면 판매가 가속화될 수 있습니다. 그러면 $0.50로 하락한 다음 $0.46으로 하락할 수 있는 경로가 정리됩니다.
To prevent the decline, buyers must shove the XRP/USDT pair above the downtrend line. That will invalidate the bearish pattern and start a relief rally to $0.67 and eventually to $0.74.
하락을 방지하려면 구매자는 XRP/USDT 쌍을 하락 추세선 위로 올려야 합니다. 이는 약세 패턴을 무효화하고 0.67달러, 결국 0.74달러까지 안도 랠리를 시작하게 됩니다.
Solana (SOL) price analysis
솔라나(SOL) 가격 분석
Solana returned from the downtrend line on Jan. 14, indicating that the bears vigorously protect the level.
솔라나는 1월 14일 하락 추세선에서 복귀했는데, 이는 하락세가 적극적으로 수준을 보호하고 있음을 나타냅니다.
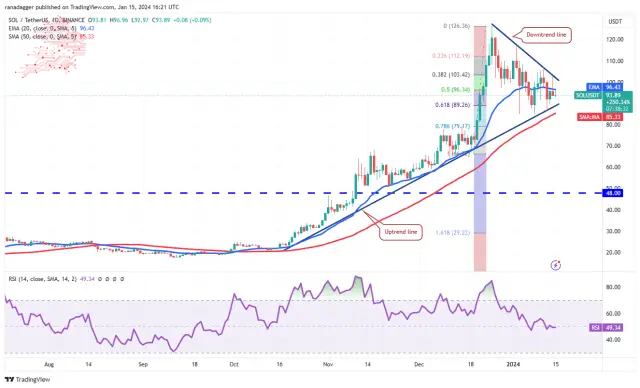
The 20-day EMA ($96) has flattened out, and the RSI is near the midpoint, signalling a balance between supply and demand. If the price skids below the uptrend line, the SOL/USDT pair may tumble to $67.
20일 EMA(96달러)는 평준화되었고 RSI는 중간 지점에 가까워 수요와 공급의 균형을 나타냅니다. 가격이 상승 추세선 아래로 미끄러지면 SOL/USDT 쌍이 67달러로 하락할 수 있습니다.
Alternatively, if the price rises above the downtrend line, it will suggest that the correction may be over. The pair could then travel to $117 and later to $126. Buyers will have to clear this hurdle to signal the resumption of the uptrend.
또는 가격이 하락 추세선 위로 상승하면 조정이 끝났음을 의미합니다. 그러면 그 쌍은 $117까지, 나중에는 $126까지 이동할 수 있습니다. 구매자는 상승 추세의 재개를 알리기 위해 이 장애물을 제거해야 합니다.
Cardano (ADA) price analysis
Cardano has been falling inside a descending channel pattern for several days, but a minor positive is that the bulls have maintained the price above the breakout level of $0.46.
Cardano(ADA) 가격 분석 Cardano는 며칠 동안 하락 채널 패턴에 속해 있었지만, 약간 긍정적인 점은 상승세가 돌파 수준인 $0.46 이상을 유지했다는 것입니다.
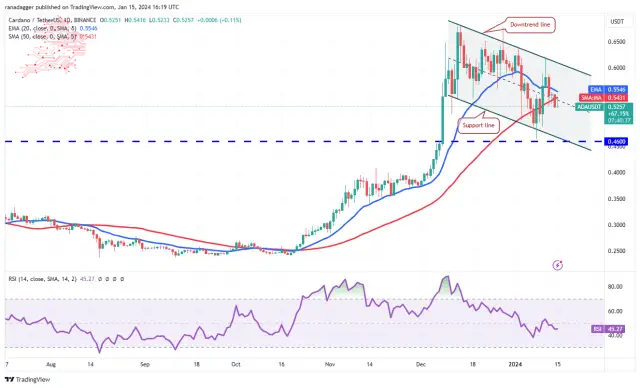
If buyers kick the price above the 20-day EMA ($0.55), the ADA/USDT pair could climb to the channel’s downtrend line. A break and close above the channel will indicate that the downtrend could be over. The pair may then surge to the overhead resistance at $0.68.
구매자가 20일 EMA(0.55달러) 이상으로 가격을 높이면 ADA/USDT 쌍이 채널의 하락 추세선으로 올라갈 수 있습니다. 채널 위의 돌파 및 종가는 하락 추세가 끝났음을 나타냅니다. 그러면 해당 쌍은 $0.68의 머리 위 저항선까지 급등할 수 있습니다.
Contrarily, if the price turns down from the 20-day EMA, it will suggest that the bears continue to sell on rallies. That will increase the likelihood of the pair dropping to the channel’s support line, where the buyers are likely to step in.
반대로 가격이 20일 EMA에서 하락한다면 하락세는 랠리에서 계속 매도한다는 의미입니다. 그러면 구매자가 개입할 가능성이 있는 채널의 지원 라인으로 쌍이 떨어질 가능성이 높아집니다.
Avalanche (AVAX) price analysis
Avalanche(AVAX) 가격 분석
Avalanche has been trading below the breakdown of $38 since Jan. 12, but the bears have failed to sink the price to the strong support at $31.
Avalanche는 1월 12일부터 $38 이하로 거래되고 있지만 하락세는 $31의 강력한 지지선까지 떨어지지 못했습니다.
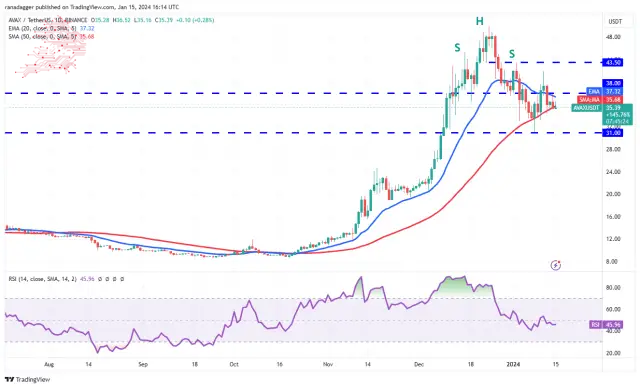
The 20-day EMA ($37.32) is gradually sloping down, and the RSI is just below the midpoint, indicating a slight advantage to the sellers. If the 50-day SMA ($35.68) support gives way, the AVAX/USDT pair may retest the $31 support. A strong bounce off this level may keep the pair rangebound between $31 and $43.50 for some time.
20일 EMA($37.32)는 점차 하락하고 있으며 RSI는 중간점 바로 아래에 있어 판매자에게 약간의 이점이 있음을 나타냅니다. 50일 SMA($35.68) 지원이 무너지면 AVAX/USDT 쌍은 $31 지원을 다시 테스트할 수 있습니다. 이 수준에서 강한 반등이 일어나면 한동안 쌍의 범위는 $31에서 $43.50 사이로 유지될 수 있습니다.
The next trending move will likely begin after buyers drive the price above $43.50 or bears pull the pair below the crucial support at $31.
다음 추세 움직임은 구매자가 가격을 $43.50 이상으로 끌어올리거나 하락세가 $31의 중요한 지지선 아래로 끌어내린 후에 시작될 가능성이 높습니다.
Dogecoin (DOGE) price analysis
Dogecoin has been sustaining below the 20-day EMA ($0.08) for the past few days, but the bears have failed to sink the price to $0.07.
Dogecoin(DOGE) 가격 분석 Dogecoin은 지난 며칠 동안 20일 EMA(0.08달러) 미만을 유지해 왔지만 하락세는 가격을 0.07달러로 낮추는 데 실패했습니다.
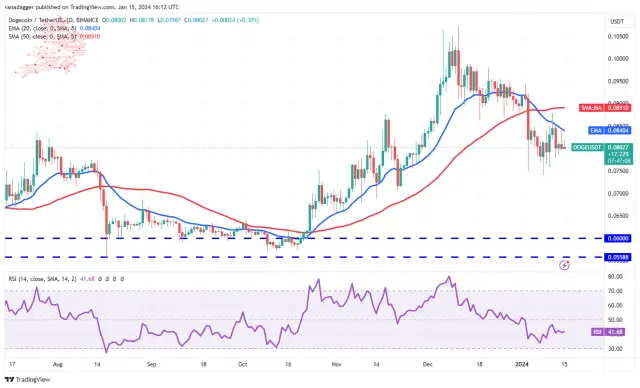
The downsloping 20-day EMA and the RSI in the negative territory indicate an advantage to sellers. If the price turns down from the current level or the 20-day EMA, the bears will again try to sink the DOGE/USDT pair to $0.07.
하락하는 20일 EMA와 마이너스 영역의 RSI는 판매자에게 유리한 점을 나타냅니다. 가격이 현재 수준이나 20일 EMA에서 하락하면 하락세는 다시 DOGE/USDT 쌍을 $0.07로 하락시키려고 시도할 것입니다.
Contrary to this assumption, if the price breaks above the 20-day EMA, it will suggest that the bears are losing their grip. Buyers will then try to propel the pair to the stiff overhead resistance zone between $0.10 and $0.11.
이 가정과 반대로 가격이 20일 EMA를 넘어선다면 하락세의 지배력을 잃고 있음을 의미합니다. 그런 다음 구매자는 $0.10에서 $0.11 사이의 뻣뻣한 머리 위 저항 영역으로 쌍을 추진하려고 합니다.
Source – Rakesh Upadhyay
출처 – Rakesh Upadhyay
Source: https://thebittimes.com/latest-market-overview-15th-jan-spx-dxy-btc-eth-bnb-sol-xrp-ada-avax-doge-tbt76679.html
출처: https://thebittimes.com/latest-market-overview-15th-jan-spx-dxy-btc-eth-bnb-sol-xrp-ada-avax-doge-tbt76679.html
 Crypto News Land
 DogeHome
 Coincu
 Coin Edition
 Coin_Gabbar
 Coincu
 BlockchainReporter


