


The Bitcoin price attempts to stabilise following a significant decline, suggesting that the excessiveness may have dissipated from the market.
ビットコイン価格は大幅な下落を経て安定を目指しており、過剰さが市場から消失した可能性を示唆している。
After years of rejections, the commencement of trading for Bitcoin exchange-traded funds (ETFs) last week did not yield the expected price surge, resulting in total sales of approximately $4.7 billion, as CryptoSlate research and data analyst James Van Straten reported.
CryptoSlateの調査およびデータアナリストのJames Van Straten氏が報告したように、長年の拒否の後、先週開始されたビットコイン上場投資信託(ETF)の取引開始は予想された価格上昇をもたらさず、総売上高は約47億ドルとなったという。
The Crypto Fear & Greed Index, previously indicating “extreme greed” with a score of 76, has now shifted to a more neutral level at 52. This transition is viewed positively, indicating a potential reduction in market speculation.
仮想通貨恐怖&貪欲指数は、以前はスコア 76 で「極度の貪欲」を示していましたが、現在は 52 というより中立的なレベルに移行しています。この移行は前向きに捉えられており、市場の投機が減少する可能性を示しています。
With the “sell the news” event now behind us, traders are likely to shift their attention to macroeconomic data, mainly focusing on the actions of the United States Federal Reserve. The Fed is anticipated to initiate rate cuts as early as March, as CME Group’s FedWatch Tool data suggests. If this occurs, it could bode well for risk-assets.
「ニュースを売る」イベントが過ぎ去り、トレーダーらは主に米連邦準備制度理事会の行動に焦点を当てたマクロ経済データに注目を移す可能性が高い。 CMEグループのFedWatchツールのデータが示唆するように、FRBは早ければ3月にも利下げを開始すると予想されている。これが発生した場合、リスク資産にとって良い前兆となる可能性があります。
Is the correction in Bitcoin and other cryptocurrencies complete? Could major digital currencies resume their upward trend in the short term? We will assess the charts to find out.
ビットコインやその他の仮想通貨の修正は完了しましたか?主要なデジタル通貨は短期的に上昇傾向を再開する可能性があるでしょうか?それを知るためにチャートを評価します。
S&P 500 Index (SPX) price analysis
S&P 500 インデックス (SPX) 価格分析
The S&P 500 Index turned up from the 20-day exponential moving average (4,727) on Jan. 8, indicating that the uptrend remains intact and traders view the dips as a buying opportunity.
S&P 500指数は1月8日の20日間指数移動平均(4,727)から上昇に転じており、上昇傾向が維持されていることを示しており、トレーダーらはこの下落を買いの機会と見ている。
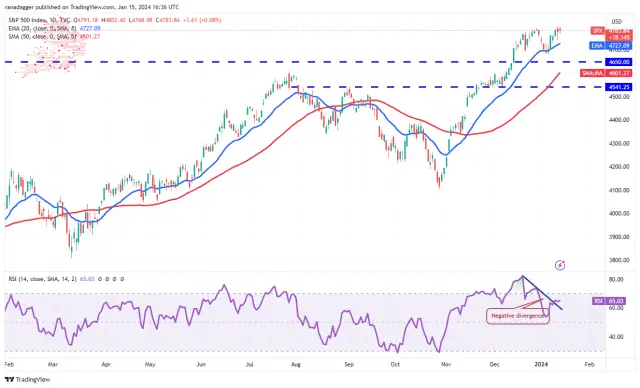
The upsloping moving averages indicate buyers have the upper hand, but the negative divergence on the relative strength index (RSI) warrants caution. If the value maintains above 4,800, the index will likely ascend to the psychologically important level of 5,000.
移動平均線の右上がりは買い手が優勢であることを示していますが、相対力指数 (RSI) のマイナスの乖離には注意が必要です。この値が4,800を超えて維持される場合、指数は心理的に重要なレベルである5,000に上昇する可能性があります。
On the downside, the 20-day EMA is the first support to watch. If this level allows, it will suggest that the buying pressure is reducing. The index may then fall to the 50-day simple moving average (4,601).
マイナス面としては、20日間EMAが最初に注目すべきサポートとなる。この水準が許せば、買い圧力が低下していることを示唆することになる。その後、指数は 50 日単純移動平均 (4,601) まで低下する可能性があります。
U.S. Dollar Index (DXY) price analysis
米ドルインデックス (DXY) 価格分析
For several days, the U.S. Dollar Index has been consolidating in a downtrend near the 20-day EMA (102).
ここ数日間、米ドル指数は 20 日間 EMA (102) 付近で下降傾向にありました。
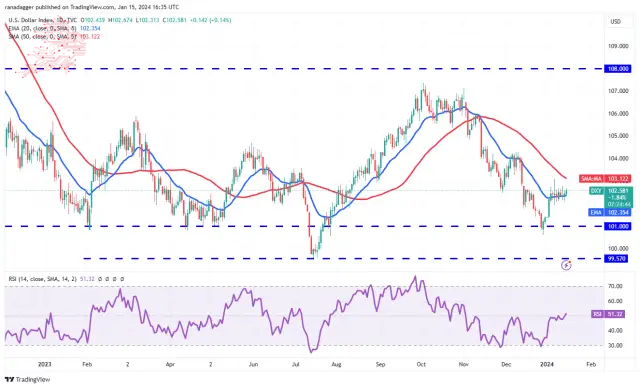
The flat 20-day EMA and the RSI near the midpoint do not give a clear advantage either to the bulls or the bears. If the price sustains below the 20-day EMA, the bears will try to pull the index to the critical support at 101.
横ばいの 20 日間 EMA と中間点付近の RSI は、強気派にも弱気派にも明らかな優位性をもたらしません。価格が20日間EMAを下回った場合、弱気派は指数を重要なサポートである101まで引き上げようとするだろう。
On the upside, the bulls will likely face selling at the 50-day SMA (103). A break and close above the 50-day SMA will suggest the start of a more robust recovery to 104.50. This level may again witness strong selling by the bears.
上昇局面では、強気派は50日間SMA(103)で売りに直面する可能性が高い。 50日間SMAを上抜けて終値を迎えることは、104.50へのより力強い回復の始まりを示唆するだろう。この水準では再び弱気派による強い売りが見られる可能性がある。
Bitcoin (BTC) price analysis
ビットコイン(BTC)価格分析
Bitcoin broke and closed below the support line on Jan. 14, signalling that the bears are trying to make a comeback.
ビットコインは1月14日にサポートラインを下回って引け、弱気派が巻き返しを図っていることを示唆した。
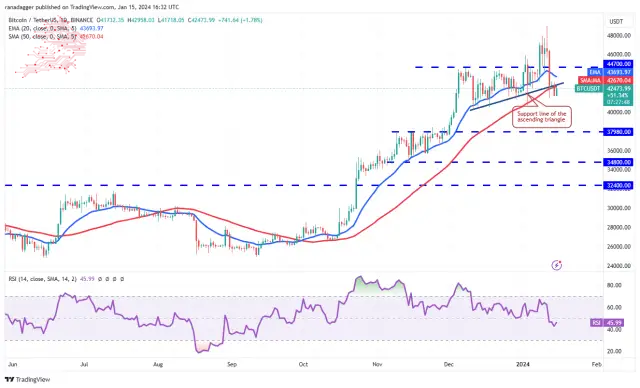
The 20-day EMA ($43,693) has started to turn down, and the RSI is near 46, suggesting that the bears hold a slight edge.
20日間EMA(43,693ドル)は下落し始めており、RSIは46近くにあり、弱気派がわずかに優勢であることを示唆している。
Any recovery attempt is likely to face selling at the 20-day EMA. If the price turns down from the overhead resistance, the sentiment will shift from buying on dips to selling on rallies. The BTC/USDT pair may fall to $40,000 and later to $37,980.
回復を試みても、20日間EMAでは売りに直面する可能性が高い。価格が頭上の抵抗線から下落に転じた場合、センチメントは押し目買いから反発での売りに移行するだろう。 BTC/USDTペアは40,000ドルまで下落し、その後は37,980ドルまで下落する可能性があります。
Contrary to this assumption, if buyers overcome the barrier at $44,700, it will suggest that the corrective phase may be over. The pair will then try to reach the psychologically important level of $50,000.
この想定に反して、買い手が44,700ドルの壁を乗り越えれば、調整段階が終わった可能性があることを示唆することになる。その後、ペアは心理的に重要なレベルである50,000ドルに到達しようとします。
Ether (ETH) price analysis
イーサ(ETH)価格分析
イーサは上昇傾向を修正しており、強気派は価格を当面のサポートである2,458ドルを上回る水準に維持しようとしている。
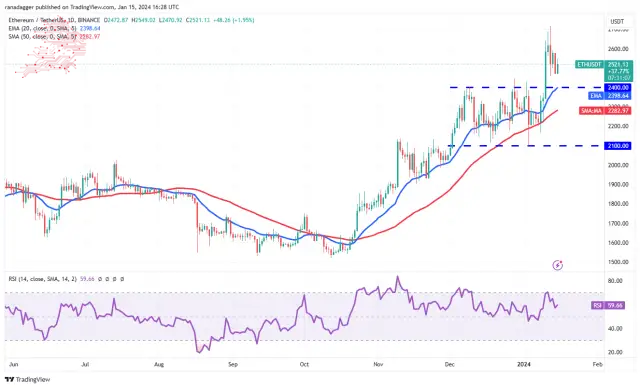
The upsloping 20-day EMA ($2,398) and the RSI in the positive zone indicate that the bulls are in command. If the price rises from the current level or rebounds off $2,400, it will signal strong buying on dips. The ETH/USDT pair may then rally to $2,717. If this level is scaled, the next stop could be $3,000.
20日間EMA(2,398ドル)が右肩上がりで、RSIがプラス圏にあることは、強気派が主導権を握っていることを示している。価格が現在のレベルから上昇するか、2,400ドルから反発する場合、押し目での強い買いのシグナルとなるでしょう。その後、ETH/USDTペアは2,717ドルまで上昇する可能性がある。このレベルがスケールされる場合、次のストップは 3,000 ドルになる可能性があります。
This optimistic view will be negated in the near term if the price continues lower and plunges below $2,400. That could sink the pair to the 50-day SMA ($2,282) and eventually to $2,100.
価格がさらに下落して2,400ドルを下回ると、この楽観的な見方は短期的には打ち消されることになる。これにより、ペアは50日間SMA(2,282ドル)まで下落し、最終的には2,100ドルまで下落する可能性がある。
BNB price analysis
BNB価格分析
BNB dipped below the 20-day EMA ($301) on Jan. 12, but the bears could not sustain the price below the 61.8% Fibonacci retracement level of $291.
BNBは1月12日に20日間EMA(301ドル)を下回りましたが、弱気派は61.8%フィボナッチ・リトレースメントのレベルである291ドルを下回る価格を維持できませんでした。
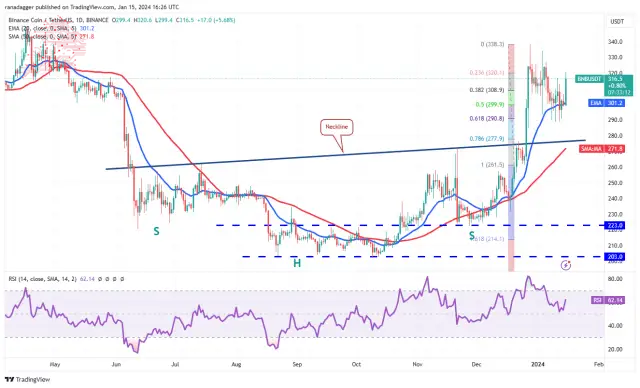
That started a relief rally, which picked up momentum on Jan. 15. If buyers hold the price above $317, the BNB/USDT pair could rise to $338 and then to $350 afterwards. The $350 level will likely attract strong selling by the bears, but if bulls overcome this barrier, the pair may soar to $400.
これで安心相場が始まり、1月15日に勢いが増した。買い手が価格を317ドル以上に維持すれば、BNB/USDTペアは338ドルまで上昇し、その後は350ドルまで上昇する可能性がある。 350ドルの水準は弱気派による強い売りを引き付ける可能性が高いが、強気派がこの壁を乗り越えれば、ペアは400ドルまで急騰する可能性がある。
The critical level to watch on the downside is $291 because a slump below it could tug the price to the neckline.
下値で注意すべき重要な水準は291ドルである。これを下回ると価格がネックラインまで引っ張られる可能性があるためだ。
XRP price analysis
Attempts by the bulls to start a recovery in XRP stalled near the downtrend line on Jan. 11, suggesting that the bears remain in control.
XRP価格分析 強気派によるXRPの回復開始の試みは、1月11日の下降トレンドライン付近で停滞しており、弱気派が依然として主導権を握っていることを示唆しています。
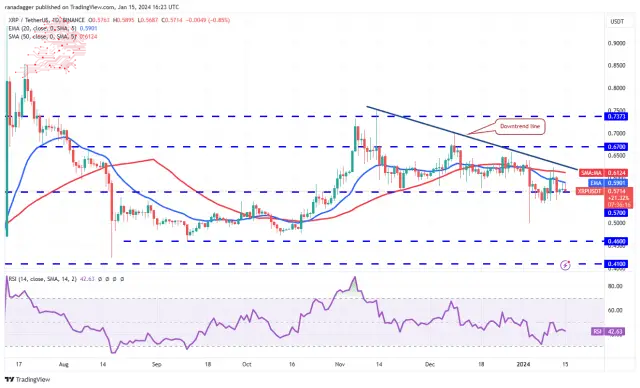
The downsloping 20-day EMA ($0.59) and the RSI below 43 suggest that the path of least resistance is to the downside. The selling could accelerate if the price plummets below the $0.56 support. That will clear the path for a drop to $0.50 and then $0.46.
下り坂の20日間EMA(0.59ドル)と43を下回るRSIは、抵抗が最も少ない道が下値方向であることを示唆している。価格が支持線の0.56ドルを下回ると売りが加速する可能性がある。これにより、0.50ドル、さらに0.46ドルへの下落の道が開かれることになる。
To prevent the decline, buyers must shove the XRP/USDT pair above the downtrend line. That will invalidate the bearish pattern and start a relief rally to $0.67 and eventually to $0.74.
下落を防ぐには、買い手はXRP/USDTペアを下降トレンドラインよりも上に押し上げる必要があります。そうなると弱気パターンは無効となり、0.67ドル、最終的には0.74ドルまでの救済上昇が始まるだろう。
Solana (SOL) price analysis
ソラナ (SOL) 価格分析
Solana returned from the downtrend line on Jan. 14, indicating that the bears vigorously protect the level.
ソラナは1月14日に下降トレンドラインから戻り、弱気派が精力的にレベルを守っていることを示しています。
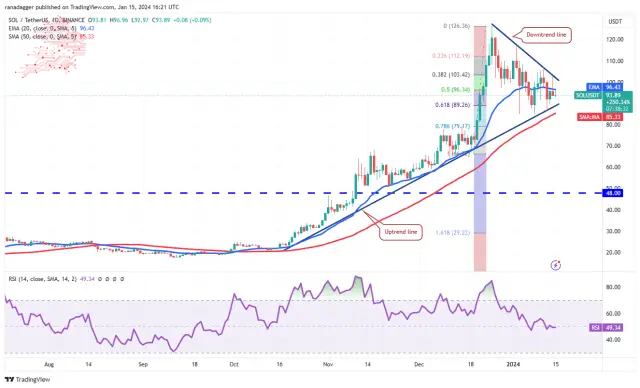
The 20-day EMA ($96) has flattened out, and the RSI is near the midpoint, signalling a balance between supply and demand. If the price skids below the uptrend line, the SOL/USDT pair may tumble to $67.
20日間EMA(96ドル)は横ばいで、RSIは中間点付近にあり、需要と供給のバランスが取れていることを示している。価格が上昇トレンドラインを下回った場合、SOL/USDTペアは67ドルまで下落する可能性があります。
Alternatively, if the price rises above the downtrend line, it will suggest that the correction may be over. The pair could then travel to $117 and later to $126. Buyers will have to clear this hurdle to signal the resumption of the uptrend.
あるいは、価格が下降トレンドラインを超えて上昇した場合は、調整が終了した可能性があることを示唆します。その後、ペアは117ドルに上昇し、その後126ドルに上昇する可能性があります。買い手は上昇トレンドの再開を示すためにこのハードルをクリアする必要がある。
Cardano (ADA) price analysis
Cardano has been falling inside a descending channel pattern for several days, but a minor positive is that the bulls have maintained the price above the breakout level of $0.46.
カルダノ(ADA)価格分析 カルダノはここ数日間、下降チャネルパターン内に陥っていますが、強気派が0.46ドルのブレイクアウトレベルを超える価格を維持していることは小さなプラスです。
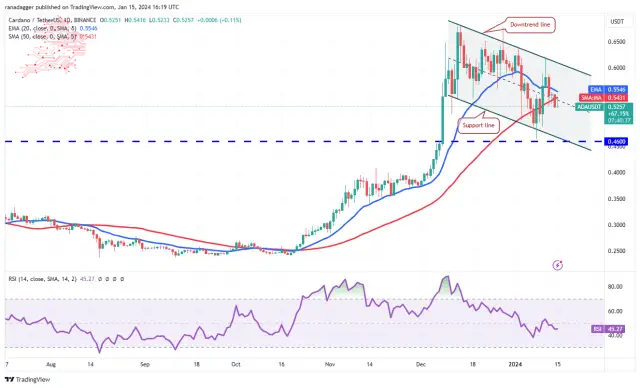
If buyers kick the price above the 20-day EMA ($0.55), the ADA/USDT pair could climb to the channel’s downtrend line. A break and close above the channel will indicate that the downtrend could be over. The pair may then surge to the overhead resistance at $0.68.
買い手が価格を20日間EMA(0.55ドル)を上回った場合、ADA/USDTペアはチャネルの下降トレンドラインまで上昇する可能性があります。チャネルを上抜けて閉じると、下降トレンドが終わった可能性があることを示します。その後、ペアは0.68ドルの直上抵抗線まで急騰する可能性がある。
Contrarily, if the price turns down from the 20-day EMA, it will suggest that the bears continue to sell on rallies. That will increase the likelihood of the pair dropping to the channel’s support line, where the buyers are likely to step in.
逆に、価格が20日間EMAから下落した場合は、弱気派が反発で売りを続けていることを示唆することになる。そうなると、ペアがチャネルのサポートラインまで下落する可能性が高まり、そこで買い手が介入する可能性が高くなります。
Avalanche (AVAX) price analysis
アバランチ (AVAX) 価格分析
Avalanche has been trading below the breakdown of $38 since Jan. 12, but the bears have failed to sink the price to the strong support at $31.
アバランチは1月12日以来、38ドルを下回って取引されているが、弱気派は価格を31ドルの強力なサポートまで下げることができていない。
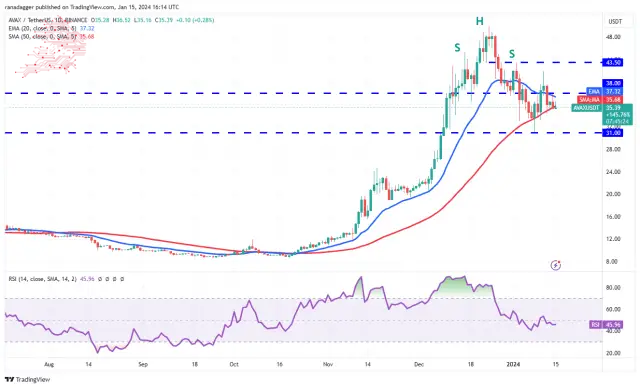
The 20-day EMA ($37.32) is gradually sloping down, and the RSI is just below the midpoint, indicating a slight advantage to the sellers. If the 50-day SMA ($35.68) support gives way, the AVAX/USDT pair may retest the $31 support. A strong bounce off this level may keep the pair rangebound between $31 and $43.50 for some time.
20日間EMA(37.32ドル)は徐々に下降しており、RSIは中間点のすぐ下にあり、売り手がわずかに有利であることを示しています。 50 日間の SMA ($35.68) サポートが放棄された場合、AVAX/USDT ペアは $31 サポートを再テストする可能性があります。このレベルから大きく反発すれば、しばらくの間、ペアは31ドルから43.50ドルの範囲内にとどまる可能性がある。
The next trending move will likely begin after buyers drive the price above $43.50 or bears pull the pair below the crucial support at $31.
次のトレンドの動きは、買い手が価格を43.50ドル以上に押し上げるか、弱気派が重要なサポートである31ドルを下回った後に始まる可能性が高い。
Dogecoin (DOGE) price analysis
Dogecoin has been sustaining below the 20-day EMA ($0.08) for the past few days, but the bears have failed to sink the price to $0.07.
ドージコイン(DOGE)の価格分析 ドージコインは過去数日間、20日間EMA(0.08ドル)を下回って推移しているが、弱気派は価格を0.07ドルまで下げることができなかった。
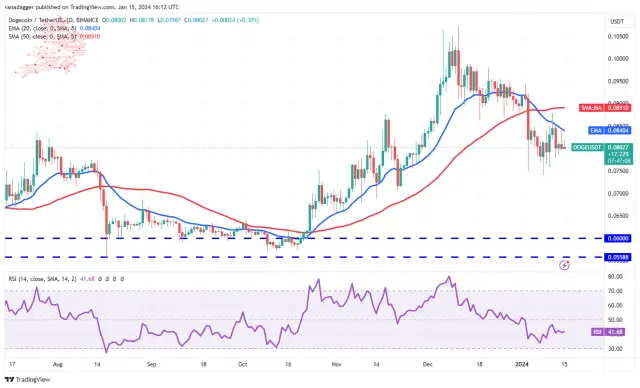
The downsloping 20-day EMA and the RSI in the negative territory indicate an advantage to sellers. If the price turns down from the current level or the 20-day EMA, the bears will again try to sink the DOGE/USDT pair to $0.07.
20 日間 EMA が下降傾向にあり、RSI がマイナス領域にあることは、売り手が有利であることを示しています。価格が現在のレベルまたは20日間EMAから下落した場合、弱気派は再びDOGE/USDTペアを0.07ドルまで下落させようとするだろう。
Contrary to this assumption, if the price breaks above the 20-day EMA, it will suggest that the bears are losing their grip. Buyers will then try to propel the pair to the stiff overhead resistance zone between $0.10 and $0.11.
この想定に反して、価格が20日間EMAを上抜けた場合、弱気派が支配力を失いつつあることを示唆することになる。その後、買い手はペアを0.10ドルから0.11ドルの間の厳しい直上抵抗ゾーンに押し上げようとするだろう。
Source – Rakesh Upadhyay
出典 – ラケシュ・ウパディヤイ
Source: https://thebittimes.com/latest-market-overview-15th-jan-spx-dxy-btc-eth-bnb-sol-xrp-ada-avax-doge-tbt76679.html
出典: https://thebittimes.com/latest-market-overview-15th-jan-spx-dxy-btc-eth-bnb-sol-xrp-ada-avax-doge-tbt76679.html
 DogeHome
 Coin_Gabbar
 Coincu
 BlockchainReporter
 CoinPedia News
 TheNewsCrypto
 CFN
CFN


