


The Bitcoin Market is showing positive signs, though it may encounter significant resistance if it surpasses $72,000.
El mercado de Bitcoin está mostrando signos positivos, aunque puede encontrar una resistencia significativa si supera los 72.000 dólares.
Despite a recent dip, interest in Bitcoin spot exchange-traded funds (ETFs) remains strong. After a week marked by consecutive net outflows, the tide turned with significant net inflows recorded on March 26th and 27th, totalling $418 million and $243 million, respectively, as reported by Farside Investors.
A pesar de una caída reciente, el interés en los fondos cotizados en bolsa (ETF) al contado de Bitcoin sigue siendo fuerte. Después de una semana marcada por salidas netas consecutivas, la marea cambió con importantes entradas netas registradas los días 26 y 27 de marzo, por un total de 418 millones de dólares y 243 millones de dólares, respectivamente, según informó Farside Investors.
In an interview with Fox Business, BlackRock CEO Larry Fink has expressed optimism about the firm’s Bitcoin spot ETF. He remarked on the ETF’s rapid growth, noting it as the quickest to expand in the ETF industry’s history. Fink also conveyed his strong confidence in Bitcoin’s prospects.
En una entrevista con Fox Business, el director ejecutivo de BlackRock, Larry Fink, expresó optimismo sobre el ETF al contado de Bitcoin de la empresa. Destacó el rápido crecimiento de la ETF y señaló que es la expansión más rápida en la historia de la industria de la ETF. Fink también transmitió su gran confianza en las perspectivas de Bitcoin.
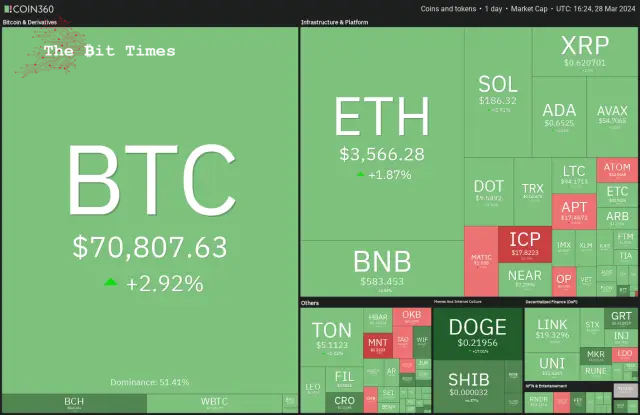
On-chain analytics platform CryptoQuant said in its latest “Weekly Crypto Report” that Bitcoin’s demand skyrocketed from “40K Bitcoin at the start of 2024 to 213K Bitcoin” on March 26. That could create a “sell-side liquidity crisis” within the following year.
La plataforma de análisis en cadena CryptoQuant dijo en su último "Informe criptográfico semanal" que la demanda de Bitcoin se disparó de "40.000 Bitcoin a principios de 2024 a 213.000 Bitcoin" el 26 de marzo. Eso podría crear una "crisis de liquidez del lado de las ventas" en el siguiente año.
Could Bitcoin continue its recovery and hit a new all-time high before the Bitcoin halving? Will that trigger buying in altcoins? Let’s analyze the charts of the top 10 cryptocurrencies to find out.
¿Podría Bitcoin continuar su recuperación y alcanzar un nuevo máximo histórico antes de la reducción a la mitad de Bitcoin? ¿Eso desencadenará la compra de altcoins? Analicemos los gráficos de las 10 principales criptomonedas para descubrirlo.
Bitcoin (BTC) Market Analysis
Análisis del mercado de Bitcoin (BTC)
The Bitcoin market witnessed profit booking on March 26 and 27, but a positive sign is that the bulls maintained the price above the pennant.
El mercado de Bitcoin registró ganancias los días 26 y 27 de marzo, pero una señal positiva es que los alcistas mantuvieron el precio por encima del banderín.
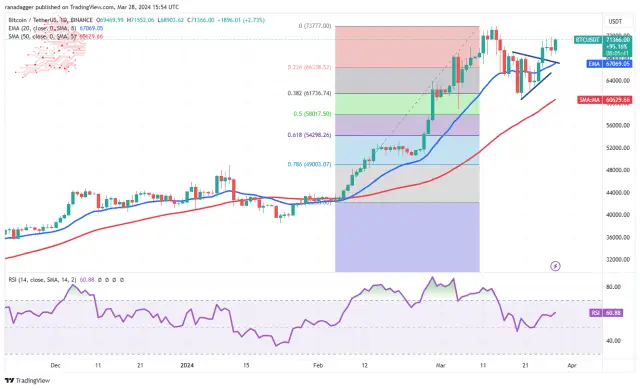
The 20-day exponential moving average (EMA) ($67,069) has started to rise, and the relative strength index (RSI) is in positive territory, suggesting that the path of least resistance is to the upside.
La media móvil exponencial (EMA) de 20 días (67.069 dólares) ha comenzado a subir y el índice de fuerza relativa (RSI) está en territorio positivo, lo que sugiere que el camino de menor resistencia es al alza.
If buyers drive the price above $73,777, the BTC/USDT pair will likely increase momentum and rally to $80,000.
Si los compradores elevan el precio por encima de los USD 73,777, el par BTC/USDT probablemente aumentará el impulso y subirá a los USD 80,000.
On the contrary, if the price declines from its current level and breaks below the 20-day EMA, it could lead to a potential drop to the 50-day simple moving average ($60,629).
Por el contrario, si el precio cae desde su nivel actual y cae por debajo de la EMA de 20 días, podría provocar una posible caída hasta la media móvil simple de 50 días (60.629 dólares).
Ether (ETH) Market Analysis
Análisis de mercado de éter (ETH)
The Ether Market is facing selling near $3,678, but a positive sign is that the bulls are trying to defend the 20-day EMA ($3,530).
El mercado de Ether se enfrenta a ventas cercanas a los 3.678 dólares, pero una señal positiva es que los alcistas están tratando de defender la EMA de 20 días (3.530 dólares).
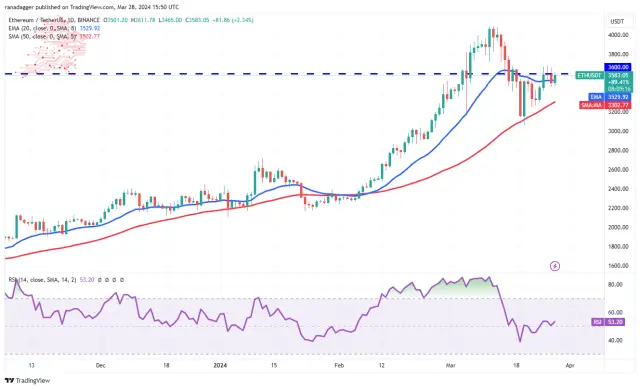
If the price breaks above $3,678, the possibility of a rally to $4,100 increases. This level may act as a stiff hurdle, but if the buyers prevail, the ETH/USDT pair could rally to $4,500 and then to $4,868.
Si el precio supera los $ 3,678, aumenta la posibilidad de un repunte a $ 4,100. Este nivel puede actuar como un obstáculo difícil, pero si los compradores prevalecen, el par ETH/USDT podría subir a $4,500 y luego a $4,868.
Conversely, if the price turns sharply and breaks below $3,460, it will suggest that the bears are unwilling to give up. The pair may then slip to the 50-day SMA ($3,302). A slide below this support could start a deeper correction.
Por el contrario, si el precio gira bruscamente y cae por debajo de $ 3,460, sugerirá que los bajistas no están dispuestos a darse por vencidos. Luego, el par puede caer hasta la SMA de 50 días ($3,302). Una caída por debajo de este soporte podría iniciar una corrección más profunda.
BNB Market Analysis
Análisis del mercado BNB
The long wick on BNB’s March 25 and 26 candlesticks shows that the bears are defending the 61.8% Fibonacci retracement level of $588.
La mecha larga de las velas del BNB del 25 y 26 de marzo muestra que los bajistas están defendiendo el nivel de retroceso de Fibonacci del 61,8% de 588 dólares.
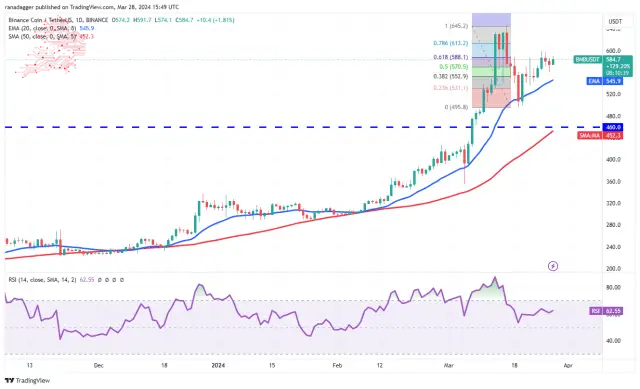
If the price turns down from the current level, the BNB/USDT pair could reach the 20-day EMA ($546). This remains the critical level to watch. If the price rebounds off the 20-day EMA, the pair will again attempt to rise above $600 and reach $645.
Si el precio baja del nivel actual, el par BNB/USDT podría alcanzar la EMA de 20 días ($546). Este sigue siendo el nivel crítico a tener en cuenta. Si el precio rebota en la EMA de 20 días, el par intentará nuevamente subir por encima de los $600 y alcanzar los $645.
On the other hand, if the price drops below the 20-day EMA, it will signal that the bears are trying to gain the upper hand. The pair could then drop to the critical support at $495. The bulls may aggressively buy the dips to this level.
Por otro lado, si el precio cae por debajo de la EMA de 20 días, indicará que los bajistas están tratando de tomar ventaja. Luego, el par podría caer hasta el soporte crítico de 495 dólares. Los alcistas pueden comprar agresivamente en las caídas hasta este nivel.
Solana (SOL) Price Analysis
Análisis de precios de Solana (SOL)
Solana’s recovery is faltering at $196, indicating that the bears sell on relief rallies near the overhead resistance of $205.
La recuperación de Solana está flaqueando en 196 dólares, lo que indica que los bajistas venden en repuntes de alivio cerca de la resistencia superior de 205 dólares.
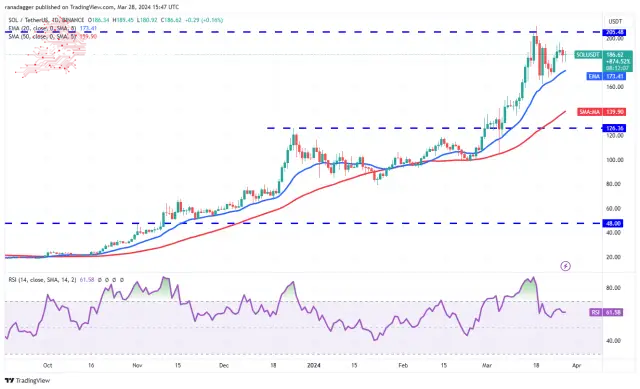
The bears will try to pull the price to the 20-day EMA ($173), which is a crucial level to watch. If the price plunges below the 20-day EMA, it will suggest the bears are in the driver’s seat. The SOL/USDT pair could decline to $162 and below that to the 50-day SMA ($140).
Los bajistas intentarán llevar el precio a la EMA de 20 días ($173), que es un nivel crucial a tener en cuenta. Si el precio cae por debajo de la EMA de 20 días, sugerirá que los bajistas están al mando. El par SOL/USDT podría caer a $162 y por debajo de eso a la SMA de 50 días ($140).
Instead, if the price turns up from the current level or rebounds off the 20-day EMA, it will indicate solid demand at lower levels. That will enhance the prospects of a break above $205. If that happens, the pair may start its journey to $267.
En cambio, si el precio sube desde el nivel actual o rebota en la EMA de 20 días, indicará una demanda sólida en niveles más bajos. Eso mejorará las perspectivas de una ruptura por encima de los 205 dólares. Si eso sucede, el par puede comenzar su viaje a 267 dólares.
XRP Price Analysis
XRP has been stuck between the uptrend line and $0.67 for the past few days, indicating indecision among the buyers and sellers.
Análisis de precios de XRP XRP ha estado atrapado entre la línea de tendencia alcista y $0,67 durante los últimos días, lo que indica indecisión entre compradores y vendedores.
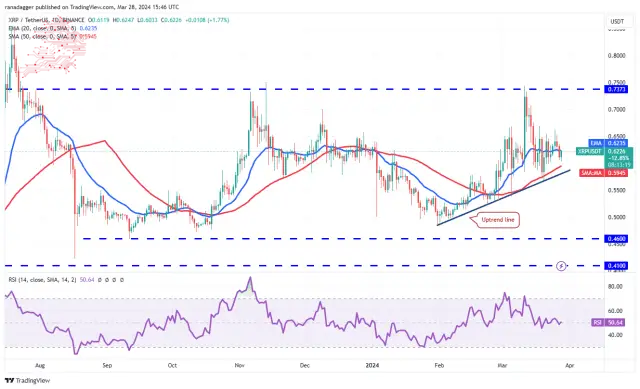
If the price maintains below the 20-day EMA ($0.62), the XRP/USDT pair could drop to the uptrend line. A strong rebound off this level will suggest that the range-bound action may continue for a few more days.
Si el precio se mantiene por debajo de la EMA de 20 días ($0,62), el par XRP/USDT podría caer a la línea de tendencia alcista. Un fuerte rebote desde este nivel sugerirá que la acción dentro del rango puede continuar durante unos días más.
The next trending move will likely begin on a break above $0.67 or drop below the uptrend line. Above $0.67, the pair could start a rally to the formidable hurdle at $0.74. On the downside, a break below the uptrend line could sink the pair to $0.52.
El próximo movimiento de tendencia probablemente comenzará con una ruptura por encima de USD 0,67 o caerá por debajo de la línea de tendencia alcista. Por encima de USD 0,67, el par podría iniciar un repunte hasta el formidable obstáculo de USD 0,74. En el lado negativo, una ruptura por debajo de la línea de tendencia alcista podría hundir el par a 0,52 dólares.
Cardano (ADA) Price Analysis
Análisis de precios de Cardano (ADA)
The long wick on Cardano’s March 26 candlestick suggests that the bears are trying to keep the price below $0.68.
La larga mecha de la vela de Cardano del 26 de marzo sugiere que los bajistas están tratando de mantener el precio por debajo de 0,68 dólares.
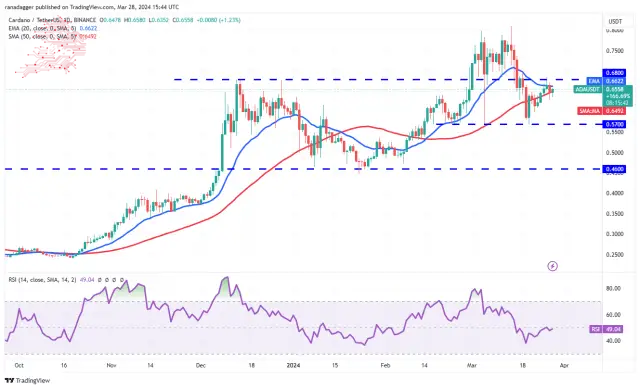
If the price remains below the moving averages, it will signal that the ADA/USDT pair could swing between $0.57 and $0.68 for a while. The flattening 20-day EMA ($0.66) and the RSI near the midpoint suggest a consolidation in the near term.
Si el precio se mantiene por debajo de los promedios móviles, indicará que el par ADA/USDT podría oscilar entre $0,57 y $0,68 por un tiempo. El aplanamiento de la EMA de 20 días ($0,66) y el RSI cerca del punto medio sugieren una consolidación en el corto plazo.
However, if the price turns up from the current level and breaks above $0.70, it will indicate that the bulls are back in the game. The pair may then attempt a rally to $0.81, where the bears may pose a substantial challenge.
Sin embargo, si el precio sube desde el nivel actual y supera los 0,70 dólares, indicará que los alcistas han vuelto al juego. Luego, el par puede intentar subir hasta USD 0,81, donde los bajistas pueden representar un desafío sustancial.
Dogecoin (DOGE) Price Analysis
Dogecoin soared above the $0.19 to $0.21 overhead resistance zone on March 28, indicating aggressive bull buying.
Análisis de precios de Dogecoin (DOGE) Dogecoin se disparó por encima de la zona de resistencia superior de $ 0,19 a $ 0,21 el 28 de marzo, lo que indica una compra alcista agresiva.
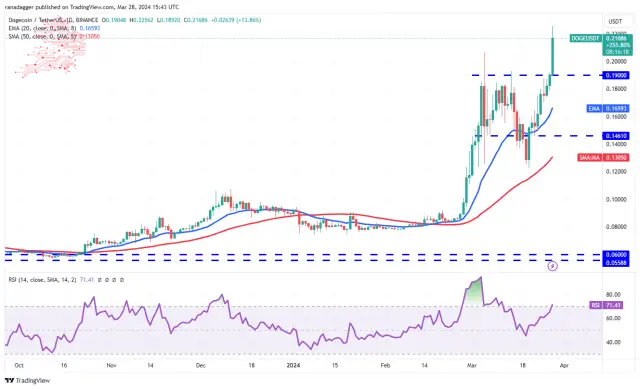
The upsloping moving averages and the RSI in the overbought zone suggest that the bulls are in command. There is a minor resistance at $0.23, but if buyers bulldoze their way through, the DOGE/USDT pair could rally to $0.30 and then to $0.35.
Los promedios móviles ascendentes y el RSI en la zona de sobrecompra sugieren que los alcistas tienen el mando. Hay una resistencia menor en 0,23$, pero si los compradores se abren paso, el par DOGE/USDT podría subir a 0,30$ y luego a 0,35$.
Bears must quickly pull the price back below $0.19 if they want to prevent the upside. If they do that, it will trap the aggressive bulls, resulting in long liquidation. The pair could then slump to the 20-day EMA ($0.16).
Los bajistas deben bajar rápidamente el precio por debajo de 0,19 dólares si quieren evitar el alza. Si lo hacen, atraparán a los alcistas agresivos, lo que resultará en una liquidación larga. Luego, el par podría caer hasta la EMA de 20 días (USD 0,16).
Avalanche (AVAX) Price Analysis
Análisis de precios de avalancha (AVAX)
The past few days’ price action of the Avalanche has formed a pennant, indicating indecision between the bulls and the bears.
La acción del precio de Avalanche en los últimos días ha formado un banderín, lo que indica indecisión entre los alcistas y los bajistas.
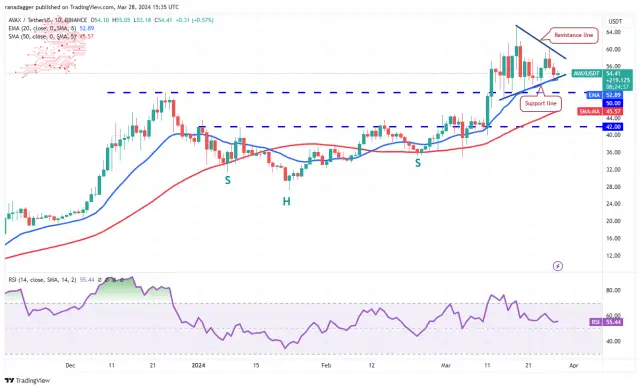
The upsloping 20-day EMA ($52) and the RSI in the positive territory indicate a slight advantage to buyers.
La EMA de 20 días ($ 52) alcista y el RSI en territorio positivo indican una ligera ventaja para los compradores.
The bulls will try to defend the pennant’s support line and push the price toward the resistance line. A break and close above the pennant will signal that the AVAX/USDT pair could resume the uptrend. The pair may rise to $65 and later to the pattern target of $76.
Los alcistas intentarán defender la línea de soporte del banderín y empujar el precio hacia la línea de resistencia. Una ruptura y un cierre por encima del banderín indicarán que el par AVAX/USDT podría reanudar la tendencia alcista. El par puede subir a $65 y luego al objetivo del patrón de $76.
Alternatively, if the price breaks below the pennant, it will suggest that the bears have overpowered the bulls. Strong support is at $50, but if this level gives way, the pair could tumble to the 50-day SMA ($45).
Alternativamente, si el precio cae por debajo del banderín, sugerirá que los bajistas han dominado a los alcistas. El fuerte soporte está en $50, pero si este nivel cede, el par podría caer a la SMA de 50 días ($45).
Shiba Inu (SHIB) Price Analysis
Shiba Inu’s recovery climbed above the resistance line on March 26, indicating that the selling pressure is reducing.
Análisis de precios de Shiba Inu (SHIB) La recuperación de Shiba Inu superó la línea de resistencia el 26 de marzo, lo que indica que la presión de venta se está reduciendo.
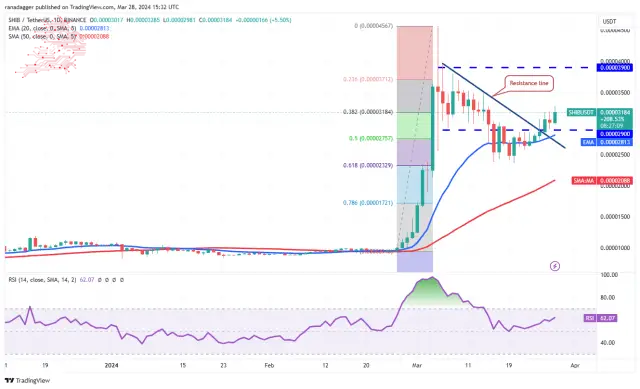
The SHIB/USDT pair will likely rise to $0.000035, where the bears are again expected to mount a strong defence. A break above this level could open the doors for a rise to $0.000039.
Es probable que el par SHIB/USDT suba a USD 0,000035, donde se espera que los bajistas vuelvan a montar una fuerte defensa. Una ruptura por encima de este nivel podría abrir las puertas a un aumento a USD 0,000039.
This optimistic view will be invalidated soon if the price turns down and breaks below the 20-day EMA ($0.000028). If that happens, it will suggest that the break above the resistance line may have been a bull trap. The pair may drop to the 50-day SMA ($0.000021).
Esta visión optimista pronto quedará invalidada si el precio baja y cae por debajo de la EMA de 20 días ($0,000028). Si eso sucede, sugerirá que la ruptura por encima de la línea de resistencia puede haber sido una trampa alcista. El par puede caer hasta la SMA de 50 días ($0,000021).
Toncoin (TON) Price Analysis
Toncoin (TON) is correcting in an uptrend, but the pullback is finding support at the 38.2% Fibonacci retracement level of $4.78, signalling to buy on dips.
Análisis de precios de Toncoin (TON) Toncoin (TON) se está corrigiendo en una tendencia alcista, pero el retroceso está encontrando soporte en el nivel de retroceso de Fibonacci del 38,2% de $ 4,78, lo que indica comprar en las caídas.
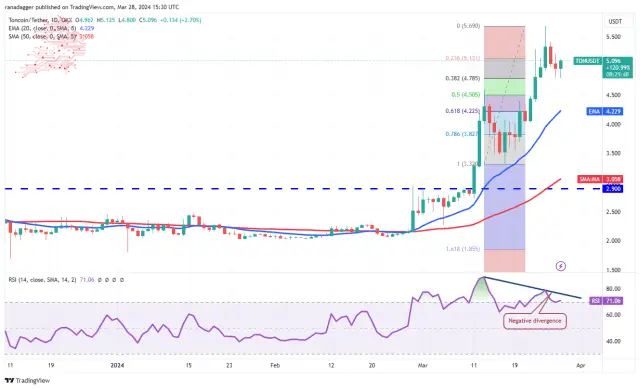
The upsloping moving averages suggest an advantage to the bulls, but the developing negative divergence on the RSI points to a possible consolidation or correction in the short term. If the price turns down and slips below $4.78, it will indicate selling on rallies. The TON/USDT pair could sink to the 20-day EMA ($4.22).
Los promedios móviles ascendentes sugieren una ventaja para los alcistas, pero la divergencia negativa en desarrollo en el RSI apunta a una posible consolidación o corrección en el corto plazo. Si el precio baja y cae por debajo de 4,78 dólares, indicará venta en los repuntes. El par TON/USDT podría hundirse hasta la EMA de 20 días ($4,22).
Contrarily, if the rebound sustains, the rally could reach the stiff overhead resistance of $5.69. A break above this level will signal the start of the next leg of the uptrend toward $7.15.
Por el contrario, si el rebote se mantiene, el repunte podría alcanzar la rígida resistencia superior de 5,69 dólares. Una ruptura por encima de este nivel señalará el inicio del siguiente tramo de la tendencia alcista hacia 7,15 dólares.
Source – Rakesh Upadhyay
Fuente - Rakesh Upadhyay
Source: https://thebittimes.com/latest-market-overview-28th-mar-btc-eth-bnb-sol-xrp-ada-doge-avax-shib-ton-tbt86096.html
Fuente: https://thebittimes.com/latest-market-overview-28th-mar-btc-eth-bnb-sol-xrp-ada-doge-avax-shib-ton-tbt86096.html
 DogeHome
 CryptoPotato_News
 Optimisus
 TheCoinrise
 DogeHome
 CoinsProbe
 Coin_Gabbar


