


The Bitcoin Market is showing positive signs, though it may encounter significant resistance if it surpasses $72,000.
비트코인 시장은 긍정적인 신호를 보이고 있지만 72,000달러를 넘으면 상당한 저항에 직면할 수 있습니다.
Despite a recent dip, interest in Bitcoin spot exchange-traded funds (ETFs) remains strong. After a week marked by consecutive net outflows, the tide turned with significant net inflows recorded on March 26th and 27th, totalling $418 million and $243 million, respectively, as reported by Farside Investors.
최근 하락세에도 불구하고 비트코인 현물 상장지수펀드(ETF)에 대한 관심은 여전히 강합니다. 연속 순유출이 있었던 일주일 후, Farside Investors의 보고에 따르면 3월 26일과 27일에 각각 총 4억 1,800만 달러와 2억 4,300만 달러를 기록한 상당한 순유입으로 흐름이 바뀌었습니다.
In an interview with Fox Business, BlackRock CEO Larry Fink has expressed optimism about the firm’s Bitcoin spot ETF. He remarked on the ETF’s rapid growth, noting it as the quickest to expand in the ETF industry’s history. Fink also conveyed his strong confidence in Bitcoin’s prospects.
Fox Business와의 인터뷰에서 BlackRock의 CEO인 Larry Fink는 회사의 비트코인 현물 ETF에 대해 낙관적인 견해를 표명했습니다. 그는 ETF의 급속한 성장에 대해 언급하며 ETF 업계 역사상 가장 빠른 확장세를 보였다고 언급했습니다. Fink는 또한 비트코인의 전망에 대한 강한 자신감을 전달했습니다.
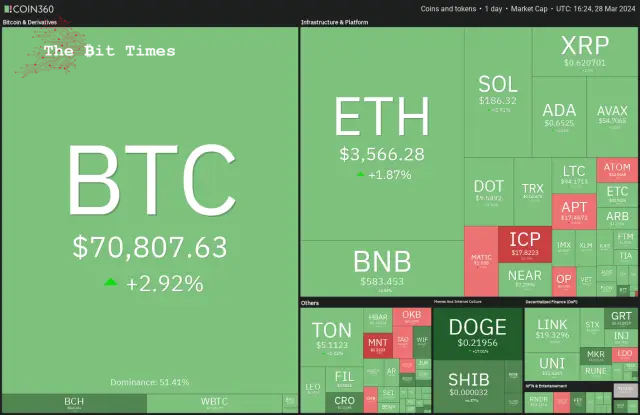
On-chain analytics platform CryptoQuant said in its latest “Weekly Crypto Report” that Bitcoin’s demand skyrocketed from “40K Bitcoin at the start of 2024 to 213K Bitcoin” on March 26. That could create a “sell-side liquidity crisis” within the following year.
온체인 분석 플랫폼인 CryptoQuant는 최근 '주간 암호화 보고서'에서 비트코인 수요가 '2024년 초 40,000비트코인에서 3월 26일 213,000비트코인'으로 급증했다고 밝혔습니다. 이로 인해 다음과 같은 기간 내에 '판매측 유동성 위기'가 발생할 수 있습니다. 년도.
Could Bitcoin continue its recovery and hit a new all-time high before the Bitcoin halving? Will that trigger buying in altcoins? Let’s analyze the charts of the top 10 cryptocurrencies to find out.
비트코인이 반감기 전에 계속 회복되어 사상 최고치를 경신할 수 있을까요? 이것이 알트코인 구매를 촉발할까요? 알아보기 위해 상위 10개 암호화폐 차트를 분석해 보겠습니다.
Bitcoin (BTC) Market Analysis
비트코인(BTC) 시장 분석
The Bitcoin market witnessed profit booking on March 26 and 27, but a positive sign is that the bulls maintained the price above the pennant.
비트코인 시장은 3월 26일과 27일에 차익을 기록했지만 상승세가 페넌트 이상의 가격을 유지했다는 점은 긍정적인 신호입니다.
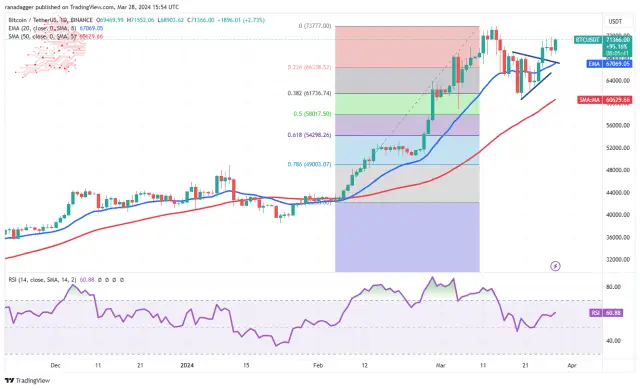
The 20-day exponential moving average (EMA) ($67,069) has started to rise, and the relative strength index (RSI) is in positive territory, suggesting that the path of least resistance is to the upside.
20일 지수이동평균(EMA)(67,069달러)이 상승하기 시작했고, 상대강도지수(RSI)가 플러스 영역에 있어 저항이 가장 적은 경로가 상승세임을 시사합니다.
If buyers drive the price above $73,777, the BTC/USDT pair will likely increase momentum and rally to $80,000.
구매자가 가격을 $73,777 이상으로 끌어올리면 BTC/USDT 쌍은 추진력을 높이고 $80,000까지 상승할 가능성이 높습니다.
On the contrary, if the price declines from its current level and breaks below the 20-day EMA, it could lead to a potential drop to the 50-day simple moving average ($60,629).
반대로 가격이 현재 수준에서 하락하여 20일 EMA 아래로 떨어지면 50일 단순 이동 평균($60,629)까지 하락할 가능성이 있습니다.
Ether (ETH) Market Analysis
이더(ETH) 시장 분석
The Ether Market is facing selling near $3,678, but a positive sign is that the bulls are trying to defend the 20-day EMA ($3,530).
이더리움 시장은 $3,678 근처의 매도세를 보이고 있지만 상승세가 20일 EMA($3,530)를 방어하려고 한다는 점은 긍정적인 신호입니다.
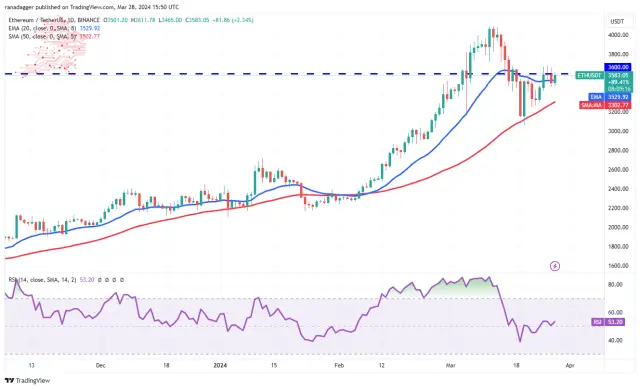
If the price breaks above $3,678, the possibility of a rally to $4,100 increases. This level may act as a stiff hurdle, but if the buyers prevail, the ETH/USDT pair could rally to $4,500 and then to $4,868.
가격이 3,678달러를 넘어서면 4,100달러까지 상승할 가능성이 높아집니다. 이 수준은 엄격한 장애물로 작용할 수 있지만, 구매자가 승리할 경우 ETH/USDT 쌍은 $4,500, $4,868까지 상승할 수 있습니다.
Conversely, if the price turns sharply and breaks below $3,460, it will suggest that the bears are unwilling to give up. The pair may then slip to the 50-day SMA ($3,302). A slide below this support could start a deeper correction.
반대로, 가격이 급격하게 변하여 $3,460 아래로 떨어지면 하락세가 포기할 의지가 없음을 의미합니다. 그러면 해당 쌍은 50일 SMA($3,302)로 넘어갈 수 있습니다. 이 지지대 아래로 슬라이드하면 더 깊은 수정이 시작될 수 있습니다.
BNB Market Analysis
BNB 시장 분석
The long wick on BNB’s March 25 and 26 candlesticks shows that the bears are defending the 61.8% Fibonacci retracement level of $588.
BNB의 3월 25일과 26일 캔들스틱의 긴 심지는 하락세가 61.8% 피보나치 되돌림 수준인 $588를 방어하고 있음을 보여줍니다.
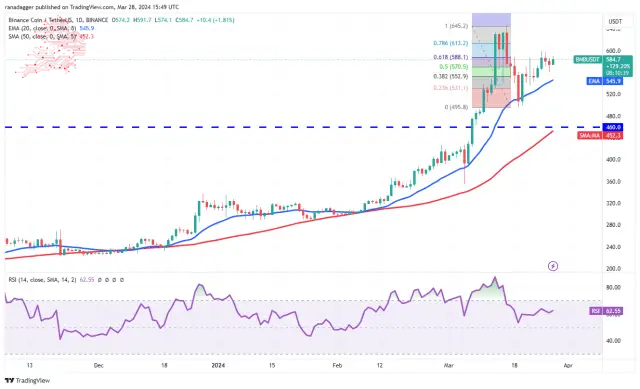
If the price turns down from the current level, the BNB/USDT pair could reach the 20-day EMA ($546). This remains the critical level to watch. If the price rebounds off the 20-day EMA, the pair will again attempt to rise above $600 and reach $645.
가격이 현재 수준에서 하락하면 BNB/USDT 쌍은 20일 EMA($546)에 도달할 수 있습니다. 이는 여전히 지켜봐야 할 중요한 수준입니다. 가격이 20일 EMA에서 반등하면 쌍은 다시 $600 이상으로 상승하여 $645에 도달하려고 시도합니다.
On the other hand, if the price drops below the 20-day EMA, it will signal that the bears are trying to gain the upper hand. The pair could then drop to the critical support at $495. The bulls may aggressively buy the dips to this level.
반면에 가격이 20일 EMA 아래로 떨어지면 하락세가 우위를 점하려고 한다는 신호입니다. 그러면 그 쌍은 $495의 중요한 지지선으로 떨어질 수 있습니다. 강세론자들은 이 수준까지의 하락세를 공격적으로 매수할 수 있습니다.
Solana (SOL) Price Analysis
솔라나(SOL) 가격 분석
Solana’s recovery is faltering at $196, indicating that the bears sell on relief rallies near the overhead resistance of $205.
솔라나의 회복세는 196달러로 흔들리고 있습니다. 이는 하락세가 머리 위 저항선인 205달러 근처에서 구호 집회에 매도하고 있음을 나타냅니다.
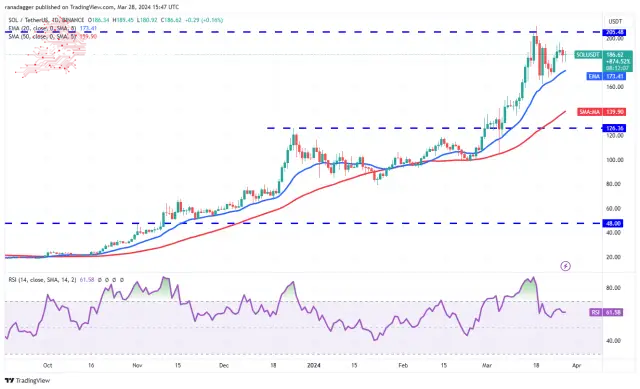
The bears will try to pull the price to the 20-day EMA ($173), which is a crucial level to watch. If the price plunges below the 20-day EMA, it will suggest the bears are in the driver’s seat. The SOL/USDT pair could decline to $162 and below that to the 50-day SMA ($140).
하락세는 지켜봐야 할 중요한 수준인 20일 EMA($173)까지 가격을 끌어내리려고 노력할 것입니다. 가격이 20일 EMA 아래로 떨어지면 하락세가 주도권을 쥐게 될 것입니다. SOL/USDT 쌍은 $162까지 하락할 수 있으며 그 아래에서는 50일 SMA($140)까지 하락할 수 있습니다.
Instead, if the price turns up from the current level or rebounds off the 20-day EMA, it will indicate solid demand at lower levels. That will enhance the prospects of a break above $205. If that happens, the pair may start its journey to $267.
대신, 가격이 현재 수준에서 상승하거나 20일 EMA에서 반등한다면 이는 더 낮은 수준에서 탄탄한 수요를 나타낼 것입니다. 이는 $205 이상의 휴식 전망을 향상시킬 것입니다. 그런 일이 발생하면 쌍은 $267까지 여행을 시작할 수 있습니다.
XRP Price Analysis
XRP has been stuck between the uptrend line and $0.67 for the past few days, indicating indecision among the buyers and sellers.
XRP 가격 분석 XRP는 지난 며칠 동안 상승 추세선과 0.67달러 사이에 머물면서 구매자와 판매자 사이의 우유부단함을 나타냅니다.
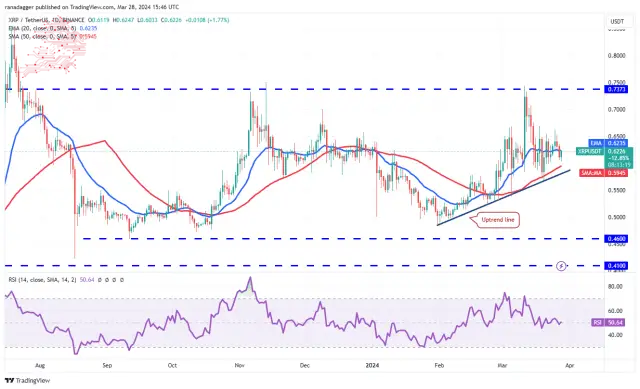
If the price maintains below the 20-day EMA ($0.62), the XRP/USDT pair could drop to the uptrend line. A strong rebound off this level will suggest that the range-bound action may continue for a few more days.
가격이 20일 EMA($0.62) 미만으로 유지되면 XRP/USDT 쌍이 상승 추세선으로 떨어질 수 있습니다. 이 수준에서 강한 반등은 범위 제한 조치가 며칠 더 지속될 수 있음을 시사합니다.
The next trending move will likely begin on a break above $0.67 or drop below the uptrend line. Above $0.67, the pair could start a rally to the formidable hurdle at $0.74. On the downside, a break below the uptrend line could sink the pair to $0.52.
다음 추세 움직임은 $0.67 이상의 브레이크에서 시작되거나 상승 추세선 아래로 떨어질 가능성이 높습니다. $0.67 이상이면 $0.74에서 엄청난 장애물까지 반등을 시작할 수 있습니다. 단점이라면 상승 추세선 아래로 돌파할 경우 가격이 $0.52까지 하락할 수 있다는 것입니다.
Cardano (ADA) Price Analysis
카르다노(ADA) 가격 분석
The long wick on Cardano’s March 26 candlestick suggests that the bears are trying to keep the price below $0.68.
Cardano의 3월 26일 캔들스틱에 있는 긴 심지는 하락세가 가격을 $0.68 미만으로 유지하려고 노력하고 있음을 나타냅니다.
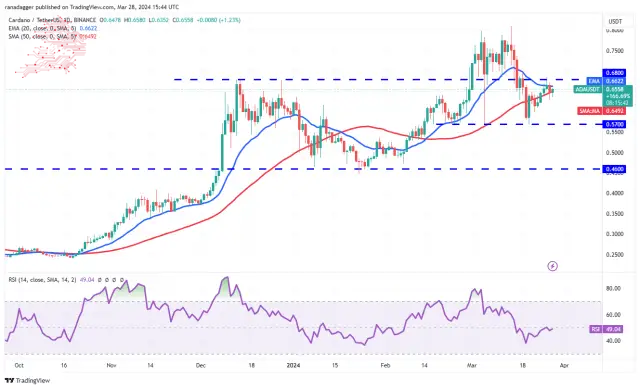
If the price remains below the moving averages, it will signal that the ADA/USDT pair could swing between $0.57 and $0.68 for a while. The flattening 20-day EMA ($0.66) and the RSI near the midpoint suggest a consolidation in the near term.
가격이 이동 평균 아래로 유지된다면 ADA/USDT 쌍이 한동안 0.57달러에서 0.68달러 사이에서 변동할 수 있다는 신호가 됩니다. 평탄한 20일 EMA($0.66)와 중간 지점 근처의 RSI는 단기적으로 통합을 시사합니다.
However, if the price turns up from the current level and breaks above $0.70, it will indicate that the bulls are back in the game. The pair may then attempt a rally to $0.81, where the bears may pose a substantial challenge.
그러나 가격이 현재 수준에서 상승하여 0.70달러를 넘어선다면 강세장이 다시 게임에 복귀했음을 나타냅니다. 그런 다음 쌍은 $0.81까지 상승을 시도할 수 있으며, 여기서 하락세는 상당한 도전이 될 수 있습니다.
Dogecoin (DOGE) Price Analysis
Dogecoin soared above the $0.19 to $0.21 overhead resistance zone on March 28, indicating aggressive bull buying.
Dogecoin(DOGE) 가격 분석 Dogecoin은 3월 28일 $0.19~$0.21의 오버헤드 저항선 위로 급등하여 공격적인 강세 매수를 나타냈습니다.
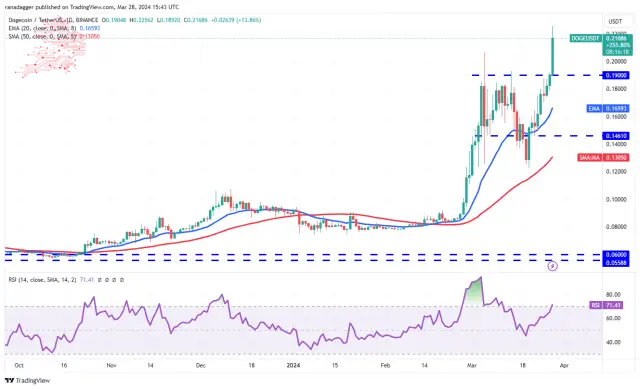
The upsloping moving averages and the RSI in the overbought zone suggest that the bulls are in command. There is a minor resistance at $0.23, but if buyers bulldoze their way through, the DOGE/USDT pair could rally to $0.30 and then to $0.35.
상승하는 이동평균선과 과매수 구간의 RSI는 상승세가 지배적임을 나타냅니다. $0.23에 약간의 저항이 있지만 구매자가 강세를 보이면 DOGE/USDT 쌍은 $0.30, $0.35까지 상승할 수 있습니다.
Bears must quickly pull the price back below $0.19 if they want to prevent the upside. If they do that, it will trap the aggressive bulls, resulting in long liquidation. The pair could then slump to the 20-day EMA ($0.16).
상승세를 막고 싶다면 하락세는 신속하게 가격을 0.19달러 아래로 끌어내려야 합니다. 그렇게 하면 공격적인 강세를 가두어 장기간 청산을 초래하게 됩니다. 그러면 통화쌍은 20일 EMA($0.16)까지 하락할 수 있습니다.
Avalanche (AVAX) Price Analysis
눈사태(AVAX) 가격 분석
The past few days’ price action of the Avalanche has formed a pennant, indicating indecision between the bulls and the bears.
지난 며칠간 눈사태의 가격 움직임은 상승세와 하락세 사이의 우유부단함을 나타내는 페넌트를 형성했습니다.
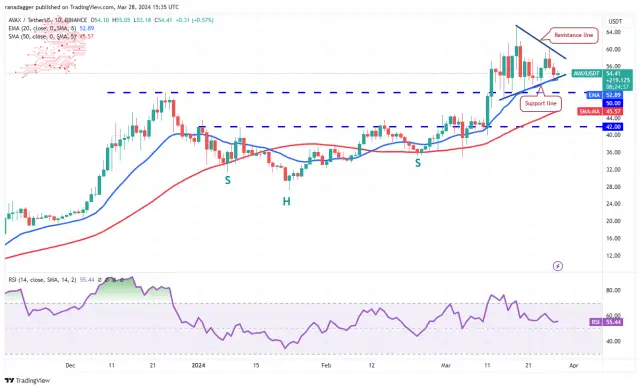
The upsloping 20-day EMA ($52) and the RSI in the positive territory indicate a slight advantage to buyers.
상승하는 20일 EMA($52)와 플러스 영역의 RSI는 구매자에게 약간의 이점을 나타냅니다.
The bulls will try to defend the pennant’s support line and push the price toward the resistance line. A break and close above the pennant will signal that the AVAX/USDT pair could resume the uptrend. The pair may rise to $65 and later to the pattern target of $76.
황소는 페넌트의 지지선을 방어하고 가격을 저항선 쪽으로 밀어 넣으려고 할 것입니다. 페넌트 위의 돌파 및 종가는 AVAX/USDT 쌍이 상승 추세를 재개할 수 있다는 신호입니다. 통화쌍은 $65까지 상승할 수 있으며 나중에 패턴 목표인 $76까지 상승할 수 있습니다.
Alternatively, if the price breaks below the pennant, it will suggest that the bears have overpowered the bulls. Strong support is at $50, but if this level gives way, the pair could tumble to the 50-day SMA ($45).
또는 가격이 페넌트 아래로 떨어지면 곰이 황소를 압도했다는 의미입니다. 강력한 지지선은 50달러이지만, 이 수준이 무너지면 통화쌍은 50일 SMA(45달러)까지 하락할 수 있습니다.
Shiba Inu (SHIB) Price Analysis
Shiba Inu’s recovery climbed above the resistance line on March 26, indicating that the selling pressure is reducing.
시바견(SHIB) 가격 분석 시바견의 회복세가 3월 26일 저항선을 넘어 상승해 매도압력이 줄어들고 있음을 나타냅니다.
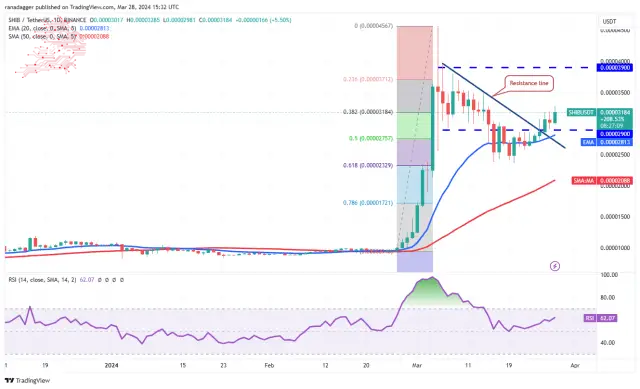
The SHIB/USDT pair will likely rise to $0.000035, where the bears are again expected to mount a strong defence. A break above this level could open the doors for a rise to $0.000039.
SHIB/USDT 쌍은 $0.000035까지 상승할 가능성이 높으며, 여기서 약세는 다시 강력한 방어력을 발휘할 것으로 예상됩니다. 이 수준을 넘어서면 $0.000039까지 상승할 수 있는 문이 열릴 수 있습니다.
This optimistic view will be invalidated soon if the price turns down and breaks below the 20-day EMA ($0.000028). If that happens, it will suggest that the break above the resistance line may have been a bull trap. The pair may drop to the 50-day SMA ($0.000021).
가격이 하락하여 20일 EMA($0.000028) 아래로 떨어지면 이러한 낙관적 전망은 곧 무효화됩니다. 만약 그런 일이 일어난다면 저항선 위의 돌파가 불트랩이었을 수도 있다는 것을 암시할 것입니다. 해당 쌍은 50일 SMA($0.000021)로 떨어질 수 있습니다.
Toncoin (TON) Price Analysis
Toncoin (TON) is correcting in an uptrend, but the pullback is finding support at the 38.2% Fibonacci retracement level of $4.78, signalling to buy on dips.
Toncoin(TON) 가격 분석 Toncoin(TON)은 상승 추세에서 조정을 받고 있지만 하락세는 38.2% 피보나치 되돌림 수준인 $4.78에서 지지를 받고 있어 하락 시 매수 신호를 보내고 있습니다.
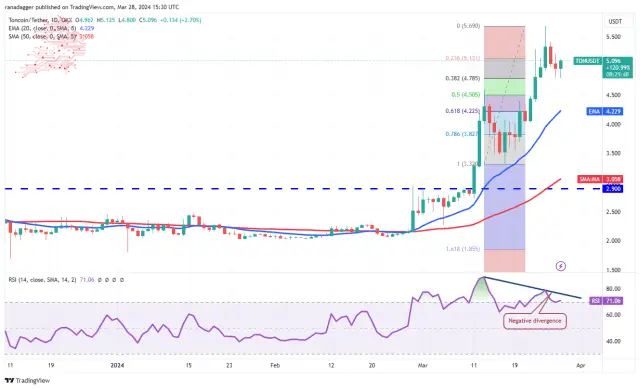
The upsloping moving averages suggest an advantage to the bulls, but the developing negative divergence on the RSI points to a possible consolidation or correction in the short term. If the price turns down and slips below $4.78, it will indicate selling on rallies. The TON/USDT pair could sink to the 20-day EMA ($4.22).
상승하는 이동평균선은 상승세에 유리하다는 점을 암시하지만, RSI의 마이너스 다이버전스 전개는 단기적으로 횡보 또는 조정 가능성을 시사합니다. 가격이 하락하여 $4.78 아래로 떨어지면 이는 랠리 매도를 의미합니다. TON/USDT 쌍은 20일 EMA($4.22)까지 하락할 수 있습니다.
Contrarily, if the rebound sustains, the rally could reach the stiff overhead resistance of $5.69. A break above this level will signal the start of the next leg of the uptrend toward $7.15.
반대로 반등이 지속된다면 랠리는 $5.69의 강력한 오버헤드 저항에 도달할 수 있습니다. 이 수준을 넘어서면 7.15달러를 향한 다음 상승 추세의 시작을 알릴 것입니다.
Source – Rakesh Upadhyay
출처 – Rakesh Upadhyay
Source: https://thebittimes.com/latest-market-overview-28th-mar-btc-eth-bnb-sol-xrp-ada-doge-avax-shib-ton-tbt86096.html
출처: https://thebittimes.com/latest-market-overview-28th-mar-btc-eth-bnb-sol-xrp-ada-doge-avax-shib-ton-tbt86096.html
 DogeHome
 CFN
CFN Times Tabloid
 Thecoinrepublic.com
 Crypto News Land
 CoinPedia News


