


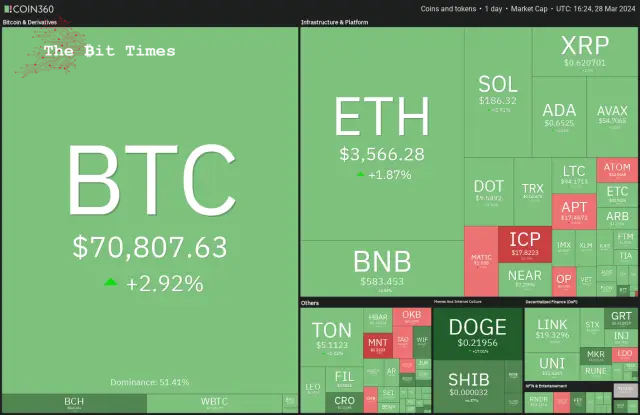
The Bitcoin Market is showing positive signs, though it may encounter significant resistance if it surpasses $72,000.
ビットコイン市場は明るい兆しを見せているが、72,000ドルを超えると大きな抵抗に遭遇する可能性がある。
Despite a recent dip, interest in Bitcoin spot exchange-traded funds (ETFs) remains strong. After a week marked by consecutive net outflows, the tide turned with significant net inflows recorded on March 26th and 27th, totalling $418 million and $243 million, respectively, as reported by Farside Investors.
最近の下落にもかかわらず、ビットコインスポット上場投資信託(ETF)への関心は依然として強い。ファーサイド・インベスターズの報告によると、連続して純流出が続いた一週間の後、3月26日と27日にそれぞれ総額4億1,800万ドルと2億4,300万ドルという大幅な純流入が記録され、流れが変わった。
In an interview with Fox Business, BlackRock CEO Larry Fink has expressed optimism about the firm’s Bitcoin spot ETF. He remarked on the ETF’s rapid growth, noting it as the quickest to expand in the ETF industry’s history. Fink also conveyed his strong confidence in Bitcoin’s prospects.
Fox Businessとのインタビューで、ブラックロックCEOのラリー・フィンク氏は同社のビットコインスポットETFについて楽観的な見方を表明した。同氏はETFの急速な成長について言及し、ETF業界史上最も急速に拡大したと指摘した。フィンク氏はまた、ビットコインの将来性に対する強い自信を伝えた。
On-chain analytics platform CryptoQuant said in its latest “Weekly Crypto Report” that Bitcoin’s demand skyrocketed from “40K Bitcoin at the start of 2024 to 213K Bitcoin” on March 26. That could create a “sell-side liquidity crisis” within the following year.
オンチェーン分析プラットフォームのCryptoQuantは、最新の「週刊暗号レポート」で、ビットコインの需要が「2024年初めの4万ビットコインから3月26日の21万3千ビットコイン」に急増したと述べた。これにより、以下の期間内に「セルサイド流動性危機」が発生する可能性がある年。
Could Bitcoin continue its recovery and hit a new all-time high before the Bitcoin halving? Will that trigger buying in altcoins? Let’s analyze the charts of the top 10 cryptocurrencies to find out.
ビットコインが回復を続け、ビットコインの半減期の前に最高値を更新する可能性はあるでしょうか?それはアルトコインの購入を引き起こすでしょうか?それを知るために、トップ 10 の仮想通貨のチャートを分析してみましょう。
Bitcoin (BTC) Market Analysis
ビットコイン(BTC)市場分析
The Bitcoin market witnessed profit booking on March 26 and 27, but a positive sign is that the bulls maintained the price above the pennant.
ビットコイン市場では3月26日と27日に利益確定が見られたが、強気派がペナントを上回る価格を維持したことは明るい兆しだ。
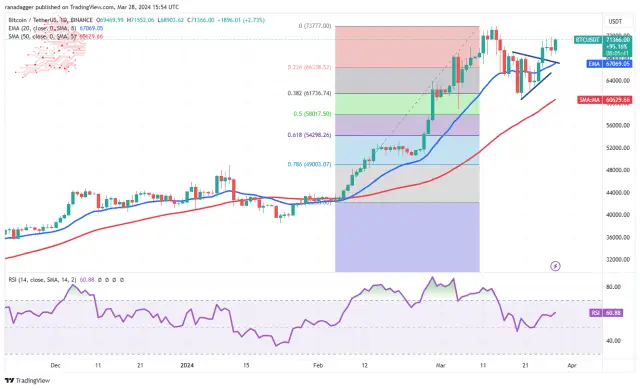
The 20-day exponential moving average (EMA) ($67,069) has started to rise, and the relative strength index (RSI) is in positive territory, suggesting that the path of least resistance is to the upside.
20 日指数移動平均 (EMA) (67,069 ドル) は上昇し始めており、相対力指数 (RSI) はプラス領域にあり、最も抵抗の少ない道は上値に向かうことを示唆しています。
If buyers drive the price above $73,777, the BTC/USDT pair will likely increase momentum and rally to $80,000.
買い手が価格を73,777ドル以上に押し上げれば、BTC/USDTペアは勢いを増し、80,000ドルまで上昇する可能性が高い。
On the contrary, if the price declines from its current level and breaks below the 20-day EMA, it could lead to a potential drop to the 50-day simple moving average ($60,629).
逆に、価格が現在のレベルから下落し、20日間のEMAを下回った場合、50日間の単純移動平均(60,629ドル)まで下落する可能性があります。
Ether (ETH) Market Analysis
イーサ(ETH)市場分析
The Ether Market is facing selling near $3,678, but a positive sign is that the bulls are trying to defend the 20-day EMA ($3,530).
イーサ市場は3,678ドル付近の売りに直面しているが、強気派が20日間EMA(3,530ドル)を守ろうとしていることは明るい兆しだ。
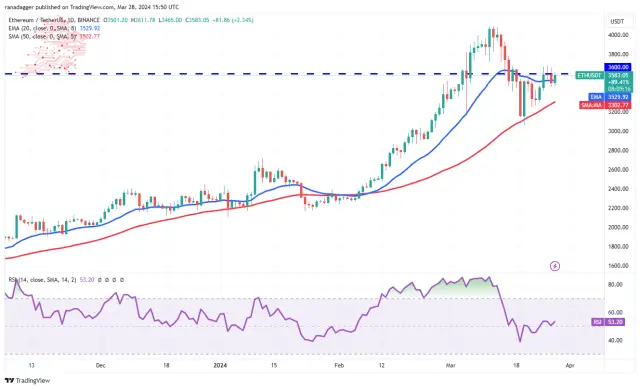
If the price breaks above $3,678, the possibility of a rally to $4,100 increases. This level may act as a stiff hurdle, but if the buyers prevail, the ETH/USDT pair could rally to $4,500 and then to $4,868.
価格が3,678ドルを突破すれば、4,100ドルまで上昇する可能性が高まる。この水準は厳しいハードルとなるかもしれないが、買い手が優勢であれば、ETH/USDTペアは4,500ドル、そして4,868ドルまで上昇する可能性がある。
Conversely, if the price turns sharply and breaks below $3,460, it will suggest that the bears are unwilling to give up. The pair may then slip to the 50-day SMA ($3,302). A slide below this support could start a deeper correction.
逆に、価格が急激に変化して3,460ドルを下回った場合は、弱気派が諦めるつもりがないことを示唆するでしょう。その後、このペアは50日SMA(3,302ドル)に下落する可能性がある。このサポートを下回るスライドは、より深い調整を開始する可能性があります。
BNB Market Analysis
BNB市場分析
The long wick on BNB’s March 25 and 26 candlesticks shows that the bears are defending the 61.8% Fibonacci retracement level of $588.
BNB の 3 月 25 日と 26 日のローソク足の長い芯は、弱気派が 61.8% のフィボナッチ リトレースメント レベルである 588 ドルを守っていることを示しています。
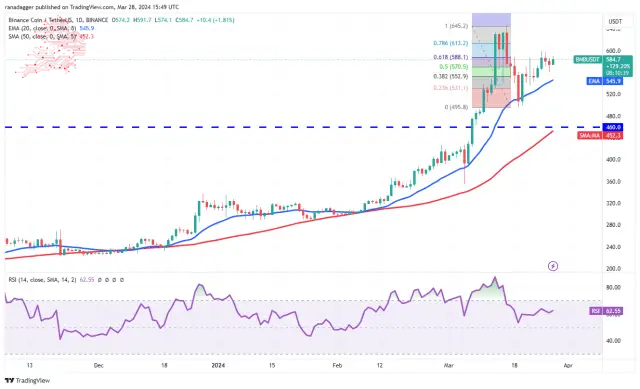
If the price turns down from the current level, the BNB/USDT pair could reach the 20-day EMA ($546). This remains the critical level to watch. If the price rebounds off the 20-day EMA, the pair will again attempt to rise above $600 and reach $645.
価格が現在のレベルから下落すれば、BNB/USDTペアは20日間EMA(546ドル)に達する可能性がある。これは引き続き監視すべき重要なレベルです。価格が20日間EMAから反発した場合、ペアは再び600ドルを超えて645ドルに達することを試みるでしょう。
On the other hand, if the price drops below the 20-day EMA, it will signal that the bears are trying to gain the upper hand. The pair could then drop to the critical support at $495. The bulls may aggressively buy the dips to this level.
一方で、価格が20日間EMAを下回った場合は、弱気派が優位に立とうとしていることを示すことになる。その後、ペアは重要なサポートである495ドルまで下落する可能性がある。強気派はこのレベルまでの押し目を積極的に買うかもしれない。
Solana (SOL) Price Analysis
ソラナ (SOL) 価格分析
Solana’s recovery is faltering at $196, indicating that the bears sell on relief rallies near the overhead resistance of $205.
ソラナ株の回復は196ドルで低迷しており、弱気派が頭上の抵抗線である205ドル付近の救済反発で売りを出していることを示している。
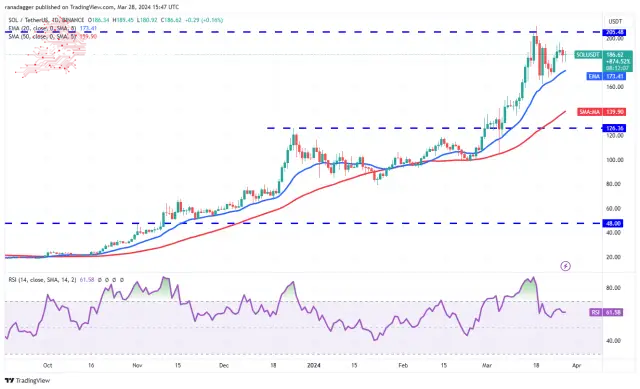
The bears will try to pull the price to the 20-day EMA ($173), which is a crucial level to watch. If the price plunges below the 20-day EMA, it will suggest the bears are in the driver’s seat. The SOL/USDT pair could decline to $162 and below that to the 50-day SMA ($140).
弱気派は価格を20日間EMA(173ドル)まで引き下げようとするが、これは注目すべき重要なレベルである。価格が20日間EMAを下回った場合、弱気派が主導権を握っていることが示唆されるだろう。 SOL/USDTペアは162ドルまで下落し、それを下回って50日SMA(140ドル)まで下落する可能性がある。
Instead, if the price turns up from the current level or rebounds off the 20-day EMA, it will indicate solid demand at lower levels. That will enhance the prospects of a break above $205. If that happens, the pair may start its journey to $267.
むしろ、価格が現在のレベルから上昇するか、20日間EMAから反発する場合、それはより低いレベルでの堅調な需要を示すことになります。これにより、205ドルを突破する可能性が高まるだろう。そうなれば、ペアは267ドルへの旅を始める可能性がある。
XRP Price Analysis
XRP has been stuck between the uptrend line and $0.67 for the past few days, indicating indecision among the buyers and sellers.
XRP価格分析 XRPはここ数日間、上昇トレンドラインと0.67ドルの間で行き詰まっており、買い手と売り手の優柔不断を示している。
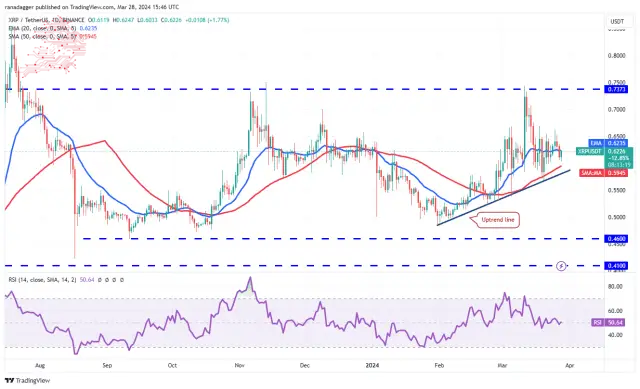
If the price maintains below the 20-day EMA ($0.62), the XRP/USDT pair could drop to the uptrend line. A strong rebound off this level will suggest that the range-bound action may continue for a few more days.
価格が20日間EMA(0.62ドル)を下回った場合、XRP/USDTペアは上昇トレンドラインまで下落する可能性がある。この水準からの強い反発は、レンジ内での動きがさらに数日間続く可能性を示唆するだろう。
The next trending move will likely begin on a break above $0.67 or drop below the uptrend line. Above $0.67, the pair could start a rally to the formidable hurdle at $0.74. On the downside, a break below the uptrend line could sink the pair to $0.52.
次のトレンドの動きは、おそらく0.67ドルを超えるか、上昇トレンドラインを下回るところで始まるでしょう。 0.67ドルを超えると、0.74ドルという恐ろしいハードルに向けて上昇を始める可能性がある。下値としては、上昇トレンドラインを下抜けた場合、ペアは0.52ドルまで下落する可能性がある。
Cardano (ADA) Price Analysis
カルダノ (ADA) 価格分析
The long wick on Cardano’s March 26 candlestick suggests that the bears are trying to keep the price below $0.68.
カルダノの3月26日のローソク足の長い芯は、弱気派が価格を0.68ドル以下に抑えようとしていることを示唆している。
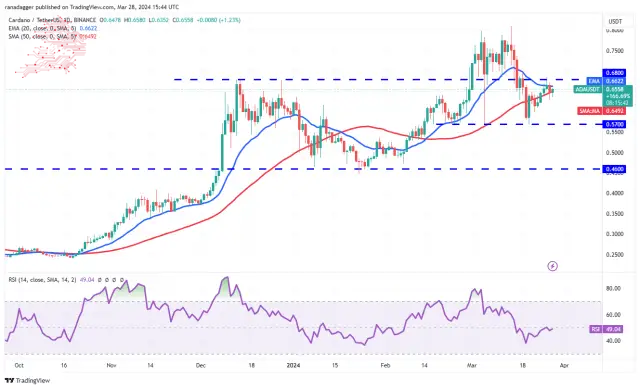
If the price remains below the moving averages, it will signal that the ADA/USDT pair could swing between $0.57 and $0.68 for a while. The flattening 20-day EMA ($0.66) and the RSI near the midpoint suggest a consolidation in the near term.
価格が移動平均を下回ったままであれば、ADA/USDTペアがしばらくの間0.57ドルから0.68ドルの間で変動する可能性があることを示唆するでしょう。横ばいの20日間EMA(0.66ドル)と中間点付近のRSIは、短期的な値固めを示唆している。
However, if the price turns up from the current level and breaks above $0.70, it will indicate that the bulls are back in the game. The pair may then attempt a rally to $0.81, where the bears may pose a substantial challenge.
しかし、価格が現在のレベルから上昇し、0.70ドルを超えた場合、強気派がゲームに戻ったことを示すことになる。その後、ペアは0.81ドルへの上昇を試みる可能性があり、弱気派が大きな課題となる可能性がある。
Dogecoin (DOGE) Price Analysis
Dogecoin soared above the $0.19 to $0.21 overhead resistance zone on March 28, indicating aggressive bull buying.
ドージコイン(DOGE)価格分析 ドージコインは3月28日に0.19ドルから0.21ドルの直上抵抗ゾーンを超えて急騰し、積極的な強気買いを示しました。
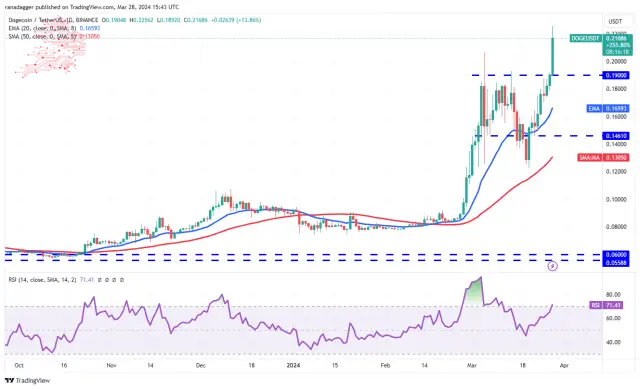
The upsloping moving averages and the RSI in the overbought zone suggest that the bulls are in command. There is a minor resistance at $0.23, but if buyers bulldoze their way through, the DOGE/USDT pair could rally to $0.30 and then to $0.35.
移動平均線の上昇と買われ過ぎゾーンのRSIは、強気派が主導権を握っていることを示唆している。 0.23ドルに若干の抵抗があるが、買い手が強気で突破すれば、DOGE/USDTペアは0.30ドル、そして0.35ドルまで上昇する可能性がある。
Bears must quickly pull the price back below $0.19 if they want to prevent the upside. If they do that, it will trap the aggressive bulls, resulting in long liquidation. The pair could then slump to the 20-day EMA ($0.16).
弱気派は上値を阻止したい場合、価格を速やかに0.19ドル以下に引き下げる必要がある。そうすれば、攻撃的な強気派を罠にはめて、清算が長期化することになる。その後、ペアは20日間EMA(0.16ドル)まで下落する可能性がある。
Avalanche (AVAX) Price Analysis
アバランチ (AVAX) 価格分析
The past few days’ price action of the Avalanche has formed a pennant, indicating indecision between the bulls and the bears.
過去数日間のアバランチの価格動向はペナントを形成しており、強気派と弱気派の間で優柔不断な姿勢が見られることを示しています。
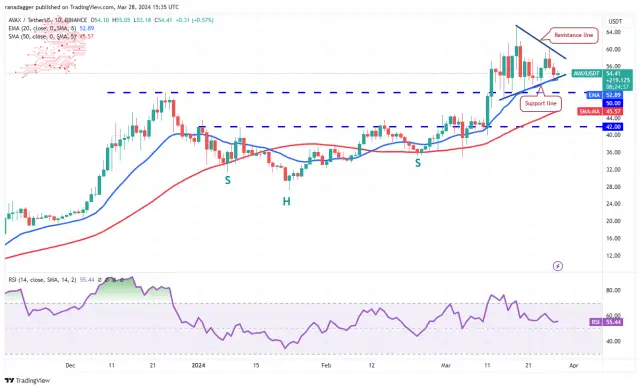
The upsloping 20-day EMA ($52) and the RSI in the positive territory indicate a slight advantage to buyers.
20 日間 EMA (52 ドル) が右肩上がりで、RSI がプラス領域にあることは、買い手が若干有利であることを示しています。
The bulls will try to defend the pennant’s support line and push the price toward the resistance line. A break and close above the pennant will signal that the AVAX/USDT pair could resume the uptrend. The pair may rise to $65 and later to the pattern target of $76.
強気派はペナントのサポートラインを守り、価格をレジスタンスラインに向けて押し上げようとします。ペナントを上抜けて引ければ、AVAX/USDTペアが上昇トレンドを再開する可能性があることを示します。ペアは65ドルまで上昇し、その後はパターン目標の76ドルまで上昇する可能性がある。
Alternatively, if the price breaks below the pennant, it will suggest that the bears have overpowered the bulls. Strong support is at $50, but if this level gives way, the pair could tumble to the 50-day SMA ($45).
あるいは、価格がペナントを下回った場合、弱気派が強気派を圧倒したことを示唆するでしょう。強力なサポートは50ドルですが、このレベルが崩れると、ペアは50日間のSMA(45ドル)まで下落する可能性があります。
Shiba Inu (SHIB) Price Analysis
Shiba Inu’s recovery climbed above the resistance line on March 26, indicating that the selling pressure is reducing.
柴犬(SHIB)の価格分析 柴犬の回復は3月26日の抵抗線を上回り、売り圧力が低下していることを示しています。
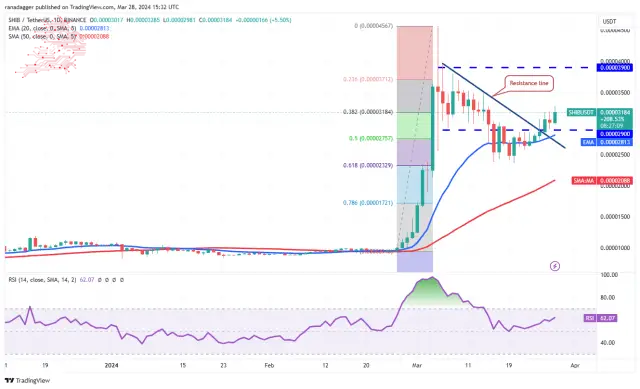
The SHIB/USDT pair will likely rise to $0.000035, where the bears are again expected to mount a strong defence. A break above this level could open the doors for a rise to $0.000039.
SHIB/USDTペアは0.000035ドルまで上昇する可能性が高く、弱気派は再び強力な防衛を開始すると予想される。このレベルを超えると、0.000039ドルへの上昇の扉が開く可能性があります。
This optimistic view will be invalidated soon if the price turns down and breaks below the 20-day EMA ($0.000028). If that happens, it will suggest that the break above the resistance line may have been a bull trap. The pair may drop to the 50-day SMA ($0.000021).
価格が下落し、20日間EMA(0.000028ドル)を下回った場合、この楽観的な見方はすぐに無効になるでしょう。そうなれば、レジスタンスラインを上抜けたのが強気の罠だった可能性があることが示唆されるだろう。このペアは50日間SMA(0.000021ドル)まで下落する可能性がある。
Toncoin (TON) Price Analysis
Toncoin (TON) is correcting in an uptrend, but the pullback is finding support at the 38.2% Fibonacci retracement level of $4.78, signalling to buy on dips.
トンコイン (TON) 価格分析 トンコイン (TON) は上昇トレンドで調整中ですが、反落は 38.2% フィボナッチ リトレースメント レベルの 4.78 ドルでサポートされており、押し目買いのシグナルとなっています。
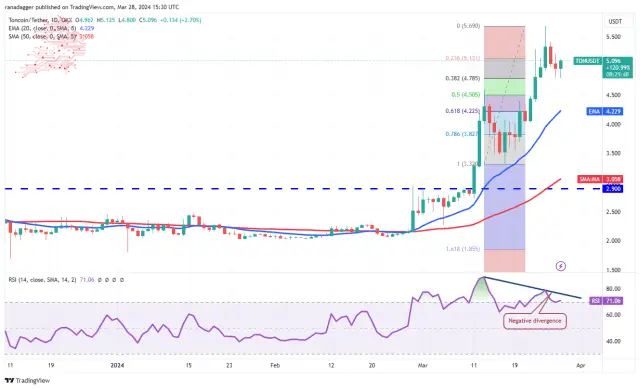
The upsloping moving averages suggest an advantage to the bulls, but the developing negative divergence on the RSI points to a possible consolidation or correction in the short term. If the price turns down and slips below $4.78, it will indicate selling on rallies. The TON/USDT pair could sink to the 20-day EMA ($4.22).
移動平均線の右肩上がりは強気派の優位性を示唆しているが、RSIのマイナスの乖離が進行していることは、短期的には値固めか調整の可能性を示している。価格が下落して4.78ドルを下回る場合は、反発で売りが出る可能性がある。 TON/USDTペアは20日間EMA(4.22ドル)まで下落する可能性がある。
Contrarily, if the rebound sustains, the rally could reach the stiff overhead resistance of $5.69. A break above this level will signal the start of the next leg of the uptrend toward $7.15.
逆に、反発が持続すれば、上昇は5.69ドルの厳しい直上抵抗線に達する可能性がある。このレベルを上抜けた場合は、7.15ドルに向けた上昇トレンドの次のレグの開始の合図となります。
Source – Rakesh Upadhyay
出典 – ラケシュ・ウパディヤイ
Source: https://thebittimes.com/latest-market-overview-28th-mar-btc-eth-bnb-sol-xrp-ada-doge-avax-shib-ton-tbt86096.html
出典: https://thebittimes.com/latest-market-overview-28th-mar-btc-eth-bnb-sol-xrp-ada-doge-avax-shib-ton-tbt86096.html
 Crypto Daily™
 TheCoinrise Media
 Crypto Daily™
 DogeHome
 ETHNews
 Crypto Daily™
 crypto.ro English
 Thecoinrepublic.com
 Crypto Daily™


