


The Bitcoin market appears poised to surpass its record peak, yet traders must recall that steep climbs often lack sustainability.
ビットコイン市場は記録的な最高値を超える準備ができているように見えるが、トレーダーは急上昇には持続性に欠けることが多いことを思い出さなければならない。
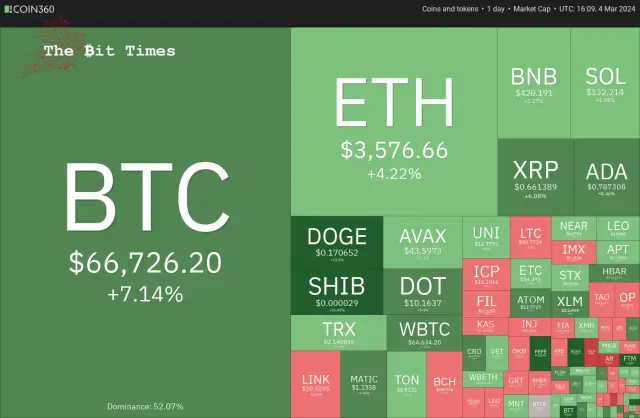
Last week, the S&P 500 Index market and the Nasdaq Composite market reached unprecedented highs, reflecting a risk-on attitude among market participants. Bitcoin is eager to join this trend, less than $2,000 away from its all-time high of $68,990 set in November 2021.
先週、市場参加者のリスクオン姿勢を反映して、S&P500指数市場とナスダック総合市場は前例のない高値に達した。ビットコインは、2021年11月に記録した史上最高値6万8990ドルまであと2000ドル未満となっており、このトレンドに加わることに熱心だ。
The momentum seems on the buyers’ side, potentially driving Bitcoin’s price to surpass its previous record in the coming days. However, the crucial question remains: Will breaching the $68,990 mark usher in a new phase of upward trend, or will it lead to a sharp downturn, trapping those who are overly optimistic?
この勢いは買い手側にもあるようで、今後数日のうちにビットコイン価格が過去最高値を超える可能性がある。しかし、重要な疑問は残っている。68,990ドルのマークを突破すると、上昇トレンドの新たな段階が始まるのか、それとも、過度に楽観的な人々を罠にはめて急激な下落につながるのか?
During a FOMO phase, strong returns are made within a short period. Even though the risk is high, the period rewards traders who can ride this phase. However, traders must be careful because sharp declines follow vertical rallies. Hence, traders should keep their stops ready lest their gains may evaporate quickly.
FOMO フェーズでは、短期間に大きなリターンが得られます。リスクは高くても、この期間はこのフェーズに乗れるトレーダーに報酬をもたらします。ただし、垂直上昇の後には急激な下落が起こるため、トレーダーは注意が必要です。したがって、トレーダーは利益がすぐに蒸発しないようにストップを準備しておく必要があります。
Could the bulls propel Bitcoin to a new all-time high and maintain it, or is it time to book profits? Let’s analyze the charts to find out.
強気派はビットコインを史上最高値に押し上げ、それを維持できるだろうか、それとも利益確定の時期が来たのだろうか?チャートを分析して調べてみましょう。
S&P 500 Index (SPX) Market Analysis
S&P 500 指数 (SPX) 市場分析
The S&P 500 Index closed at a new all-time high on March 1, indicating that the bulls firmly remain in the driver’s seat.
S&P 500指数は3月1日に最高値を更新して取引を終えたが、これは強気派が依然として主導権をしっかりと握っていることを示している。
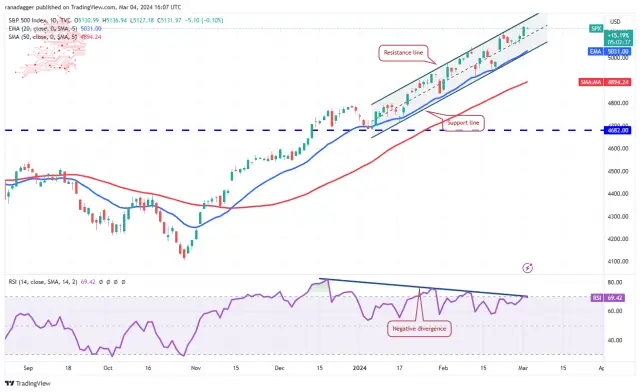
The index has been trading inside the ascending channel pattern for many days, indicating that the bears may pose a strong challenge at the resistance line. If the price turns down from the resistance line, the bears will try to pull the index to the support line. A break below the channel will start a short-term corrective phase.
同指数は何日も上昇チャネルパターン内で取引されており、弱気派がレジスタンスラインで強い挑戦となる可能性があることを示している。価格がレジスタンスラインから下落した場合、弱気派は指数をサポートラインまで引き上げようとします。チャネルを下抜けると短期的な調整局面が始まるだろう。
On the contrary, if bulls catapult the price above the channel, it will signal a pickup in momentum. That could start a vertical rally, which may take the index to 5,300 and 5,500. Traders must be cautious as the negative divergence on the relative strength index (RSI) suggests the bulls may be losing steam.
逆に、強気派がチャネルを超えて価格を一気に上昇させれば、勢いが加速する合図となります。そうなれば垂直上昇が始まり、指数は5,300、5,500まで上昇する可能性がある。相対力指数(RSI)のマイナスの乖離は強気派が勢いを失っている可能性を示唆しているため、トレーダーは注意が必要だ。
U.S. Dollar Index (DXY) Market Analysis
米ドルインデックス(DXY)市場分析
The bulls pushed the U.S. dollar Index (DXY) above the 20-day exponential moving average (104) on Feb. 29 but could not build upon it. Sellers pulled the price back below the 20-day EMA on March 1.
強気派は2月29日に米ドル指数(DXY)を20日間指数移動平均(104)を上回ったが、それをさらに上回ることはできなかった。売り手は3月1日に価格を20日間EMA以下に引き下げた。
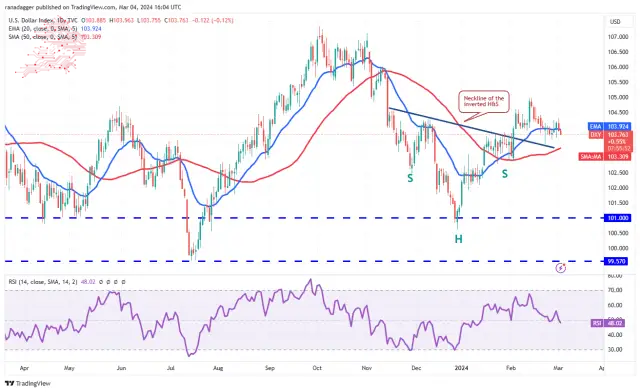
The 20-day EMA has flattened out, and the RSI is near the midpoint, indicating a possible range-bound action in the near term. If the price remains below the 20-day EMA, the index could slip to the 50-day simple moving average (103). Buyers are expected to defend this level with vigour.
20 日間 EMA は横ばいとなり、RSI は中間点付近にあり、短期的にはレンジ内での動きの可能性を示しています。価格が 20 日間 EMA を下回ったままの場合、指数は 50 日間の単純移動平均 (103) まで下落する可能性があります。買い手はこの水準を精力的に守ることが期待される。
Conversely, if the price turns up from the current level and rises above 104.30, it will indicate solid buying at lower levels. The index could then increase to 105. A break above this resistance could open the doors for a potential rise to 106.
逆に、価格が現在のレベルから上昇し、104.30を超える場合は、下値レベルでの堅調な買いが示唆されます。その後、指数は 105 まで上昇する可能性があります。このレジスタンスを上抜ければ、106 への上昇の可能性への扉が開く可能性があります。
Bitcoin (BTC) Market Analysis
ビットコイン(BTC)市場分析
Bitcoin has been in a solid uptrend for the past several days. The bears tried to halt the upmove near $64,000, but that resulted in the formation of a pennant.
ビットコインはここ数日間堅調な上昇傾向にある。弱気派は64,000ドル付近での上昇を止めようとしたが、結果的にペナントが形成された。
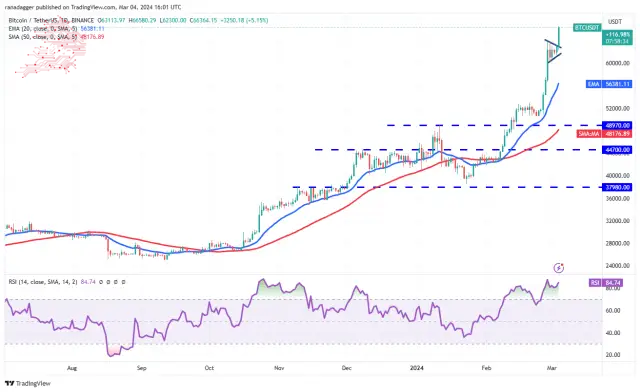
The bulls reasserted their supremacy after kicking the price above the pennant on March 4. This signals the start of the next leg of the uptrend, which could reach an all-time high at $68,990 and continue to $76,000, which is the pattern target of the breakout from the pennant.
強気派は3月4日に価格をペナントよりも上に押し上げた後、優位性を再主張した。これは上昇トレンドの次の行程の始まりを示しており、68,990ドルの史上最高値に達し、パターン目標である76,000ドルまで続く可能性がある。ペナントからの突破。
Time is running out for the bears. They must quickly drag the price below $60,000 to make a comeback. If they do that, several stops of short-term traders may hit, and the BTC/USDT pair could drop to the 20-day EMA ($56,250).
クマたちに残された時間は残りわずかです。巻き返しを図るには、価格を早急に6万ドル以下に引き下げる必要がある。そうすれば、短期トレーダーのいくつかのストップが発生する可能性があり、BTC/USDTペアは20日間EMA(56,250ドル)まで下落する可能性がある。
Ether (ETH) Price Analysis
イーサ(ETH)価格分析
イーサは2月29日に3,600ドル付近で利益確定を確認したが、弱気派は反発を開始できず、あらゆる小さな押し目は買われていることを示している。
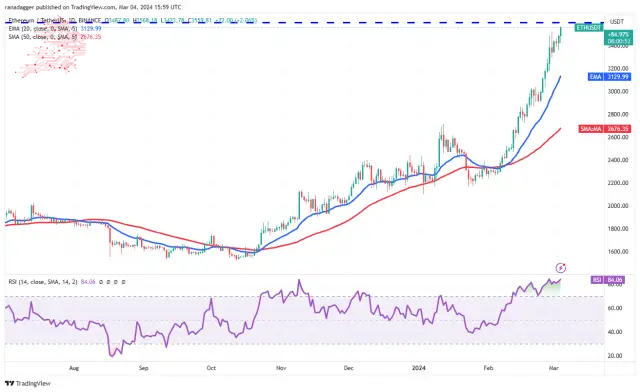
The bulls are again trying to overcome the stiff barrier at $3,600. If they manage to do that, the ETH/USDT pair could start the next leg of the uptrend and surge toward $4,000 and later to $4,150.
強気派は再び3,600ドルの厳しい壁を乗り越えようとしている。それができれば、ETH/USDTペアは上昇トレンドの次のレグを開始し、4,000ドルに向かって急上昇し、その後は4,150ドルに達する可能性があります。
The upsloping moving averages suggest that bulls are in control, but the RSI has been in the overbought zone for several days, increasing the possibility of a short-term pullback. The immediate support on the downside is at $3,300, and then the 20-day EMA ($3,129).
移動平均線の右肩上がりは強気派が主導権を握っていることを示唆しているが、RSIはここ数日間買われ過ぎゾーンにあり、短期的に反落する可能性が高まっている。下値の当面のサポートは 3,300 ドル、その後 20 日間 EMA (3,129 ドル) です。
BNB Price Analysis
BNB has been in an uptrend for several days. The bears tried to stall the rally at $427, but the bulls bought the dip on Feb. 29, indicating a positive sentiment.
BNB 価格分析 BNB は数日間上昇傾向にあります。弱気派は427ドルの上昇を失速させようとしたが、強気派は2月29日に押し目を買い、前向きなセンチメントを示した。
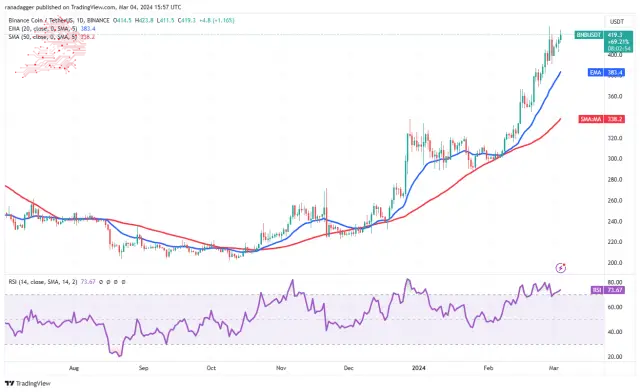
The rising moving averages and the RSI in the overbought zone suggest that the path of least resistance is to the upside. If buyers shove the price above $427, the BNB/USDT pair could reach $460. The bulls may find it challenging to break above this resistance with ease.
移動平均線の上昇と買われ過ぎゾーンのRSIは、最も抵抗が少ない道が上値に向かうことを示唆しています。買い手が価格を427ドル以上に押し上げた場合、BNB/USDTペアは460ドルに達する可能性がある。強気派はこの抵抗を簡単に突破するのが難しいと感じるかもしれません。
The critical support to watch on the downside is the 20-day EMA ($383). If this support cracks, it will indicate that the short-term traders may be rushing to the exit. That could start a corrective phase toward the 50-day SMA ($338).
下値で注目すべき重要なサポートは、20日間EMA(383ドル)です。このサポートが割れた場合、短期トレーダーが急いで出口に向かう可能性があることを示すことになる。そうなれば、50日SMA(338ドル)に向けた調整段階が始まる可能性がある。
XRP Price Analysis
XRP価格分析
XRP turned down sharply on March 3, but the long tail on the candlestick shows solid buying at lower levels.
XRPは3月3日に急激に下落しましたが、ローソク足のロングテールは、より低いレベルでの堅調な買いを示しています。
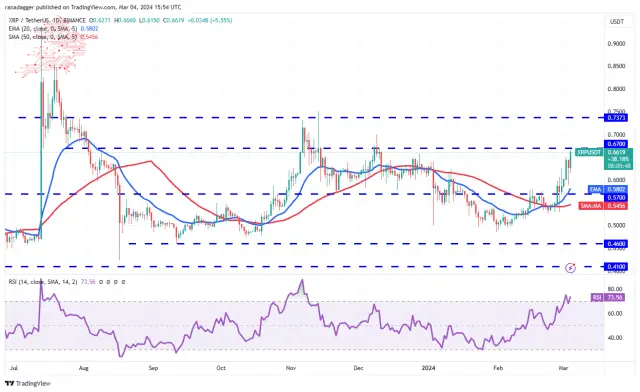
The upsloping 20-day EMA ($0.58) and the RSI in the overbought zone suggest the bulls are in command. There is a minor resistance at $0.67, but it is likely to be crossed. The rally could then reach the powerful resistance of $0.74.
20日間EMA(0.58ドル)の上昇傾向と買われ過ぎゾーンにあるRSIは、強気派が主導権を握っていることを示唆している。 0.67ドルに小さな抵抗線があるが、それを超える可能性は高い。その後、上昇は0.74ドルの強力な抵抗線に達する可能性がある。
Instead, if the price turns down sharply from $0.67, it will signal that the bears are fiercely defending the level. That could pull the price down to the 20-day EMA and keep the XRP/USDT pair inside the $0.46 to $0.67 range for a while.
むしろ、価格が0.67ドルから急激に下落した場合、弱気派がその水準を激しく守っていることを示すことになる。これにより、価格は20日間EMAまで引き下げられ、XRP/USDTペアはしばらく0.46ドルから0.67ドルの範囲内にとどまる可能性がある。
Solana (SOL) Price Analysis
ソラナ (SOL) 価格分析
Solana closed above the $126 resistance on March 1, but the bulls struggled to sustain the momentum. This suggests a lack of demand at higher levels.
ソラナは3月1日に126ドルの抵抗線を上回って取引を終えたが、強気派は勢いを維持するのに苦労した。これは、より高いレベルでの需要が不足していることを示唆しています。
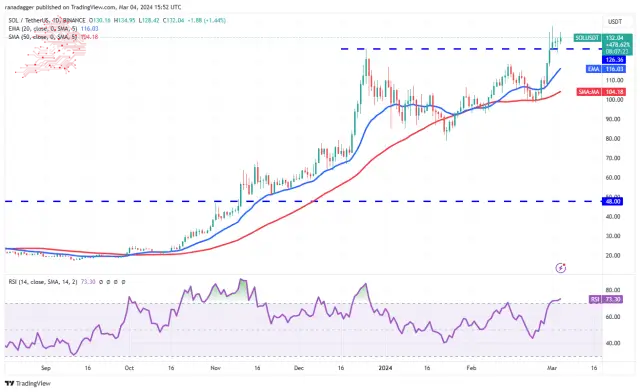
If the price maintains above $126, it will increase the likelihood of the resumption of the uptrend. If buyers pierce the $138 level, the SOL/USDT pair will likely rise to $143 and then to $158.
価格が126ドルを超えて維持されれば、上昇トレンドが再開する可能性が高まります。買い手が138ドルの水準を突破した場合、SOL/USDTペアは143ドルに上昇し、その後158ドルに上昇する可能性が高い。
Contrary to this assumption, if the $126 level gives way, the pair may slump to the 20-day EMA ($116). The bears must drag the price below the 20-day EMA to suggest that the breakout above $126 was fake. The pair may then drop to the 50-day SMA ($104).
この想定に反して、126 ドルの水準が崩れた場合、ペアは 20 日間 EMA (116 ドル) まで下落する可能性があります。弱気派は、126ドルを超えたブレイクアウトが偽りであることを示唆するには、価格を20日間EMA以下に引きずり込む必要がある。その後、ペアは50日SMA(104ドル)まで下落する可能性がある。
Cardano (ADA) Price Analysis
カルダノ (ADA) 価格分析
Cardano started the next leg of the uptrend after buyers overcame the $0.68 barrier on March 1. The bears tried to tug the price back below the breakout level on March 3, but the bulls held their ground. This shows strong buying on dips.
カルダノは、買い手が3月1日に0.68ドルの壁を乗り越えた後、上昇トレンドの次の段階を開始した。弱気派は3月3日のブレイクアウトレベル以下に価格を戻そうとしたが、強気派は踏みとどまった。これは押し目買いが強いことを示しています。
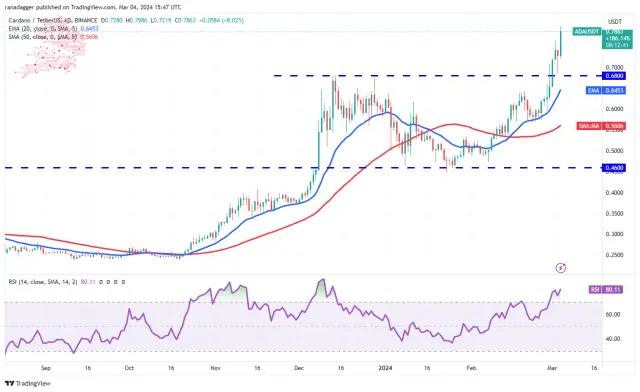
The up move will likely reach $0.90, where the bears are expected to mount a strong defence. If the momentum remains strong and buyers bulldoze through $0.90, the rally could extend to $1.25. The bulls may find it difficult to cross this level.
上昇幅は0.90ドルに達する可能性が高く、弱気派は強力な防衛を展開すると予想される。この勢いが引き続き強く、買い手が0.90ドルまで強行突破した場合、上昇は1.25ドルまで拡大する可能性がある。強気派はこの水準を越えるのが難しいかもしれない。
The RSI has risen above 80, indicating that the rally is at a risk of stalling. The 20-day EMA ($0.64) remains the essential support to watch out for on the downside. A break and close below this level will signal that the bulls are losing their grip. The ADA/USDT pair may slide to the 50-day SMA ($0.56).
RSIは80を超えており、ラリーが失速するリスクがあることを示している。 20日間EMA(0.64ドル)は依然として下値に注意すべき重要なサポートである。このレベルを下回るブレイクとクローズは、強気派がグリップ力を失いつつあることを示します。 ADA/USDTペアは50日SMA(0.56ドル)まで下落する可能性がある。
Dogecoin (DOGE) Price Analysis
At $0.19, Dogecoin has been in a strong bull run for the past few days. The bears tried to pull the price lower on March 3, but the long tail on the candlestick shows aggressive buying by the bulls.
ドージコイン (DOGE) 価格分析 ドージコインは 0.19 ドルで、過去数日間強い上昇を続けています。弱気派は3月3日に価格を引き下げようとしたが、ローソク足の長い尾は強気派の積極的な買いを示している。
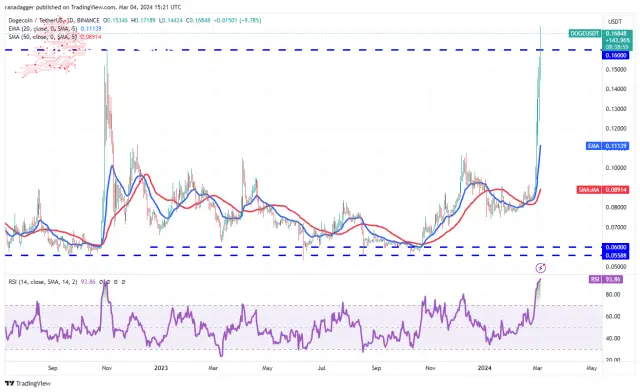
The bulls resumed the uptrend by pushing the DOGE/USDT pair above the $0.16 overhead resistance on March 4. This opens the door for a possible rise to $0.18 and, after that, to $0.22. The sharp rally has sent the RSI deep into the overbought territory, suggesting a consolidation or correction may be around the corner.
強気派は3月4日にDOGE/USDTペアを0.16ドルの直上の抵抗線を超えて押し上げることで上昇トレンドを再開した。これにより0.18ドル、その後0.22ドルへの上昇の可能性への扉が開かれた。急激な上昇によりRSIは買われ過ぎの領域に深く入り込み、保ち合いか調整が近いことを示唆している。
The first support on the downside is at $0.16 and then at $0.12. If this support is taken out, it will suggest that the uptrend may be over.
下値の最初のサポートは0.16ドルで、次に0.12ドルです。このサポートが外れた場合、上昇トレンドが終わった可能性があることが示唆されます。
Avalanche (AVAX) Price Analysis
Avalanche completed a bullish inverse head-and-shoulders pattern after the price closed above the neckline at $42 on March 1.
アバランチ(AVAX)価格分析 アバランチは、価格がネックラインを上回る42ドルで3月1日に終了した後、強気の逆ヘッドアンドショルダーパターンを完了しました。
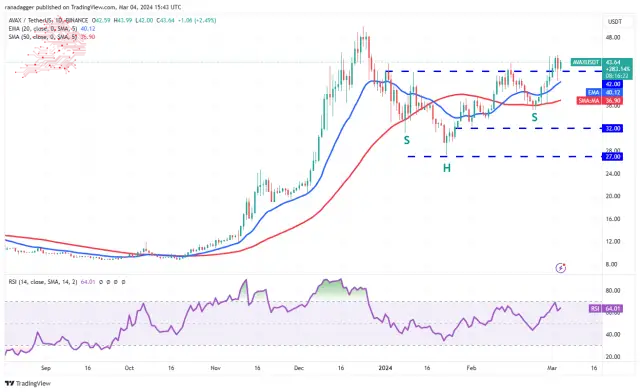
The AVAX/USDT pair is witnessing a tough battle between the bulls and the bears near the $42 level. If buyers flip the level into support and propel the price above $45, the pair could rally toward the psychological resistance at $50. If this level is overcome, the pair may reach the pattern target of $57.
AVAX/USDTペアは42ドルレベル付近で強気派と弱気派の間の厳しい戦いを目撃している。買い手がこのレベルをサポートに転換し、価格を45ドル以上に押し上げた場合、ペアは50ドルの心理的抵抗線に向けて上昇する可能性がある。このレベルを超えれば、パターン目標の57ドルに到達する可能性がある。
Sellers must pull the price below the 20-day EMA ($40) to weaken the bulls. The pair could then slump to the 50-day SMA ($37), suggesting that the breakout on March 1 may have been a bull trap.
売り手は強気派を弱めるために価格を20日間EMA(40ドル)以下に引き下げる必要がある。その後、ペアは50日間SMA(37ドル)まで下落する可能性があり、3月1日のブレイクアウトが強気の罠だった可能性があることを示唆している。
Source – Rakesh Upadhyay
出典 – ラケシュ・ウパディヤイ
Source: https://thebittimes.com/latest-market-overview-4th-march-spx-dxy-btc-eth-bnb-sol-xrp-ada-doge-avax-tbt86066.html
出典: https://thebittimes.com/latest-market-overview-4th-march-spx-dxy-btc-eth-bnb-sol-xrp-ada-doge-avax-tbt86066.html
 TheNewsCrypto
 Times Tabloid
 DogeHome
 CFN
CFN Crypto Daily™
 DogeHome
 Crypto Daily™
 TheCoinrise Media
 Crypto Daily™


