
The Bitcoin market appears poised to surpass its record peak, yet traders must recall that steep climbs often lack sustainability.
Last week, the S&P 500 Index market and the Nasdaq Composite market reached unprecedented highs, reflecting a risk-on attitude among market participants. Bitcoin is eager to join this trend, less than $2,000 away from its all-time high of $68,990 set in November 2021.
The momentum seems on the buyers’ side, potentially driving Bitcoin’s price to surpass its previous record in the coming days. However, the crucial question remains: Will breaching the $68,990 mark usher in a new phase of upward trend, or will it lead to a sharp downturn, trapping those who are overly optimistic?
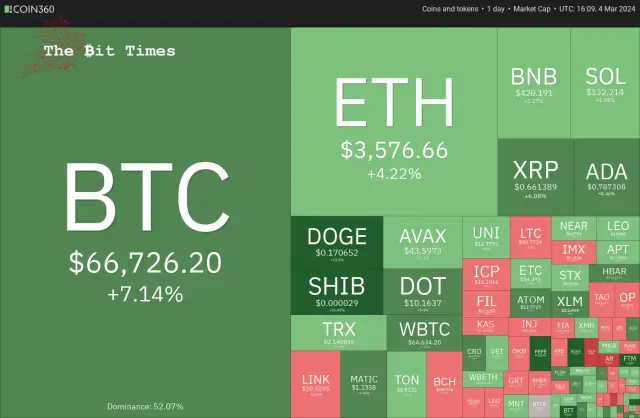
During a FOMO phase, strong returns are made within a short period. Even though the risk is high, the period rewards traders who can ride this phase. However, traders must be careful because sharp declines follow vertical rallies. Hence, traders should keep their stops ready lest their gains may evaporate quickly.
Could the bulls propel Bitcoin to a new all-time high and maintain it, or is it time to book profits? Let’s analyze the charts to find out.
S&P 500 Index (SPX) Market Analysis
The S&P 500 Index closed at a new all-time high on March 1, indicating that the bulls firmly remain in the driver’s seat.
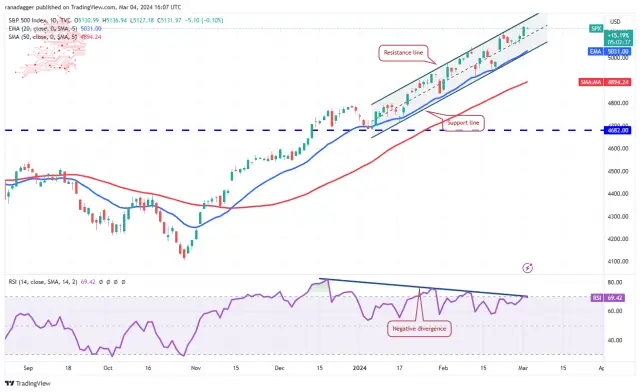
The index has been trading inside the ascending channel pattern for many days, indicating that the bears may pose a strong challenge at the resistance line. If the price turns down from the resistance line, the bears will try to pull the index to the support line. A break below the channel will start a short-term corrective phase.
On the contrary, if bulls catapult the price above the channel, it will signal a pickup in momentum. That could start a vertical rally, which may take the index to 5,300 and 5,500. Traders must be cautious as the negative divergence on the relative strength index (RSI) suggests the bulls may be losing steam.
U.S. Dollar Index (DXY) Market Analysis
The bulls pushed the U.S. dollar Index (DXY) above the 20-day exponential moving average (104) on Feb. 29 but could not build upon it. Sellers pulled the price back below the 20-day EMA on March 1.
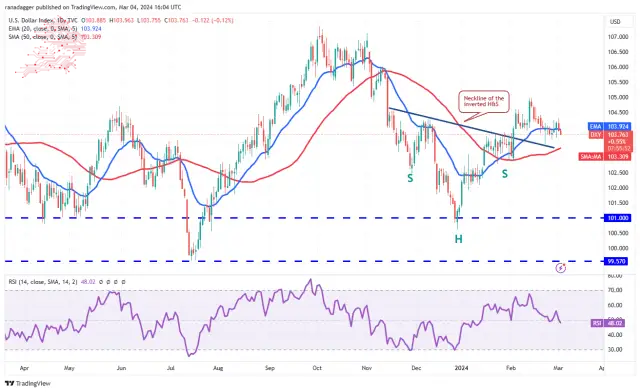
The 20-day EMA has flattened out, and the RSI is near the midpoint, indicating a possible range-bound action in the near term. If the price remains below the 20-day EMA, the index could slip to the 50-day simple moving average (103). Buyers are expected to defend this level with vigour.
Conversely, if the price turns up from the current level and rises above 104.30, it will indicate solid buying at lower levels. The index could then increase to 105. A break above this resistance could open the doors for a potential rise to 106.
Bitcoin (BTC) Market Analysis
Bitcoin has been in a solid uptrend for the past several days. The bears tried to halt the upmove near $64,000, but that resulted in the formation of a pennant.
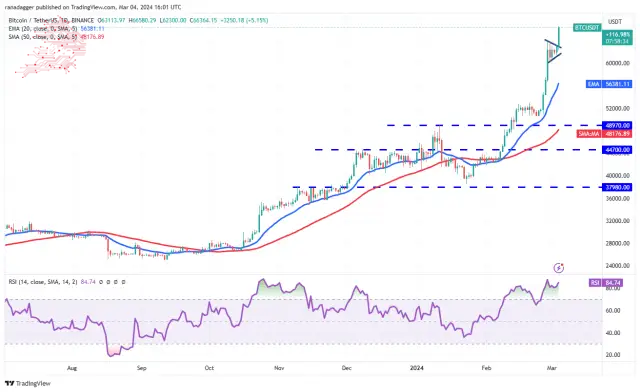
The bulls reasserted their supremacy after kicking the price above the pennant on March 4. This signals the start of the next leg of the uptrend, which could reach an all-time high at $68,990 and continue to $76,000, which is the pattern target of the breakout from the pennant.
Time is running out for the bears. They must quickly drag the price below $60,000 to make a comeback. If they do that, several stops of short-term traders may hit, and the BTC/USDT pair could drop to the 20-day EMA ($56,250).
Ether (ETH) Price Analysis
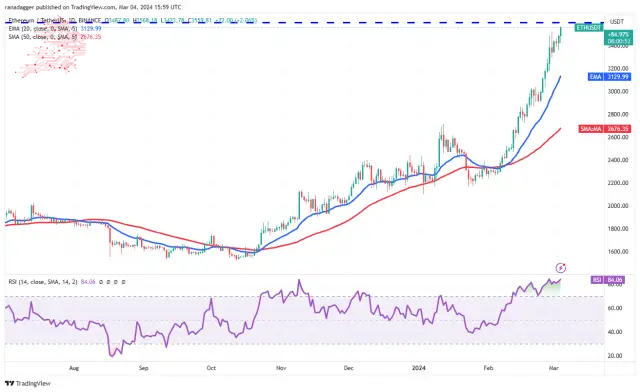
The bulls are again trying to overcome the stiff barrier at $3,600. If they manage to do that, the ETH/USDT pair could start the next leg of the uptrend and surge toward $4,000 and later to $4,150.
The upsloping moving averages suggest that bulls are in control, but the RSI has been in the overbought zone for several days, increasing the possibility of a short-term pullback. The immediate support on the downside is at $3,300, and then the 20-day EMA ($3,129).
BNB Price Analysis
BNB has been in an uptrend for several days. The bears tried to stall the rally at $427, but the bulls bought the dip on Feb. 29, indicating a positive sentiment.
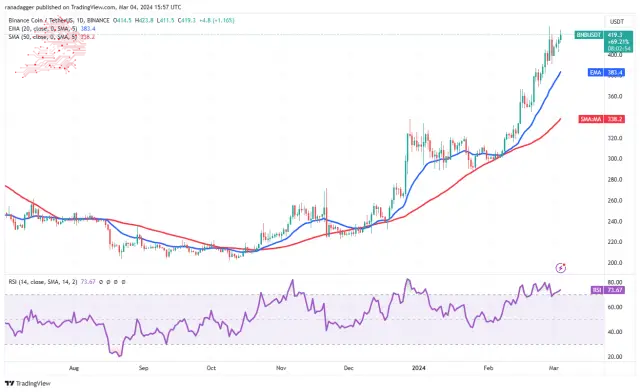
The rising moving averages and the RSI in the overbought zone suggest that the path of least resistance is to the upside. If buyers shove the price above $427, the BNB/USDT pair could reach $460. The bulls may find it challenging to break above this resistance with ease.
The critical support to watch on the downside is the 20-day EMA ($383). If this support cracks, it will indicate that the short-term traders may be rushing to the exit. That could start a corrective phase toward the 50-day SMA ($338).
XRP Price Analysis
XRP turned down sharply on March 3, but the long tail on the candlestick shows solid buying at lower levels.
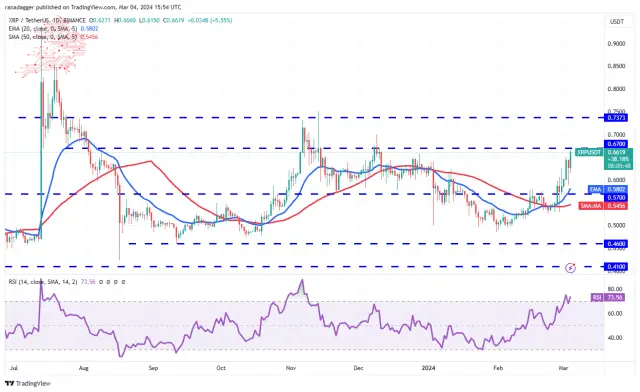
The upsloping 20-day EMA ($0.58) and the RSI in the overbought zone suggest the bulls are in command. There is a minor resistance at $0.67, but it is likely to be crossed. The rally could then reach the powerful resistance of $0.74.
Instead, if the price turns down sharply from $0.67, it will signal that the bears are fiercely defending the level. That could pull the price down to the 20-day EMA and keep the XRP/USDT pair inside the $0.46 to $0.67 range for a while.
Solana (SOL) Price Analysis
Solana closed above the $126 resistance on March 1, but the bulls struggled to sustain the momentum. This suggests a lack of demand at higher levels.
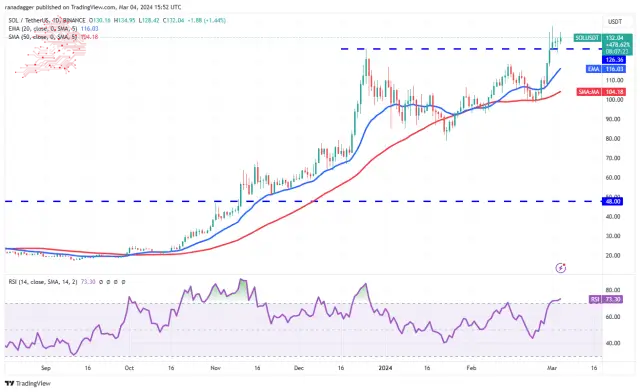
If the price maintains above $126, it will increase the likelihood of the resumption of the uptrend. If buyers pierce the $138 level, the SOL/USDT pair will likely rise to $143 and then to $158.
Contrary to this assumption, if the $126 level gives way, the pair may slump to the 20-day EMA ($116). The bears must drag the price below the 20-day EMA to suggest that the breakout above $126 was fake. The pair may then drop to the 50-day SMA ($104).
Cardano (ADA) Price Analysis
Cardano started the next leg of the uptrend after buyers overcame the $0.68 barrier on March 1. The bears tried to tug the price back below the breakout level on March 3, but the bulls held their ground. This shows strong buying on dips.
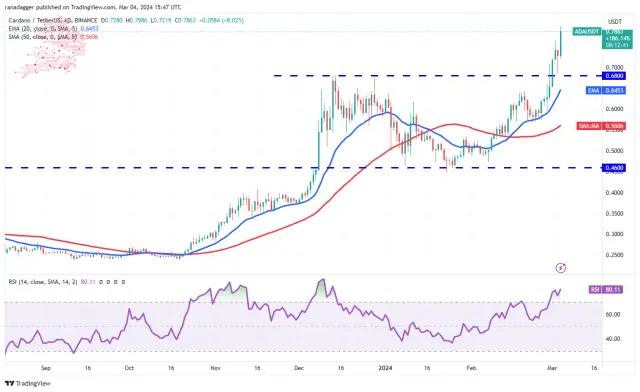
The up move will likely reach $0.90, where the bears are expected to mount a strong defence. If the momentum remains strong and buyers bulldoze through $0.90, the rally could extend to $1.25. The bulls may find it difficult to cross this level.
The RSI has risen above 80, indicating that the rally is at a risk of stalling. The 20-day EMA ($0.64) remains the essential support to watch out for on the downside. A break and close below this level will signal that the bulls are losing their grip. The ADA/USDT pair may slide to the 50-day SMA ($0.56).
Dogecoin (DOGE) Price Analysis
At $0.19, Dogecoin has been in a strong bull run for the past few days. The bears tried to pull the price lower on March 3, but the long tail on the candlestick shows aggressive buying by the bulls.
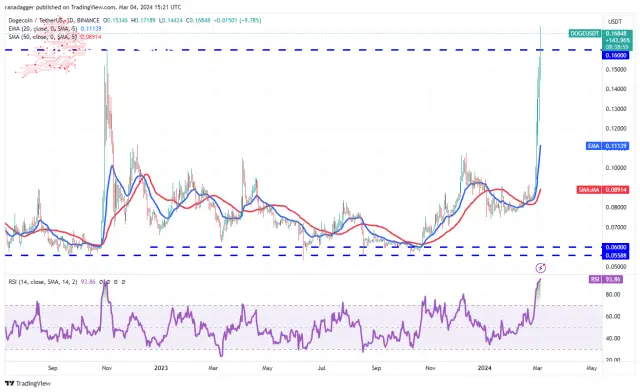
The bulls resumed the uptrend by pushing the DOGE/USDT pair above the $0.16 overhead resistance on March 4. This opens the door for a possible rise to $0.18 and, after that, to $0.22. The sharp rally has sent the RSI deep into the overbought territory, suggesting a consolidation or correction may be around the corner.
The first support on the downside is at $0.16 and then at $0.12. If this support is taken out, it will suggest that the uptrend may be over.
Avalanche (AVAX) Price Analysis
Avalanche completed a bullish inverse head-and-shoulders pattern after the price closed above the neckline at $42 on March 1.
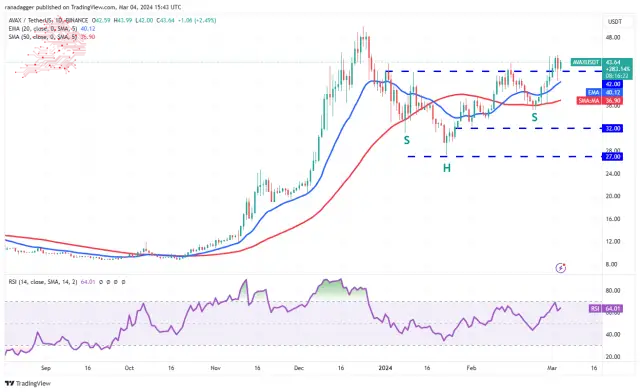
The AVAX/USDT pair is witnessing a tough battle between the bulls and the bears near the $42 level. If buyers flip the level into support and propel the price above $45, the pair could rally toward the psychological resistance at $50. If this level is overcome, the pair may reach the pattern target of $57.
Sellers must pull the price below the 20-day EMA ($40) to weaken the bulls. The pair could then slump to the 50-day SMA ($37), suggesting that the breakout on March 1 may have been a bull trap.
Source – Rakesh Upadhyay
Source: https://thebittimes.com/latest-market-overview-4th-march-spx-dxy-btc-eth-bnb-sol-xrp-ada-doge-avax-tbt86066.html


 Optimisus
 U_Today
 TheCoinrise Media
 Optimisus
 DogeHome
 TheNewsCrypto
 Times Tabloid
 DogeHome
 CFN
CFN


