


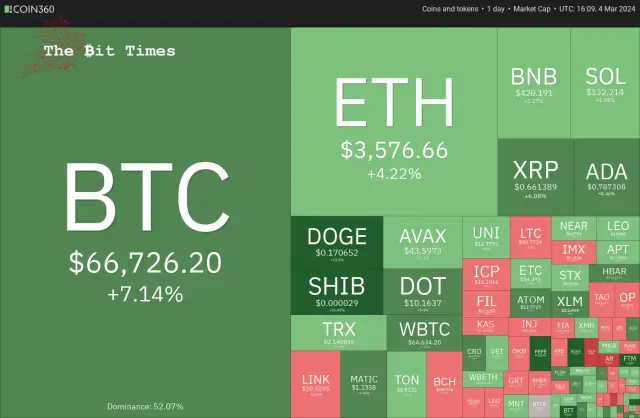
The Bitcoin market appears poised to surpass its record peak, yet traders must recall that steep climbs often lack sustainability.
比特币市场似乎即将超越其历史最高点,但交易者必须记住,急剧的上涨往往缺乏可持续性。
Last week, the S&P 500 Index market and the Nasdaq Composite market reached unprecedented highs, reflecting a risk-on attitude among market participants. Bitcoin is eager to join this trend, less than $2,000 away from its all-time high of $68,990 set in November 2021.
上周,标普500指数市场和纳斯达克综合指数市场创下历史新高,反映出市场参与者的风险偏好态度。比特币渴望加入这一趋势,距离 2021 年 11 月创下的历史高点 68,990 美元仅差不到 2,000 美元。
The momentum seems on the buyers’ side, potentially driving Bitcoin’s price to surpass its previous record in the coming days. However, the crucial question remains: Will breaching the $68,990 mark usher in a new phase of upward trend, or will it lead to a sharp downturn, trapping those who are overly optimistic?
这种势头似乎在买方这边,可能会推动比特币的价格在未来几天超越之前的纪录。然而,关键的问题依然存在:突破68,990美元大关是否会迎来新一轮的上涨趋势,还是会导致急剧下滑,让那些过于乐观的人陷入困境?
During a FOMO phase, strong returns are made within a short period. Even though the risk is high, the period rewards traders who can ride this phase. However, traders must be careful because sharp declines follow vertical rallies. Hence, traders should keep their stops ready lest their gains may evaporate quickly.
在 FOMO 阶段,短期内会获得丰厚回报。尽管风险很高,但这一时期会奖励能够度过这一阶段的交易者。然而,交易者必须小心,因为垂直上涨之后会出现急剧下跌。因此,交易者应做好止损准备,以免收益迅速蒸发。
Could the bulls propel Bitcoin to a new all-time high and maintain it, or is it time to book profits? Let’s analyze the charts to find out.
多头能否将比特币推向历史新高并维持下去,还是到了获利了结的时候了?让我们分析一下图表来找出答案。
S&P 500 Index (SPX) Market Analysis
标准普尔 500 指数 (SPX) 市场分析
The S&P 500 Index closed at a new all-time high on March 1, indicating that the bulls firmly remain in the driver’s seat.
3月1日,标准普尔500指数收于历史新高,表明多头仍牢牢占据主导地位。
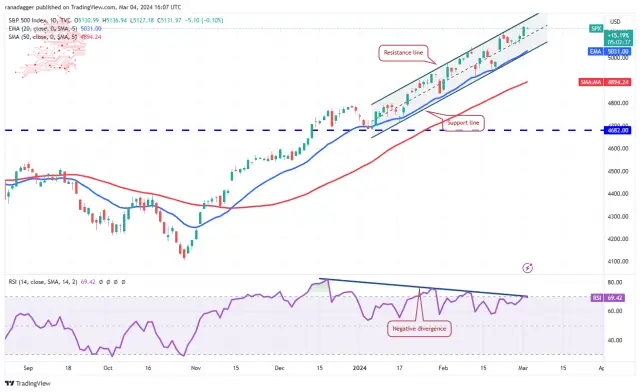
The index has been trading inside the ascending channel pattern for many days, indicating that the bears may pose a strong challenge at the resistance line. If the price turns down from the resistance line, the bears will try to pull the index to the support line. A break below the channel will start a short-term corrective phase.
该指数已经连续多日在上升通道模式内交易,表明空头可能对阻力线构成强有力的挑战。如果价格从阻力线下跌,空头将试图将指数拉至支撑线。跌破该通道将开始短期调整阶段。
On the contrary, if bulls catapult the price above the channel, it will signal a pickup in momentum. That could start a vertical rally, which may take the index to 5,300 and 5,500. Traders must be cautious as the negative divergence on the relative strength index (RSI) suggests the bulls may be losing steam.
相反,如果多头将价格推升至通道之上,则将预示着动能回升。这可能会引发垂直反弹,使该指数升至 5,300 点和 5,500 点。交易者必须保持谨慎,因为相对强弱指数(RSI)的负背离表明多头可能正在失去动力。
U.S. Dollar Index (DXY) Market Analysis
美元指数(DXY)市场分析
The bulls pushed the U.S. dollar Index (DXY) above the 20-day exponential moving average (104) on Feb. 29 but could not build upon it. Sellers pulled the price back below the 20-day EMA on March 1.
2 月 29 日,多头将美元指数 (DXY) 推升至 20 日指数移动平均线 (104) 上方,但未能在此基础上继续前进。 3 月 1 日,卖家将价格拉回至 20 日均线下方。
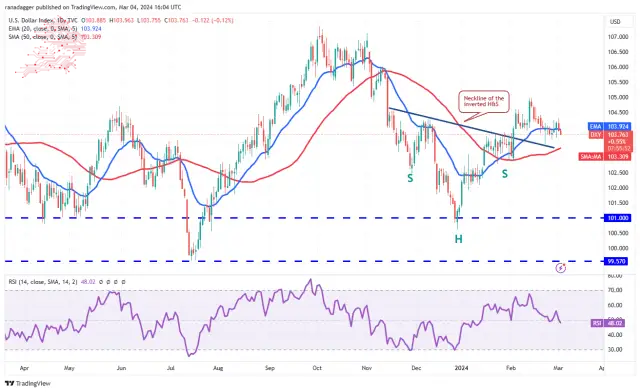
The 20-day EMA has flattened out, and the RSI is near the midpoint, indicating a possible range-bound action in the near term. If the price remains below the 20-day EMA, the index could slip to the 50-day simple moving average (103). Buyers are expected to defend this level with vigour.
20 日均线已经趋于平缓,RSI 接近中点,表明近期可能出现区间波动。如果价格保持在 20 日均线下方,该指数可能会滑向 50 日简单移动平均线 (103)。预计买家将大力捍卫这一水平。
Conversely, if the price turns up from the current level and rises above 104.30, it will indicate solid buying at lower levels. The index could then increase to 105. A break above this resistance could open the doors for a potential rise to 106.
相反,如果价格从当前水平回升并升至 104.30 以上,则表明较低水平上存在强劲买盘。然后该指数可能会升至 105。突破该阻力位可能会为升至 106 打开大门。
Bitcoin (BTC) Market Analysis
比特币(BTC)市场分析
Bitcoin has been in a solid uptrend for the past several days. The bears tried to halt the upmove near $64,000, but that resulted in the formation of a pennant.
过去几天,比特币一直处于稳健的上升趋势。空头试图阻止 64,000 美元附近的上涨,但这导致了三角旗的形成。
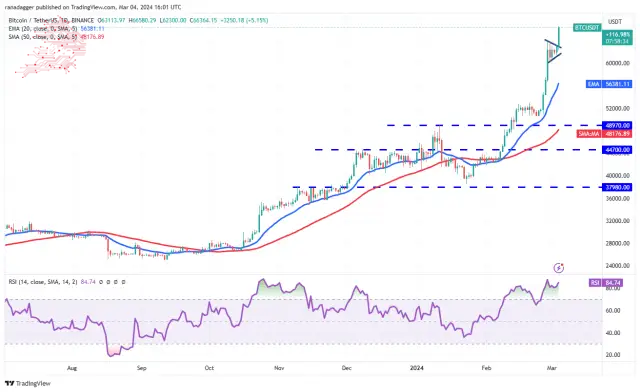
The bulls reasserted their supremacy after kicking the price above the pennant on March 4. This signals the start of the next leg of the uptrend, which could reach an all-time high at $68,990 and continue to $76,000, which is the pattern target of the breakout from the pennant.
多头在 3 月 4 日将价格踢至三角旗上方后,重新确立了自己的霸主地位。这标志着下一阶段上升趋势的开始,可能会达到 68,990 美元的历史高点,并继续升至 76,000 美元,这是金价的形态目标。从三角旗中突破。
Time is running out for the bears. They must quickly drag the price below $60,000 to make a comeback. If they do that, several stops of short-term traders may hit, and the BTC/USDT pair could drop to the 20-day EMA ($56,250).
留给熊的时间已经不多了。他们必须迅速将价格拉低至 60,000 美元以下才能东山再起。如果他们这样做,短期交易者可能会遭遇多次止损,BTC/USDT 货币对可能会跌至 20 日均线(56,250 美元)。
Ether (ETH) Price Analysis
以太币(ETH)价格分析
2 月 29 日,以太坊利润预定在 3,600 美元附近,但空头未能开始回调,这表明每次小幅下跌都被买入。
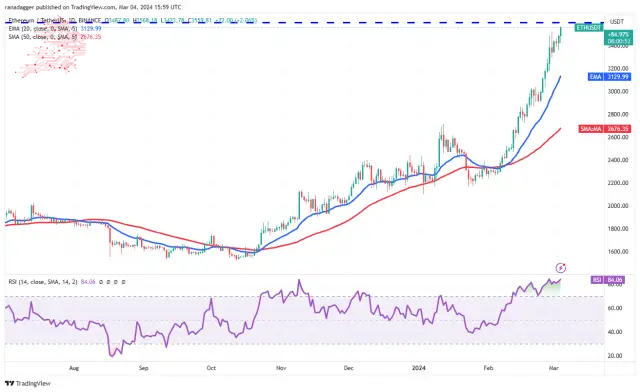
The bulls are again trying to overcome the stiff barrier at $3,600. If they manage to do that, the ETH/USDT pair could start the next leg of the uptrend and surge toward $4,000 and later to $4,150.
多头再次试图突破 3,600 美元的严格关口。如果他们成功做到这一点,ETH/USDT 货币对可能会开始下一阶段的上升趋势,并飙升至 4,000 美元,随后升至 4,150 美元。
The upsloping moving averages suggest that bulls are in control, but the RSI has been in the overbought zone for several days, increasing the possibility of a short-term pullback. The immediate support on the downside is at $3,300, and then the 20-day EMA ($3,129).
向上倾斜的均线表明多头处于控制之中,但RSI已连续多日处于超买区域,增加了短期回调的可能性。下行的直接支撑位于 3,300 美元,然后是 20 日均线(3,129 美元)。
BNB Price Analysis
BNB has been in an uptrend for several days. The bears tried to stall the rally at $427, but the bulls bought the dip on Feb. 29, indicating a positive sentiment.
BNB 价格分析 BNB 连续几天处于上涨趋势。空头试图阻止涨势至 427 美元,但多头在 2 月 29 日逢低买入,表明市场情绪积极。
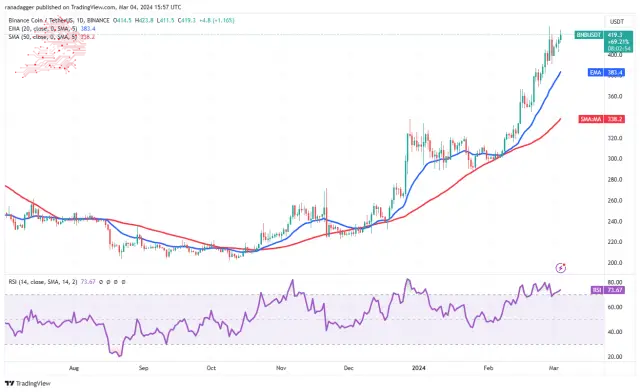
The rising moving averages and the RSI in the overbought zone suggest that the path of least resistance is to the upside. If buyers shove the price above $427, the BNB/USDT pair could reach $460. The bulls may find it challenging to break above this resistance with ease.
上升的移动平均线和超买区域的 RSI 表明阻力最小的路径是上行。如果买家将价格推高至 427 美元以上,BNB/USDT 货币对可能会达到 460 美元。多头可能会发现轻松突破该阻力位具有挑战性。
The critical support to watch on the downside is the 20-day EMA ($383). If this support cracks, it will indicate that the short-term traders may be rushing to the exit. That could start a corrective phase toward the 50-day SMA ($338).
下行方面值得关注的关键支撑是 20 日均线(383 美元)。如果该支撑位破裂,则表明短线交易者可能会急于退出。这可能会开始朝向 50 日移动平均线(338 美元)的修正阶段。
XRP Price Analysis
XRP 价格分析
XRP turned down sharply on March 3, but the long tail on the candlestick shows solid buying at lower levels.
XRP 于 3 月 3 日大幅下跌,但烛台上的长尾显示较低水平的强劲买盘。
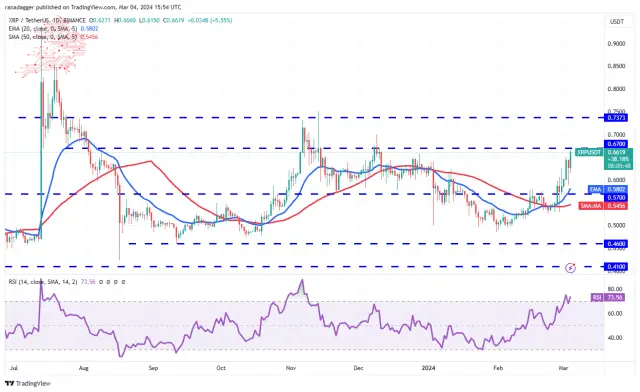
The upsloping 20-day EMA ($0.58) and the RSI in the overbought zone suggest the bulls are in command. There is a minor resistance at $0.67, but it is likely to be crossed. The rally could then reach the powerful resistance of $0.74.
不断上升的 20 日均线(0.58 美元)和超买区域的 RSI 表明多头处于主导地位。 0.67 美元有一个小阻力,但很可能会被突破。随后反弹可能会触及 0.74 美元的强大阻力位。
Instead, if the price turns down sharply from $0.67, it will signal that the bears are fiercely defending the level. That could pull the price down to the 20-day EMA and keep the XRP/USDT pair inside the $0.46 to $0.67 range for a while.
相反,如果价格从 0.67 美元大幅下跌,则表明空头正在激烈捍卫该水平。这可能会将价格拉低至 20 日均线,并使 XRP/USDT 货币对暂时保持在 0.46 美元至 0.67 美元的区间内。
Solana (SOL) Price Analysis
Solana (SOL) 价格分析
Solana closed above the $126 resistance on March 1, but the bulls struggled to sustain the momentum. This suggests a lack of demand at higher levels.
Solana 于 3 月 1 日收盘于 126 美元阻力位上方,但多头难以维持这一势头。这表明缺乏更高水平的需求。
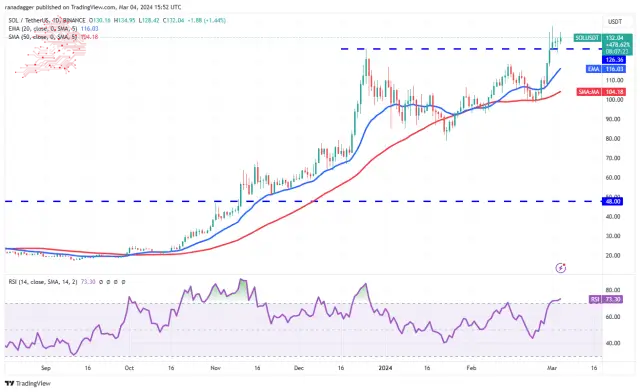
If the price maintains above $126, it will increase the likelihood of the resumption of the uptrend. If buyers pierce the $138 level, the SOL/USDT pair will likely rise to $143 and then to $158.
如果价格维持在 126 美元上方,将增加恢复上升趋势的可能性。如果买家突破 138 美元的水平,SOL/USDT 货币对可能会升至 143 美元,然后升至 158 美元。
Contrary to this assumption, if the $126 level gives way, the pair may slump to the 20-day EMA ($116). The bears must drag the price below the 20-day EMA to suggest that the breakout above $126 was fake. The pair may then drop to the 50-day SMA ($104).
与这一假设相反,如果 126 美元水平失守,该货币对可能会跌至 20 日均线(116 美元)。空头必须将价格拖至 20 日均线下方,才能表明突破 126 美元是假的。随后该货币对可能会跌至 50 日移动平均线(104 美元)。
Cardano (ADA) Price Analysis
卡尔达诺(ADA)价格分析
Cardano started the next leg of the uptrend after buyers overcame the $0.68 barrier on March 1. The bears tried to tug the price back below the breakout level on March 3, but the bulls held their ground. This shows strong buying on dips.
在买家于 3 月 1 日突破 0.68 美元关口后,卡尔达诺开始了下一阶段的上升趋势。空头试图将价格拉回到 3 月 3 日的突破水平以下,但多头坚守阵地。这表明逢低买盘强劲。
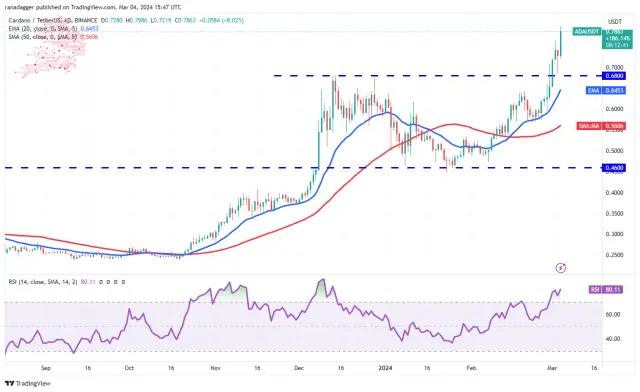
The up move will likely reach $0.90, where the bears are expected to mount a strong defence. If the momentum remains strong and buyers bulldoze through $0.90, the rally could extend to $1.25. The bulls may find it difficult to cross this level.
上涨幅度可能会达到 0.90 美元,预计空头将在此进行强有力的防御。如果势头依然强劲并且买家突破 0.90 美元,则涨势可能会扩大至 1.25 美元。多头可能会发现很难突破这个水平。
The RSI has risen above 80, indicating that the rally is at a risk of stalling. The 20-day EMA ($0.64) remains the essential support to watch out for on the downside. A break and close below this level will signal that the bulls are losing their grip. The ADA/USDT pair may slide to the 50-day SMA ($0.56).
RSI已升至80以上,表明涨势面临停滞风险。 20 日均线(0.64 美元)仍然是下行方面值得关注的重要支撑。突破并收盘低于该水平将表明多头正在失去控制。 ADA/USDT 货币对可能会滑向 50 日移动平均线(0.56 美元)。
Dogecoin (DOGE) Price Analysis
At $0.19, Dogecoin has been in a strong bull run for the past few days. The bears tried to pull the price lower on March 3, but the long tail on the candlestick shows aggressive buying by the bulls.
狗狗币 (DOGE) 价格分析 狗狗币价格为 0.19 美元,过去几天一直处于强劲的牛市行情中。 3 月 3 日,空头试图拉低价格,但烛台上的长尾表明多头积极买盘。
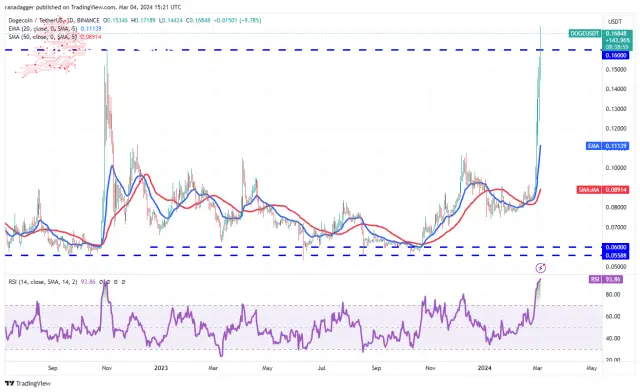
The bulls resumed the uptrend by pushing the DOGE/USDT pair above the $0.16 overhead resistance on March 4. This opens the door for a possible rise to $0.18 and, after that, to $0.22. The sharp rally has sent the RSI deep into the overbought territory, suggesting a consolidation or correction may be around the corner.
3 月 4 日,多头将 DOGE/USDT 货币对推升至 0.16 美元上方阻力位,从而恢复了上升趋势。这为可能上涨至 0.18 美元,然后上涨至 0.22 美元打开了大门。大幅上涨已使 RSI 深入超买区域,表明盘整或调整可能即将到来。
The first support on the downside is at $0.16 and then at $0.12. If this support is taken out, it will suggest that the uptrend may be over.
下行的第一个支撑位是 0.16 美元,然后是 0.12 美元。如果该支撑被取消,则表明上升趋势可能结束。
Avalanche (AVAX) Price Analysis
Avalanche completed a bullish inverse head-and-shoulders pattern after the price closed above the neckline at $42 on March 1.
Avalanche (AVAX) 价格分析 Avalanche 在 3 月 1 日收盘于颈线上方 42 美元后,完成了看涨的反向头肩形态。
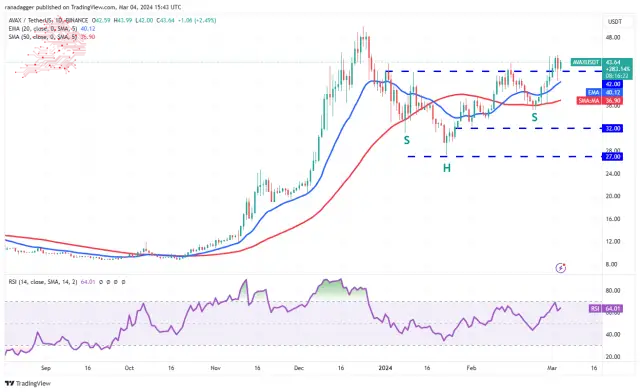
The AVAX/USDT pair is witnessing a tough battle between the bulls and the bears near the $42 level. If buyers flip the level into support and propel the price above $45, the pair could rally toward the psychological resistance at $50. If this level is overcome, the pair may reach the pattern target of $57.
AVAX/USDT 货币对正在 42 美元附近见证多头和空头之间的激烈战斗。如果买家将该水平转变为支撑位并将价格推高至 45 美元以上,则该货币对可能会反弹至 50 美元的心理阻力位。如果突破该水平,该货币对可能会达到 57 美元的形态目标。
Sellers must pull the price below the 20-day EMA ($40) to weaken the bulls. The pair could then slump to the 50-day SMA ($37), suggesting that the breakout on March 1 may have been a bull trap.
卖家必须将价格拉至 20 日均线(40 美元)以下,以削弱多头的力量。随后该货币对可能会跌至 50 日移动平均线(37 美元),这表明 3 月 1 日的突破可能是一个牛市陷阱。
Source – Rakesh Upadhyay
来源——Rakesh Upadhyay
Source: https://thebittimes.com/latest-market-overview-4th-march-spx-dxy-btc-eth-bnb-sol-xrp-ada-doge-avax-tbt86066.html
资料来源:https://thebittimes.com/latest-market-overview-4th-march-spx-dxy-btc-eth-bnb-sol-xrp-ada-doge-avax-tbt86066.html
 Optimisus
 U_Today
 TheCoinrise Media
 Optimisus
 DogeHome
 TheNewsCrypto
 Times Tabloid
 DogeHome
 CFN
CFN


