


The Bitcoin market appears poised to surpass its record peak, yet traders must recall that steep climbs often lack sustainability.
비트코인 시장은 최고 기록을 넘어설 것으로 보이지만 거래자들은 가파른 상승에는 지속 가능성이 부족한 경우가 많다는 점을 기억해야 합니다.
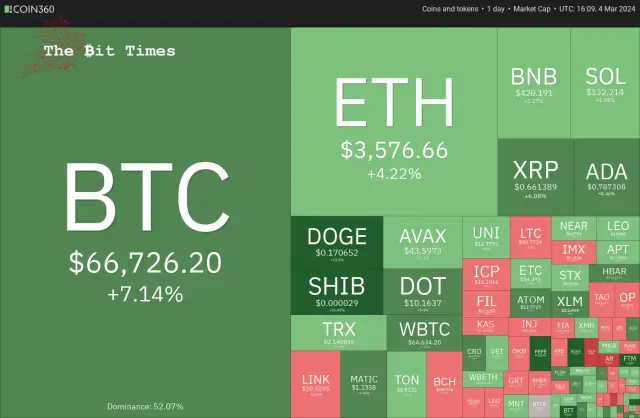
Last week, the S&P 500 Index market and the Nasdaq Composite market reached unprecedented highs, reflecting a risk-on attitude among market participants. Bitcoin is eager to join this trend, less than $2,000 away from its all-time high of $68,990 set in November 2021.
지난 주 S&P 500 지수 시장과 나스닥 종합 시장은 전례 없는 최고치를 기록했는데, 이는 시장 참여자들의 위험에 대한 태도를 반영한 것입니다. 비트코인은 2021년 11월에 설정된 사상 최고치인 68,990달러에서 2,000달러도 채 안 되는 금액으로 이러한 추세에 합류하기를 열망하고 있습니다.
The momentum seems on the buyers’ side, potentially driving Bitcoin’s price to surpass its previous record in the coming days. However, the crucial question remains: Will breaching the $68,990 mark usher in a new phase of upward trend, or will it lead to a sharp downturn, trapping those who are overly optimistic?
이러한 추진력은 구매자 측에 있는 것으로 보이며 잠재적으로 비트코인 가격이 며칠 내에 이전 기록을 넘어설 가능성이 있습니다. 그러나 중요한 질문은 남아 있습니다. 68,990달러를 돌파하면 새로운 상승 추세 국면을 맞이하게 될까요, 아니면 급격한 하락세로 이어져 지나치게 낙관적인 사람들을 가두게 될까요?
During a FOMO phase, strong returns are made within a short period. Even though the risk is high, the period rewards traders who can ride this phase. However, traders must be careful because sharp declines follow vertical rallies. Hence, traders should keep their stops ready lest their gains may evaporate quickly.
FOMO 단계에서는 단기간에 강력한 수익이 발생합니다. 위험이 높더라도 기간은 이 단계를 탈 수 있는 거래자에게 보상을 줍니다. 그러나 수직 상승에는 급격한 하락이 따르기 때문에 트레이더들은 주의해야 합니다. 따라서 거래자는 이익이 빠르게 증발하지 않도록 정지를 준비해야 합니다.
Could the bulls propel Bitcoin to a new all-time high and maintain it, or is it time to book profits? Let’s analyze the charts to find out.
강세론자들이 비트코인을 사상 최고치로 끌어올리고 이를 유지할 수 있을까요, 아니면 이제 수익을 기록해야 할 때일까요? 알아보기 위해 차트를 분석해 보겠습니다.
S&P 500 Index (SPX) Market Analysis
S&P 500 지수(SPX) 시장 분석
The S&P 500 Index closed at a new all-time high on March 1, indicating that the bulls firmly remain in the driver’s seat.
S&P 500 지수는 3월 1일 사상 최고치를 경신하며 마감했는데, 이는 황소가 여전히 주도권을 잡고 있음을 나타냅니다.
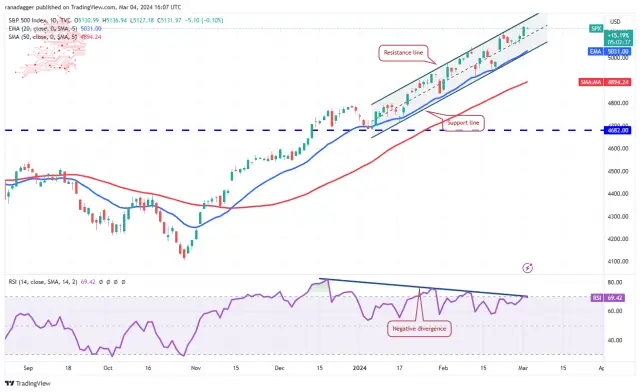
The index has been trading inside the ascending channel pattern for many days, indicating that the bears may pose a strong challenge at the resistance line. If the price turns down from the resistance line, the bears will try to pull the index to the support line. A break below the channel will start a short-term corrective phase.
지수는 며칠 동안 상승 채널 패턴 내에서 거래되어 왔으며 이는 하락세가 저항선에서 강력한 도전을 제기할 수 있음을 나타냅니다. 가격이 저항선에서 하락하면 하락세는 지수를 지지선으로 끌어내리려고 할 것입니다. 채널 아래에서 중단되면 단기적인 조정 단계가 시작됩니다.
On the contrary, if bulls catapult the price above the channel, it will signal a pickup in momentum. That could start a vertical rally, which may take the index to 5,300 and 5,500. Traders must be cautious as the negative divergence on the relative strength index (RSI) suggests the bulls may be losing steam.
반대로 상승세가 채널 위로 급등하면 모멘텀이 회복된다는 신호입니다. 이는 수직 랠리를 시작하여 지수가 5,300과 5,500까지 오를 수 있습니다. 상대강도지수(RSI)의 마이너스 다이버전스는 상승세가 힘을 잃고 있음을 시사하므로 트레이더들은 주의해야 합니다.
U.S. Dollar Index (DXY) Market Analysis
미국 달러 지수(DXY) 시장 분석
The bulls pushed the U.S. dollar Index (DXY) above the 20-day exponential moving average (104) on Feb. 29 but could not build upon it. Sellers pulled the price back below the 20-day EMA on March 1.
상승세는 2월 29일 미국 달러 지수(DXY)를 20일 지수 이동 평균(104) 위로 올렸지만 이를 기반으로 하지 못했습니다. 판매자들은 3월 1일에 가격을 20일 EMA 아래로 되돌렸습니다.
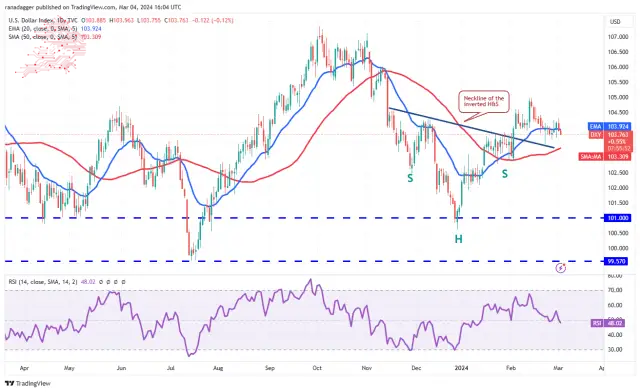
The 20-day EMA has flattened out, and the RSI is near the midpoint, indicating a possible range-bound action in the near term. If the price remains below the 20-day EMA, the index could slip to the 50-day simple moving average (103). Buyers are expected to defend this level with vigour.
20일 EMA는 평준화되었고 RSI는 중간 지점 근처에 있어 단기적으로 범위 제한 조치가 가능함을 나타냅니다. 가격이 20일 EMA 아래에 머물면 지수는 50일 단순 이동 평균(103)으로 하락할 수 있습니다. 구매자들은 이 수준을 적극적으로 방어할 것으로 예상됩니다.
Conversely, if the price turns up from the current level and rises above 104.30, it will indicate solid buying at lower levels. The index could then increase to 105. A break above this resistance could open the doors for a potential rise to 106.
반대로, 가격이 현재 수준에서 상승하여 104.30을 넘어선다면 낮은 수준에서 견고한 매수를 의미합니다. 그러면 지수는 105까지 상승할 수 있습니다. 이 저항선을 돌파하면 106까지 상승할 가능성이 있습니다.
Bitcoin (BTC) Market Analysis
비트코인(BTC) 시장 분석
Bitcoin has been in a solid uptrend for the past several days. The bears tried to halt the upmove near $64,000, but that resulted in the formation of a pennant.
비트코인은 지난 며칠 동안 견고한 상승세를 이어왔습니다. 하락세는 64,000달러 근처에서 상승세를 막으려고 했지만 그 결과 페넌트가 형성되었습니다.
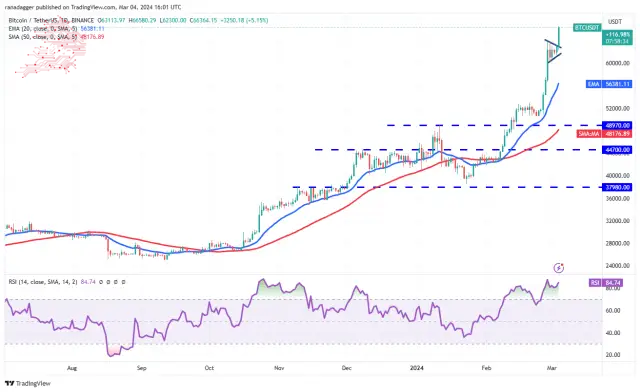
The bulls reasserted their supremacy after kicking the price above the pennant on March 4. This signals the start of the next leg of the uptrend, which could reach an all-time high at $68,990 and continue to $76,000, which is the pattern target of the breakout from the pennant.
황소는 3월 4일 페넌트 위로 가격을 올린 후 다시 우위를 점했습니다. 이는 다음 상승 추세의 시작을 알리는 신호로, 사상 최고치인 68,990달러에 도달하고 패턴 목표인 76,000달러까지 계속될 수 있습니다. 페넌트에서 탈주.
Time is running out for the bears. They must quickly drag the price below $60,000 to make a comeback. If they do that, several stops of short-term traders may hit, and the BTC/USDT pair could drop to the 20-day EMA ($56,250).
곰을 위한 시간이 얼마 남지 않았습니다. 그들이 복귀하려면 가격을 60,000달러 아래로 빠르게 끌어내야 합니다. 그렇게 하면 단기 거래자들의 여러 정거장이 타격을 입을 수 있으며 BTC/USDT 쌍은 20일 EMA($56,250)로 떨어질 수 있습니다.
Ether (ETH) Price Analysis
이더(ETH) 가격 분석
Ether는 2월 29일에 $3,600 근처의 이익 기록을 목격했지만 하락세가 시작되지 않아 모든 소폭 하락이 매수되고 있음을 나타냅니다.
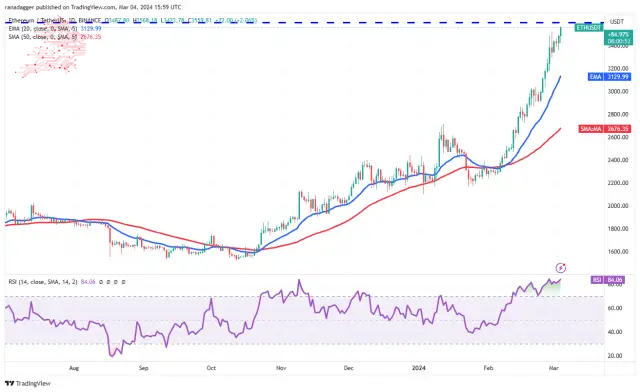
The bulls are again trying to overcome the stiff barrier at $3,600. If they manage to do that, the ETH/USDT pair could start the next leg of the uptrend and surge toward $4,000 and later to $4,150.
강세론자들은 다시 $3,600의 견고한 장벽을 극복하려고 노력하고 있습니다. 그렇게 한다면 ETH/USDT 쌍은 다음 상승 추세를 시작하여 4,000달러를 향해 급등하고 나중에는 4,150달러까지 급등할 수 있습니다.
The upsloping moving averages suggest that bulls are in control, but the RSI has been in the overbought zone for several days, increasing the possibility of a short-term pullback. The immediate support on the downside is at $3,300, and then the 20-day EMA ($3,129).
상승하는 이동평균선은 상승세가 통제되고 있음을 시사하지만 RSI는 며칠 동안 과매수권에 머물면서 단기적인 하락 가능성을 높였습니다. 하락세에 대한 즉각적인 지지는 $3,300이고 그 다음에는 20일 EMA($3,129)입니다.
BNB Price Analysis
BNB has been in an uptrend for several days. The bears tried to stall the rally at $427, but the bulls bought the dip on Feb. 29, indicating a positive sentiment.
BNB 가격 분석 BNB는 며칠 동안 상승 추세를 보였습니다. 하락세는 427달러에서 랠리를 멈추려고 했으나 상승세는 2월 29일 하락세를 매수해 긍정적인 분위기를 나타냈습니다.
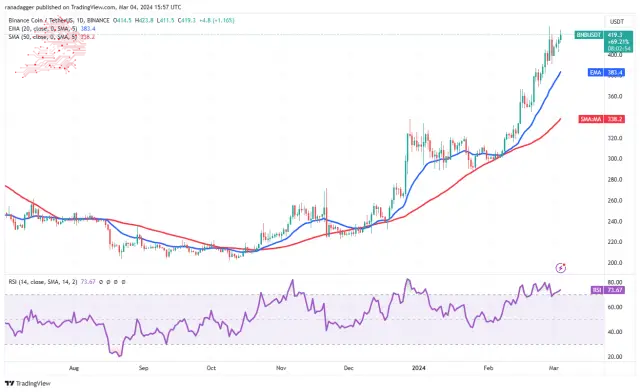
The rising moving averages and the RSI in the overbought zone suggest that the path of least resistance is to the upside. If buyers shove the price above $427, the BNB/USDT pair could reach $460. The bulls may find it challenging to break above this resistance with ease.
상승하는 이동평균선과 과매수 구간의 RSI는 저항이 가장 적은 곳이 상승 방향임을 시사합니다. 구매자가 가격을 $427 이상으로 올리면 BNB/USDT 쌍은 $460에 도달할 수 있습니다. 황소는 이 저항을 쉽게 돌파하는 것이 어려울 수 있습니다.
The critical support to watch on the downside is the 20-day EMA ($383). If this support cracks, it will indicate that the short-term traders may be rushing to the exit. That could start a corrective phase toward the 50-day SMA ($338).
하락세에서 주목해야 할 중요한 지지선은 20일 EMA($383)입니다. 이 지지선에 균열이 생기면 단기 트레이더들이 출구로 돌진할 수도 있음을 나타냅니다. 이는 50일 SMA(338달러)를 향한 조정 단계를 시작할 수 있습니다.
XRP Price Analysis
XRP 가격 분석
XRP turned down sharply on March 3, but the long tail on the candlestick shows solid buying at lower levels.
XRP는 3월 3일에 급격하게 하락했지만 캔들스틱의 긴 꼬리는 낮은 수준에서 견고한 구매를 보여줍니다.
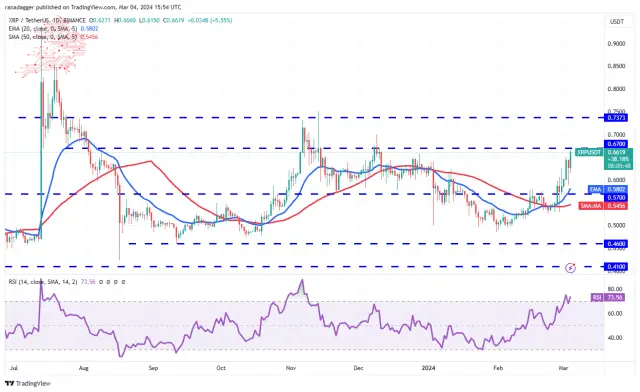
The upsloping 20-day EMA ($0.58) and the RSI in the overbought zone suggest the bulls are in command. There is a minor resistance at $0.67, but it is likely to be crossed. The rally could then reach the powerful resistance of $0.74.
상승세를 보이는 20일 EMA($0.58)와 과매수 구간의 RSI는 강세가 지배하고 있음을 나타냅니다. $0.67에 작은 저항이 있지만 교차할 가능성이 높습니다. 그러면 랠리는 0.74달러의 강력한 저항선에 도달할 수 있습니다.
Instead, if the price turns down sharply from $0.67, it will signal that the bears are fiercely defending the level. That could pull the price down to the 20-day EMA and keep the XRP/USDT pair inside the $0.46 to $0.67 range for a while.
대신 가격이 0.67달러에서 급격히 하락한다면 하락세가 치열하게 방어하고 있다는 신호가 될 것입니다. 이는 가격을 20일 EMA까지 낮추고 XRP/USDT 쌍을 한동안 $0.46~$0.67 범위 내에 유지할 수 있습니다.
Solana (SOL) Price Analysis
솔라나(SOL) 가격 분석
Solana closed above the $126 resistance on March 1, but the bulls struggled to sustain the momentum. This suggests a lack of demand at higher levels.
솔라나는 3월 1일 저항선인 126달러 위로 마감했지만 상승세는 모멘텀을 유지하는 데 어려움을 겪었습니다. 이는 더 높은 수준에서는 수요가 부족하다는 것을 의미합니다.
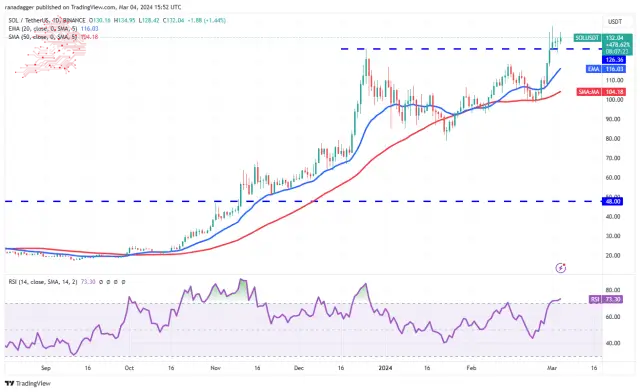
If the price maintains above $126, it will increase the likelihood of the resumption of the uptrend. If buyers pierce the $138 level, the SOL/USDT pair will likely rise to $143 and then to $158.
가격이 $126 이상으로 유지되면 상승 추세가 재개될 가능성이 높아집니다. 구매자가 138달러 수준을 돌파하면 SOL/USDT 쌍은 143달러로 상승한 다음 158달러로 상승할 가능성이 높습니다.
Contrary to this assumption, if the $126 level gives way, the pair may slump to the 20-day EMA ($116). The bears must drag the price below the 20-day EMA to suggest that the breakout above $126 was fake. The pair may then drop to the 50-day SMA ($104).
이러한 가정과는 반대로, $126 수준이 무너지면 통화쌍은 20일 EMA($116)까지 하락할 수 있습니다. 하락세는 가격을 20일 EMA 아래로 끌어내야 126달러 이상의 돌파가 가짜였다고 암시할 수 있습니다. 그러면 해당 쌍은 50일 SMA($104)로 떨어질 수 있습니다.
Cardano (ADA) Price Analysis
카르다노(ADA) 가격 분석
Cardano started the next leg of the uptrend after buyers overcame the $0.68 barrier on March 1. The bears tried to tug the price back below the breakout level on March 3, but the bulls held their ground. This shows strong buying on dips.
Cardano는 3월 1일 구매자가 0.68달러 장벽을 극복한 후 상승 추세의 다음 단계를 시작했습니다. 하락세는 3월 3일 가격을 돌파 수준 아래로 끌어내리려 했지만 상승세는 그 자리를 지켰습니다. 이는 하락 시 강력한 매수세를 보여줍니다.
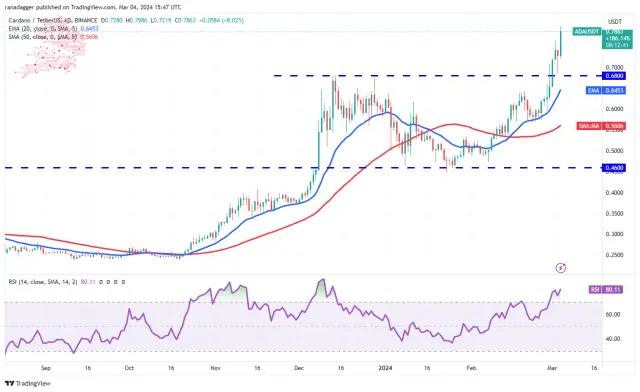
The up move will likely reach $0.90, where the bears are expected to mount a strong defence. If the momentum remains strong and buyers bulldoze through $0.90, the rally could extend to $1.25. The bulls may find it difficult to cross this level.
상승 움직임은 $0.90에 도달할 가능성이 높으며, 여기서 곰은 강력한 방어력을 발휘할 것으로 예상됩니다. 모멘텀이 여전히 강하고 구매자가 0.90달러를 돌파한다면 랠리는 1.25달러까지 확대될 수 있습니다. 황소들은 이 수준을 넘기가 어려울 수도 있습니다.
The RSI has risen above 80, indicating that the rally is at a risk of stalling. The 20-day EMA ($0.64) remains the essential support to watch out for on the downside. A break and close below this level will signal that the bulls are losing their grip. The ADA/USDT pair may slide to the 50-day SMA ($0.56).
RSI가 80을 넘어 상승해 랠리가 정체될 위험이 있음을 나타냅니다. 20일 EMA($0.64)는 여전히 하락세를 주의해야 할 필수 지지선으로 남아 있습니다. 이 수준 이하의 돌파 및 종가는 상승세의 지배력을 잃고 있다는 신호입니다. ADA/USDT 쌍은 50일 SMA($0.56)로 하락할 수 있습니다.
Dogecoin (DOGE) Price Analysis
At $0.19, Dogecoin has been in a strong bull run for the past few days. The bears tried to pull the price lower on March 3, but the long tail on the candlestick shows aggressive buying by the bulls.
Dogecoin(DOGE) 가격 분석 $0.19의 Dogecoin은 지난 며칠 동안 강한 강세를 보였습니다. 하락세는 3월 3일에 가격을 낮추려고 시도했지만 캔들스틱의 긴 꼬리는 상승세력의 공격적인 매수를 보여줍니다.
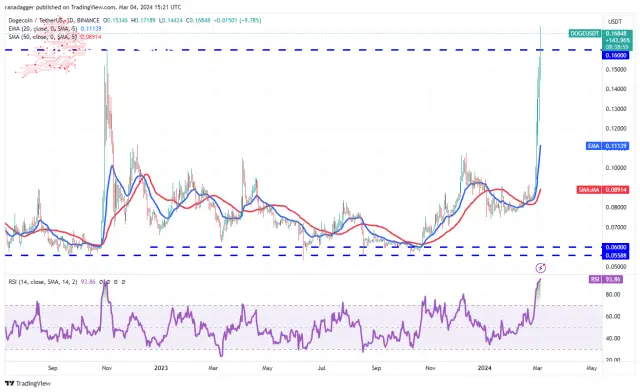
The bulls resumed the uptrend by pushing the DOGE/USDT pair above the $0.16 overhead resistance on March 4. This opens the door for a possible rise to $0.18 and, after that, to $0.22. The sharp rally has sent the RSI deep into the overbought territory, suggesting a consolidation or correction may be around the corner.
상승세는 3월 4일 DOGE/USDT 쌍을 0.16달러 오버헤드 저항선 위로 올려 상승 추세를 재개했습니다. 이로 인해 0.18달러까지 상승할 수 있는 문이 열리고 그 이후에는 0.22달러까지 상승할 수 있는 문이 열립니다. 급격한 랠리로 인해 RSI가 과매수 영역 깊숙이 들어가면서 횡보 또는 조정이 임박했음을 시사합니다.
The first support on the downside is at $0.16 and then at $0.12. If this support is taken out, it will suggest that the uptrend may be over.
아래쪽의 첫 번째 지지선은 $0.16이고 그 다음에는 $0.12입니다. 이 지지선이 제거되면 상승 추세가 끝날 수 있음을 시사합니다.
Avalanche (AVAX) Price Analysis
Avalanche completed a bullish inverse head-and-shoulders pattern after the price closed above the neckline at $42 on March 1.
Avalanche(AVAX) 가격 분석 Avalanche는 3월 1일 가격이 42달러로 네크라인 위에서 마감된 후 강세 역헤드앤숄더 패턴을 완성했습니다.
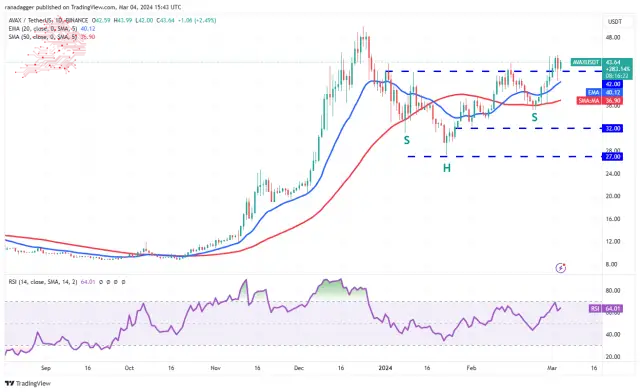
The AVAX/USDT pair is witnessing a tough battle between the bulls and the bears near the $42 level. If buyers flip the level into support and propel the price above $45, the pair could rally toward the psychological resistance at $50. If this level is overcome, the pair may reach the pattern target of $57.
AVAX/USDT 쌍은 42달러 수준 근처에서 황소와 곰 사이의 치열한 전투를 목격하고 있습니다. 구매자가 해당 수준을 지지선으로 바꾸고 가격을 45달러 이상으로 끌어올리면 쌍은 50달러의 심리적 저항선을 향해 반등할 수 있습니다. 이 수준을 극복하면 패턴 목표인 $57에 도달할 수 있습니다.
Sellers must pull the price below the 20-day EMA ($40) to weaken the bulls. The pair could then slump to the 50-day SMA ($37), suggesting that the breakout on March 1 may have been a bull trap.
매도자는 강세를 약화시키려면 가격을 20일 EMA($40) 아래로 끌어내야 합니다. 그러면 통화쌍은 50일 SMA($37)까지 하락할 수 있으며, 이는 3월 1일의 돌파가 황소 함정이었을 수도 있음을 시사합니다.
Source – Rakesh Upadhyay
출처 – Rakesh Upadhyay
Source: https://thebittimes.com/latest-market-overview-4th-march-spx-dxy-btc-eth-bnb-sol-xrp-ada-doge-avax-tbt86066.html
출처: https://thebittimes.com/latest-market-overview-4th-march-spx-dxy-btc-eth-bnb-sol-xrp-ada-doge-avax-tbt86066.html
 Optimisus
 U_Today
 TheCoinrise Media
 Optimisus
 DogeHome
 TheNewsCrypto
 Times Tabloid
 DogeHome
 CFN
CFN


