


The Bitcoin Market is showing positive signs, though it may encounter significant resistance if it surpasses $72,000.
比特幣市場正顯示出積極的跡象,但如果突破 72,000 美元,可能會遇到重大阻力。
Despite a recent dip, interest in Bitcoin spot exchange-traded funds (ETFs) remains strong. After a week marked by consecutive net outflows, the tide turned with significant net inflows recorded on March 26th and 27th, totalling $418 million and $243 million, respectively, as reported by Farside Investors.
儘管最近有所下降,但人們對比特幣現貨交易所交易基金(ETF)的興趣仍然強勁。根據 Farside Investors 報告,在連續一週淨流出之後,趨勢發生逆轉,3 月 26 日和 27 日錄得大幅淨流入,淨流入總額分別為 4.18 億美元和 2.43 億美元。
In an interview with Fox Business, BlackRock CEO Larry Fink has expressed optimism about the firm’s Bitcoin spot ETF. He remarked on the ETF’s rapid growth, noting it as the quickest to expand in the ETF industry’s history. Fink also conveyed his strong confidence in Bitcoin’s prospects.
在接受福斯商業頻道採訪時,貝萊德執行長拉里·芬克對該公司的比特幣現貨 ETF 表示樂觀。他評論了 ETF 的快速成長,並指出這是 ETF 行業歷史上擴張速度最快的。芬克也表達了他對比特幣前景的堅定信心。
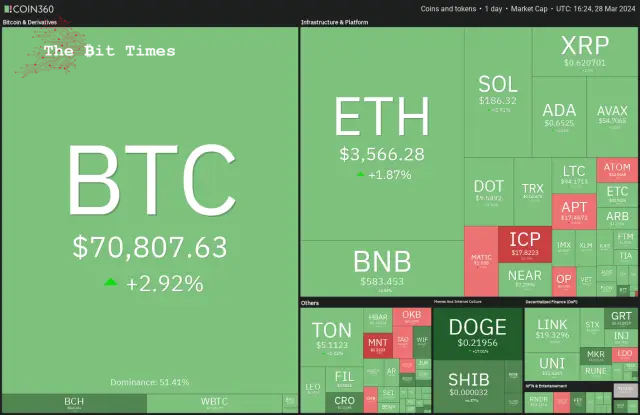
On-chain analytics platform CryptoQuant said in its latest “Weekly Crypto Report” that Bitcoin’s demand skyrocketed from “40K Bitcoin at the start of 2024 to 213K Bitcoin” on March 26. That could create a “sell-side liquidity crisis” within the following year.
鏈上分析平台CryptoQuant 在其最新的「每週加密報告」中表示,比特幣的需求從「2024 年初的4 萬比特幣飆升至3 月26 日的21.3 萬比特幣」。的時間內造成「賣方流動性危機」年。
Could Bitcoin continue its recovery and hit a new all-time high before the Bitcoin halving? Will that trigger buying in altcoins? Let’s analyze the charts of the top 10 cryptocurrencies to find out.
比特幣能否在比特幣減半之前繼續復甦並創下歷史新高?這會引發山寨幣的購買嗎?讓我們分析一下前 10 名加密貨幣的圖表來找出答案。
Bitcoin (BTC) Market Analysis
比特幣(BTC)市場分析
The Bitcoin market witnessed profit booking on March 26 and 27, but a positive sign is that the bulls maintained the price above the pennant.
比特幣市場在3月26日和27日出現獲利盤,但一個積極的跡像是多頭將價格維持在三角旗之上。
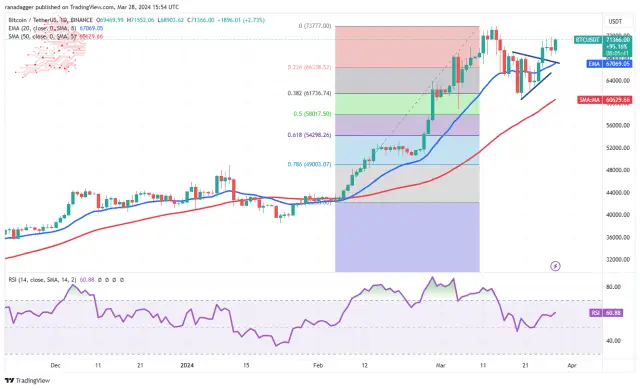
The 20-day exponential moving average (EMA) ($67,069) has started to rise, and the relative strength index (RSI) is in positive territory, suggesting that the path of least resistance is to the upside.
20 天指數移動平均線 (EMA)(67,069 美元)已開始上漲,相對強弱指數 (RSI) 處於正值區域,顯示阻力最小的路徑是上行。
If buyers drive the price above $73,777, the BTC/USDT pair will likely increase momentum and rally to $80,000.
如果買家將價格推高至 73,777 美元以上,BTC/USDT 貨幣對可能會增加勢頭並反彈至 80,000 美元。
On the contrary, if the price declines from its current level and breaks below the 20-day EMA, it could lead to a potential drop to the 50-day simple moving average ($60,629).
相反,如果價格從當前水準下跌並跌破 20 日均線,則可能會導致跌至 50 日簡單移動平均線(60,629 美元)。
Ether (ETH) Market Analysis
以太坊(ETH)市場分析
The Ether Market is facing selling near $3,678, but a positive sign is that the bulls are trying to defend the 20-day EMA ($3,530).
以太坊市場面臨 3,678 美元附近的拋售,但一個積極的跡像是多頭正在努力捍衛 20 日均線(3,530 美元)。
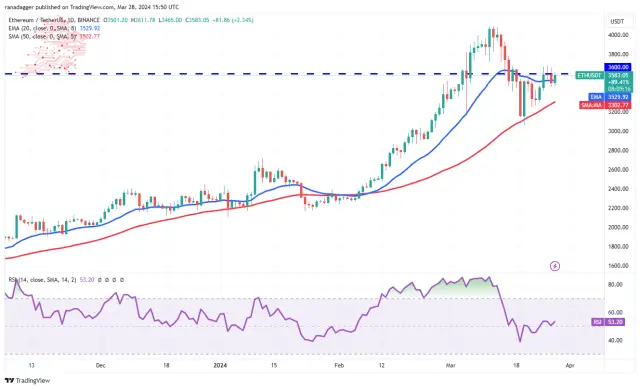
If the price breaks above $3,678, the possibility of a rally to $4,100 increases. This level may act as a stiff hurdle, but if the buyers prevail, the ETH/USDT pair could rally to $4,500 and then to $4,868.
如果價格突破 3,678 美元,上漲至 4,100 美元的可能性就會增加。這一水平可能會成為一個嚴格的障礙,但如果買家佔上風,ETH/USDT 貨幣對可能會反彈至 4,500 美元,然後升至 4,868 美元。
Conversely, if the price turns sharply and breaks below $3,460, it will suggest that the bears are unwilling to give up. The pair may then slip to the 50-day SMA ($3,302). A slide below this support could start a deeper correction.
相反,如果價格急劇轉向並跌破3,460美元,則表示空頭不願放棄。然後該貨幣對可能會滑向 50 日移動平均線(3,302 美元)。跌破該支撐位可能會開始更深層的調整。
BNB Market Analysis
BNB市場分析
The long wick on BNB’s March 25 and 26 candlesticks shows that the bears are defending the 61.8% Fibonacci retracement level of $588.
BNB 3 月 25 日和 26 日燭台上的長影線表明空頭正在捍衛 588 美元的 61.8% 斐波那契回撤位。
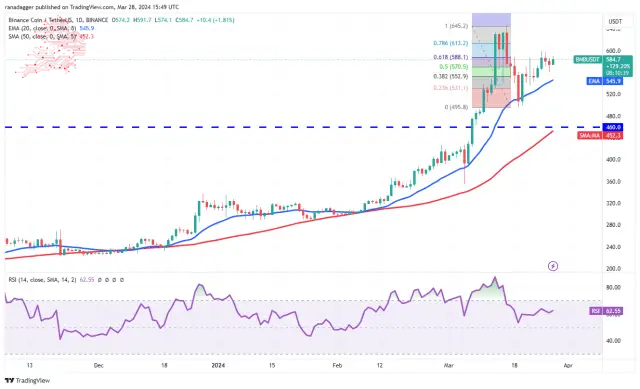
If the price turns down from the current level, the BNB/USDT pair could reach the 20-day EMA ($546). This remains the critical level to watch. If the price rebounds off the 20-day EMA, the pair will again attempt to rise above $600 and reach $645.
如果價格從目前水準下跌,BNB/USDT 貨幣對可能會觸及 20 日均線(546 美元)。這仍然是值得關注的關鍵水平。如果價格從 20 日均線反彈,該貨幣對將再次嘗試升至 600 美元以上並達到 645 美元。
On the other hand, if the price drops below the 20-day EMA, it will signal that the bears are trying to gain the upper hand. The pair could then drop to the critical support at $495. The bulls may aggressively buy the dips to this level.
另一方面,如果價格跌破 20 日均線,則表示空頭正試圖佔上風。隨後該貨幣對可能會跌至關鍵支撐位 495 美元。多頭可能會逢低積極買進至該水準。
Solana (SOL) Price Analysis
Solana (SOL) 價格分析
Solana’s recovery is faltering at $196, indicating that the bears sell on relief rallies near the overhead resistance of $205.
Solana 的復甦在 196 美元處徘徊,這表明空頭在 205 美元上方阻力位附近的反彈中賣出。
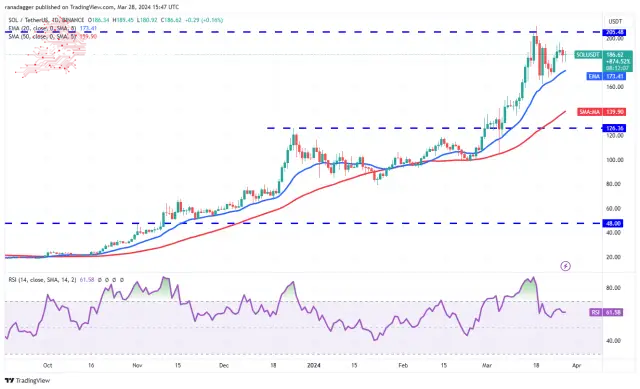
The bears will try to pull the price to the 20-day EMA ($173), which is a crucial level to watch. If the price plunges below the 20-day EMA, it will suggest the bears are in the driver’s seat. The SOL/USDT pair could decline to $162 and below that to the 50-day SMA ($140).
空頭將試圖將價格拉至 20 日均線(173 美元),這是一個值得關注的關鍵水平。如果價格跌破 20 日均線,則表示空頭佔據主導地位。 SOL/USDT 貨幣對可能會跌至 162 美元,並低於 50 日移動平均線(140 美元)。
Instead, if the price turns up from the current level or rebounds off the 20-day EMA, it will indicate solid demand at lower levels. That will enhance the prospects of a break above $205. If that happens, the pair may start its journey to $267.
相反,如果價格從當前水準回升或從 20 日均線反彈,則表示較低水準的需求強勁。這將增強其突破 205 美元的前景。如果發生這種情況,該貨幣對可能會開始上漲至 267 美元。
XRP Price Analysis
XRP has been stuck between the uptrend line and $0.67 for the past few days, indicating indecision among the buyers and sellers.
XRP 價格分析 過去幾天,XRP 一直徘徊在上升趨勢線和 0.67 美元之間,顯示買家和賣家猶豫不決。
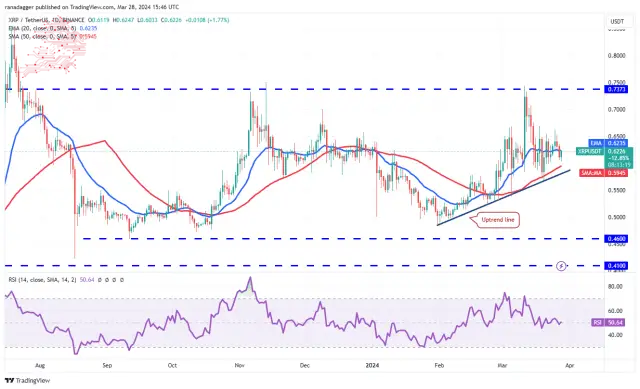
If the price maintains below the 20-day EMA ($0.62), the XRP/USDT pair could drop to the uptrend line. A strong rebound off this level will suggest that the range-bound action may continue for a few more days.
如果價格維持在 20 日均線(0.62 美元)下方,XRP/USDT 貨幣對可能會跌至上升趨勢線。從該水平強勁反彈將表明區間波動可能會持續數天。
The next trending move will likely begin on a break above $0.67 or drop below the uptrend line. Above $0.67, the pair could start a rally to the formidable hurdle at $0.74. On the downside, a break below the uptrend line could sink the pair to $0.52.
下一個趨勢走勢可能會在突破 0.67 美元或跌破上升趨勢線時開始。突破 0.67 美元後,該貨幣對可能會開始反彈至 0.74 美元的強大關口。下檔方面,跌破上升趨勢線可能導致該貨幣對跌至 0.52 美元。
Cardano (ADA) Price Analysis
卡爾達諾(ADA)價格分析
The long wick on Cardano’s March 26 candlestick suggests that the bears are trying to keep the price below $0.68.
卡爾達諾 3 月 26 日燭台上的長影線表明空頭正試圖將價格保持在 0.68 美元以下。
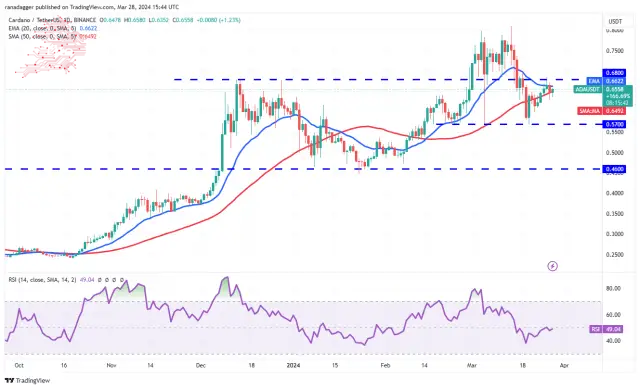
If the price remains below the moving averages, it will signal that the ADA/USDT pair could swing between $0.57 and $0.68 for a while. The flattening 20-day EMA ($0.66) and the RSI near the midpoint suggest a consolidation in the near term.
如果價格仍低於移動平均線,則表示 ADA/USDT 貨幣對可能會在 0.57 美元至 0.68 美元之間波動一段時間。趨平的 20 日均線(0.66 美元)和 RSI 接近中點表示近期將出現盤整。
However, if the price turns up from the current level and breaks above $0.70, it will indicate that the bulls are back in the game. The pair may then attempt a rally to $0.81, where the bears may pose a substantial challenge.
然而,如果價格從當前水平回升並突破 0.70 美元,則表明多頭重新回歸遊戲。然後,該貨幣對可能會嘗試反彈至 0.81 美元,空頭可能會在此構成重大挑戰。
Dogecoin (DOGE) Price Analysis
Dogecoin soared above the $0.19 to $0.21 overhead resistance zone on March 28, indicating aggressive bull buying.
狗狗幣 (DOGE) 價格分析 3 月 28 日,狗狗幣飆升至 0.19 美元至 0.21 美元上方阻力區上方,顯示多頭買盤積極。
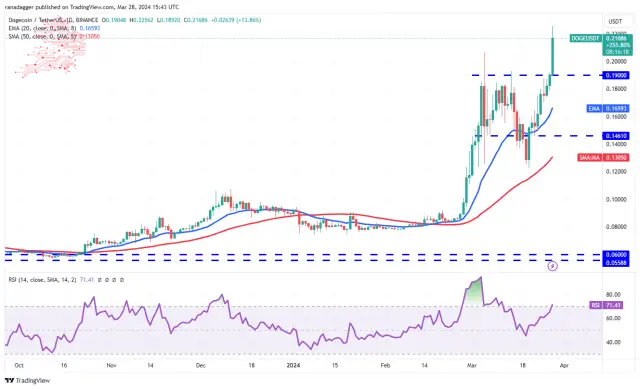
The upsloping moving averages and the RSI in the overbought zone suggest that the bulls are in command. There is a minor resistance at $0.23, but if buyers bulldoze their way through, the DOGE/USDT pair could rally to $0.30 and then to $0.35.
向上傾斜的移動平均線和超買區域的 RSI 表明多頭處於主導地位。 0.23 美元有一個小阻力,但如果買家全力突破,DOGE/USDT 貨幣對可能會反彈至 0.30 美元,然後升至 0.35 美元。
Bears must quickly pull the price back below $0.19 if they want to prevent the upside. If they do that, it will trap the aggressive bulls, resulting in long liquidation. The pair could then slump to the 20-day EMA ($0.16).
如果空頭想阻止上漲,他們必須迅速將價格拉回 0.19 美元以下。如果他們這樣做,就會困住激進的多頭,導致多頭清算。隨後該貨幣對可能會跌至 20 日均線(0.16 美元)。
Avalanche (AVAX) Price Analysis
雪崩 (AVAX) 價格分析
The past few days’ price action of the Avalanche has formed a pennant, indicating indecision between the bulls and the bears.
過去幾天雪崩的價格走勢已形成三角旗,顯示多頭和空頭之間猶豫不決。
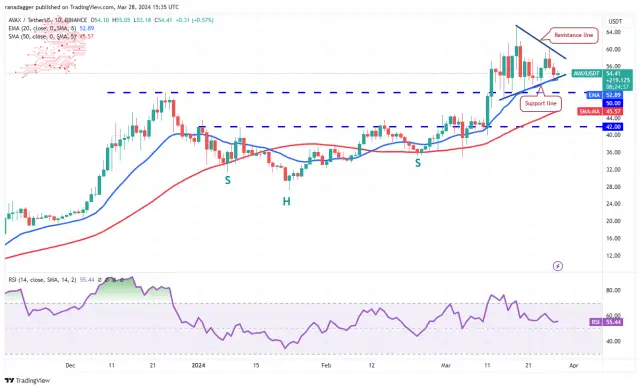
The upsloping 20-day EMA ($52) and the RSI in the positive territory indicate a slight advantage to buyers.
上升的 20 日均線(52 美元)和 RSI 處於正值區域表明買家略有優勢。
The bulls will try to defend the pennant’s support line and push the price toward the resistance line. A break and close above the pennant will signal that the AVAX/USDT pair could resume the uptrend. The pair may rise to $65 and later to the pattern target of $76.
多頭將試圖捍衛三角旗的支撐線,並將價格推向阻力線。突破並收於三角旗上方將表明 AVAX/USDT 貨幣對可能會恢復上升趨勢。該貨幣對可能會升至 65 美元,隨後升至 76 美元的形態目標。
Alternatively, if the price breaks below the pennant, it will suggest that the bears have overpowered the bulls. Strong support is at $50, but if this level gives way, the pair could tumble to the 50-day SMA ($45).
或者,如果價格跌破三角旗,則表示空頭已經壓倒了多頭。強勁支撐位於 50 美元,但如果該水平失守,該貨幣對可能會跌至 50 日移動平均線(45 美元)。
Shiba Inu (SHIB) Price Analysis
Shiba Inu’s recovery climbed above the resistance line on March 26, indicating that the selling pressure is reducing.
柴犬 (SHIB) 價格分析 3 月 26 日,柴犬的復甦爬上阻力線,顯示拋售壓力正在減輕。
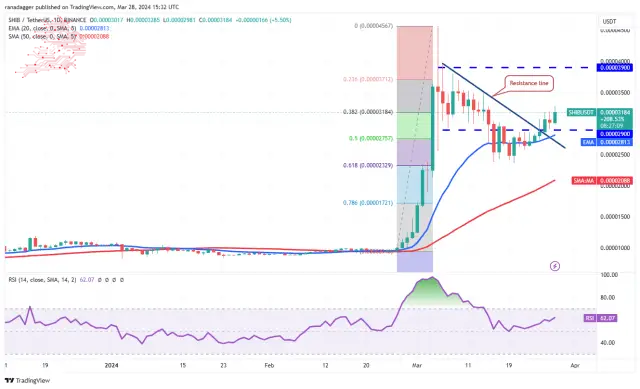
The SHIB/USDT pair will likely rise to $0.000035, where the bears are again expected to mount a strong defence. A break above this level could open the doors for a rise to $0.000039.
SHIB/USDT 貨幣對可能會上漲至 0.000035 美元,預計空頭將再次發動強有力的防禦。突破該水平可能為上漲至 0.000039 美元打開大門。
This optimistic view will be invalidated soon if the price turns down and breaks below the 20-day EMA ($0.000028). If that happens, it will suggest that the break above the resistance line may have been a bull trap. The pair may drop to the 50-day SMA ($0.000021).
如果價格下跌並跌破 20 日均線(0.000028 美元),這種樂觀看法很快就會失效。如果發生這種情況,則表示突破阻力線可能是牛市陷阱。該貨幣對可能會跌至 50 日移動平均線(0.000021 美元)。
Toncoin (TON) Price Analysis
Toncoin (TON) is correcting in an uptrend, but the pullback is finding support at the 38.2% Fibonacci retracement level of $4.78, signalling to buy on dips.
Toncoin (TON) 價格分析 Toncoin (TON) 在上升趨勢中進行修正,但回調在 4.78 美元的 38.2% 斐波那契回撤位找到支撐,表明逢低買入。
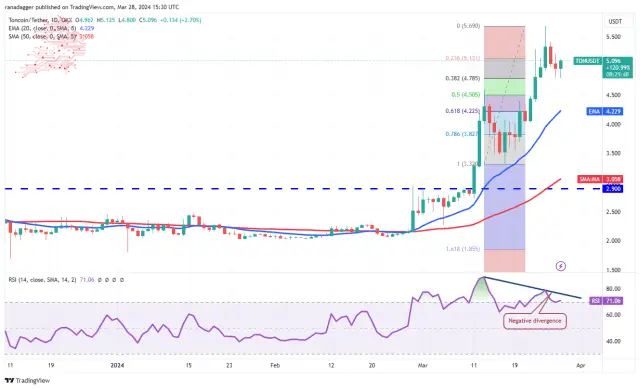
The upsloping moving averages suggest an advantage to the bulls, but the developing negative divergence on the RSI points to a possible consolidation or correction in the short term. If the price turns down and slips below $4.78, it will indicate selling on rallies. The TON/USDT pair could sink to the 20-day EMA ($4.22).
向上傾斜的移動平均線表示多頭具有優勢,但 RSI 的負背離表示短期內可能出現盤整或調整。如果價格下跌並跌破 4.78 美元,則表示逢高拋售。 TON/USDT 貨幣對可能會跌至 20 日均線(4.22 美元)。
Contrarily, if the rebound sustains, the rally could reach the stiff overhead resistance of $5.69. A break above this level will signal the start of the next leg of the uptrend toward $7.15.
相反,如果反彈持續,反彈可能會觸及 5.69 美元的上方阻力位。突破該水準將標誌著下一階段上漲趨勢的開始,朝向 7.15 美元。
Source – Rakesh Upadhyay
來源——Rakesh Upadhyay
Source: https://thebittimes.com/latest-market-overview-28th-mar-btc-eth-bnb-sol-xrp-ada-doge-avax-shib-ton-tbt86096.html
資料來源:https://thebittimes.com/latest-market-overview-28th-mar-btc-eth-bnb-sol-xrp-ada-doge-avax-shib-ton-tbt86096.html
 CFN
CFN Crypto Daily™
 DogeHome
 Crypto Daily™
 TheCoinrise Media
 Crypto Daily™
 DogeHome
 ETHNews
 Crypto Daily™


