


Bitcoin’s (BTC) price has surged past the $38,000 mark, suggesting the potential for an upward rally. The positive sentiment and sustained bullish pressure were evident as Bitcoin breached the critical resistance level on November 24th. Adrian Przelozny, CEO of Independent Reserve, expressed optimism, foreseeing a promising outlook for the next two years. He anticipates increased market activity in early 2024.
El precio de Bitcoin (BTC) ha superado la marca de los 38.000 dólares, lo que sugiere la posibilidad de un repunte al alza. El sentimiento positivo y la presión alcista sostenida fueron evidentes cuando Bitcoin superó el nivel de resistencia crítico el 24 de noviembre. Adrian Przelozny, director general de Independent Reserve, se mostró optimista y previó perspectivas prometedoras para los próximos dos años. Anticipa una mayor actividad del mercado a principios de 2024.
Two significant factors driving the cryptocurrency market in the coming year include the Bitcoin halving scheduled for April and pending applications for a spot exchange-traded fund. Some of these ETF applications face a decision deadline in January. With these significant events on the horizon, Bitcoin will likely attract buyers even during price corrections.
Dos factores importantes que impulsarán el mercado de las criptomonedas en el próximo año incluyen la reducción a la mitad de Bitcoin programada para abril y las solicitudes pendientes para un fondo cotizado en bolsa al contado. Algunas de estas solicitudes de ETF tienen como fecha límite de decisión en enero. Con estos importantes acontecimientos en el horizonte, es probable que Bitcoin atraiga compradores incluso durante las correcciones de precios.
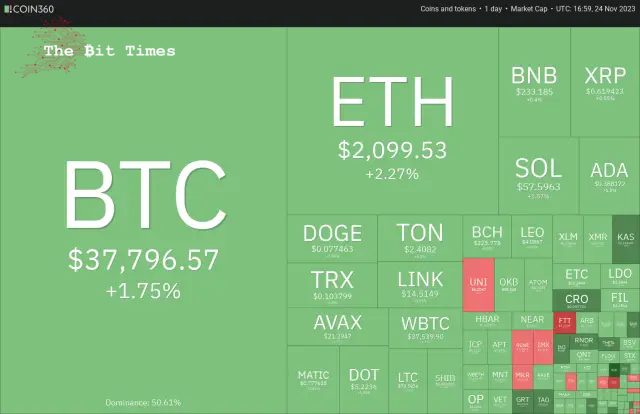
Analysts expect a retracement from $40,000 in the near term. That could be one of the reasons why Cathie Wood’s investment firm, ARK Invest, has been gradually selling into strength. The firm sold about 700,000 shares of the Grayscale Bitcoin Trust (GBTC) over the past month, but it is worth noting that ARK still holds more than 4.3 million GBTC shares.
Los analistas esperan un retroceso desde los 40.000 dólares en el corto plazo. Ésa podría ser una de las razones por las que la empresa de inversión de Cathie Wood, ARK Invest, se ha ido fortaleciendo gradualmente. La empresa vendió alrededor de 700.000 acciones de Grayscale Bitcoin Trust (GBTC) durante el mes pasado, pero vale la pena señalar que ARK todavía posee más de 4,3 millones de acciones de GBTC.
Could crypto traders bulldoze their way through the overhead resistance levels in Bitcoin and major altcoins? What are the critical levels to watch out for?
¿Podrían los comerciantes de criptomonedas abrirse camino a través de los niveles de resistencia superiores de Bitcoin y las principales altcoins? ¿Cuáles son los niveles críticos a tener en cuenta?
Let’s analyze the charts of the top 10 cryptocurrencies to find out.
Analicemos los gráficos de las 10 principales criptomonedas para descubrirlo.
Bitcoin (BTC) price analysis
Análisis de precios de Bitcoin (BTC)
Bitcoin pierced the stiff resistance of $37,980 on November 24th, but the bulls are struggling to sustain the breakout. This suggests that the bears are vigorously guarding the level.
Bitcoin atravesó la dura resistencia de 37.980 dólares el 24 de noviembre, pero los alcistas están luchando por mantener la ruptura. Esto sugiere que los bajistas están protegiendo vigorosamente el nivel.
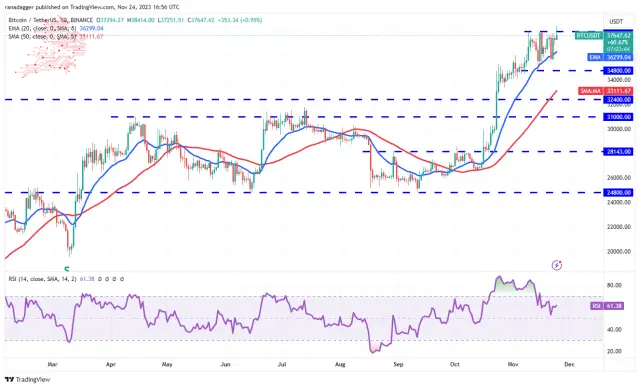
Both moving averages are sloping up, and the relative strength index (RSI) is above 61, indicating that the path of least resistance is to the upside. If buyers maintain the price above $37,980, the BTC/USDT pair could reach $40,000.
Ambos promedios móviles tienen pendiente ascendente y el índice de fuerza relativa (RSI) está por encima de 61, lo que indica que el camino de menor resistencia es al alza. Si los compradores mantienen el precio por encima de $37,980, el par BTC/USDT podría alcanzar los $40,000.
This level may again witness a tough battle between the bulls and the bears, but if the buyers prevail, the pair could skyrocket to $48,000. Time is running out for the bears. They must sink the price below the 20-day EMA if they want to weaken the momentum. The short-term trend will turn negative below $34,800.
Este nivel puede volver a ser testigo de una dura batalla entre los alcistas y los bajistas, pero si los compradores prevalecen, el par podría dispararse a 48.000 dólares. A los osos se les acaba el tiempo. Deben hundir el precio por debajo de la EMA de 20 días si quieren debilitar el impulso. La tendencia a corto plazo se volverá negativa por debajo de 34.800 dólares.
Ether (ETH) price analysis
Análisis de precios de éter (ETH)
The bulls pushed Ether above the resistance line on November 22nd, suggesting the start of the next leg of the up-move.
Los alcistas empujaron al Ether por encima de la línea de resistencia el 22 de noviembre, lo que sugiere el inicio del siguiente tramo del movimiento alcista.
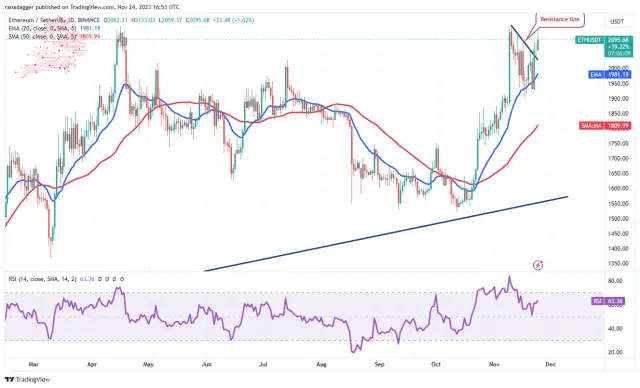
The bears tried to pull the price back below the resistance line on November 23rd, but the bulls held their ground. This suggests that the bulls try to flip the resistance line into support. The ETH/USDT pair could start a northward march toward $2,200 if they succeed.
Los bajistas intentaron hacer que el precio volviera a estar por debajo de la línea de resistencia el 23 de noviembre, pero los alcistas se mantuvieron firmes. Esto sugiere que los alcistas intentan convertir la línea de resistencia en soporte. El par ETH/USDT podría iniciar una marcha hacia el norte hacia los $2200 si tiene éxito.
This level may act as a formidable resistance again, but if bulls overcome it, the pair will complete a large ascending triangle pattern. That could open the gates for a potential rally to the pattern target of $3,400.
Este nivel puede volver a actuar como una resistencia formidable, pero si los alcistas lo superan, el par completará un gran patrón de triángulo ascendente. Eso podría abrir las puertas a un posible repunte hasta el objetivo del patrón de 3.400 dólares.
This bullish view will be invalidated soon if the price turns down and plummets below the vital support at $1,900.
Esta visión alcista quedará invalidada pronto si el precio baja y cae por debajo del soporte vital de 1.900 dólares.
BNB price analysis
Análisis de precios de BNB
BNB saltó por encima de los 235 dólares el 22 de noviembre, pero los alcistas no pudieron superar el obstáculo en la EMA de 20 días (239 dólares). Esto sugiere que los bajistas están tratando de tomar el control.
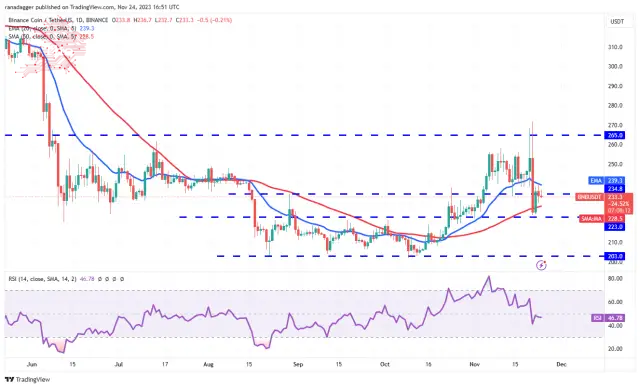
The 20-day EMA has started to turn down, and the RSI is just below the midpoint, indicating a minor advantage to the bears. The short-term trend will turn negative on a break and close below the crucial support at $223. That could clear the path for a fall to $203.
La EMA de 20 días ha comenzado a bajar y el RSI está justo por debajo del punto medio, lo que indica una pequeña ventaja para los bajistas. La tendencia a corto plazo se volverá negativa en caso de una ruptura y cerrará por debajo del soporte crucial de 223 dólares. Eso podría despejar el camino para una caída a 203 dólares.
Bulls must push and sustain the price above the 20-day EMA if they want to prevent the downside. The BNB/USDT pair may spend more time between $223 and $265.
Los alcistas deben empujar y mantener el precio por encima de la EMA de 20 días si quieren evitar la caída. El par BNB/USDT puede pasar más tiempo entre $223 y $265.
XRP price analysis
The bulls are trying to shove XRP above the 20-day EMA ($0.62), which suggests strong buying at lower levels.
Análisis de precios de XRP Los alcistas están tratando de empujar a XRP por encima de la EMA de 20 días (USD 0,62), lo que sugiere fuertes compras en niveles más bajos.
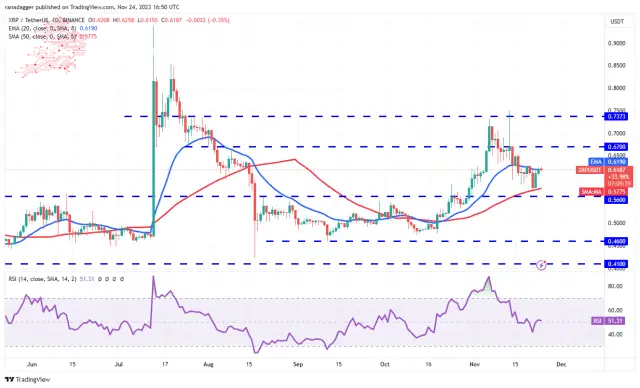
The 20-day EMA has flattened out, and the RSI is near the midpoint, indicating range-bound action in the short term. The XRP/USDT pair may swing between $0.56 and $0.74 for a few days.
La EMA de 20 días se ha aplanado y el RSI está cerca del punto medio, lo que indica una acción dentro del rango en el corto plazo. El par XRP/USDT puede oscilar entre $0,56 y $0,74 durante unos días.
If the price rises and sustains above the 20-day EMA, the pair could gradually climb to $0.67 and then to $0.74. Buyers must overcome this hurdle to indicate the start of a new up-move.
Si el precio sube y se mantiene por encima de la EMA de 20 días, el par podría subir gradualmente a 0,67 dólares y luego a 0,74 dólares. Los compradores deben superar este obstáculo para indicar el inicio de un nuevo movimiento ascendente.
Conversely, if the price turns down from the current level and breaks below $0.56, it will signal the start of a sharper correction to $0.46.
Por el contrario, si el precio baja del nivel actual y cae por debajo de 0,56 dólares, señalará el inicio de una corrección más pronunciada hasta 0,46 dólares.
Solana (SOL) price analysis
Solana has been trying to break above the $59 resistance for the past two days, but the bears have held their ground. A minor positive in favour of the bulls is that they have not ceded ground to the bears.
Análisis de precios de Solana (SOL) Solana ha estado intentando superar la resistencia de 59 dólares durante los últimos dos días, pero los bajistas se han mantenido firmes. Un pequeño aspecto positivo a favor de los alcistas es que no han cedido terreno a los bajistas.
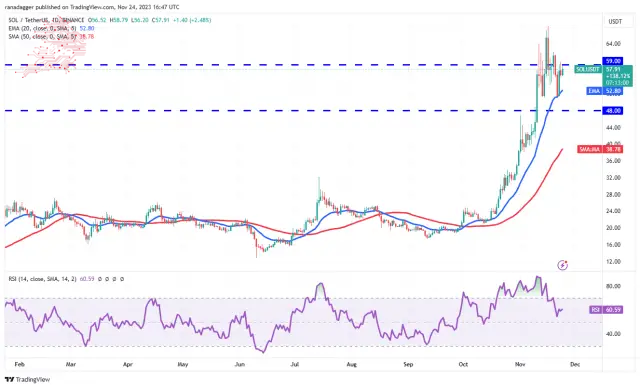
The rising 20-day EMA ($52.80) and the RSI in the positive territory suggest that bulls have the upper hand. That enhances the prospects of a rally above the overhead resistance. If that happens, the SOL/USDT pair could ascend to $68.
La EMA de 20 días en ascenso ($52,80) y el RSI en territorio positivo sugieren que los alcistas tienen la ventaja. Eso mejora las perspectivas de un repunte por encima de la resistencia superior. Si eso sucede, el par SOL/USDT podría ascender a $68.
Contrary to this assumption, the bears will strive to tug the pair below the 20-day EMA if the price turns down from the current level. If they can pull it off, the pair may drop to $48, where buyers will likely step in.
Contrariamente a esta suposición, los bajistas se esforzarán por llevar el par por debajo de la EMA de 20 días si el precio baja del nivel actual. Si pueden lograrlo, el par puede caer a $48, donde probablemente intervendrán los compradores.
Cardano (ADA) price analysis
Cardano has been swinging above and below the $0.38 level for the past few days. This shows uncertainty about the next directional move between the bulls and the bears.
Análisis de precios de Cardano (ADA) Cardano ha estado oscilando por encima y por debajo del nivel de 0,38 dólares durante los últimos días. Esto muestra incertidumbre sobre el próximo movimiento direccional entre alcistas y bajistas.
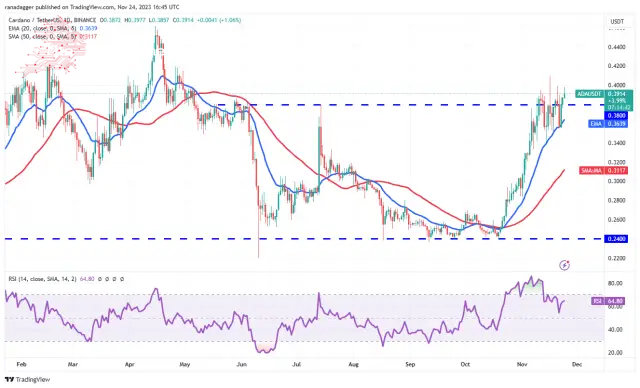
The upsloping moving averages and the RSI in the positive territory indicate that the bulls have a slight edge. If the price rises above $0.40, it will signal the start of a new up-move to $0.42 and later to $0.46.
Los promedios móviles ascendentes y el RSI en territorio positivo indican que los alcistas tienen una ligera ventaja. Si el precio sube por encima de 0,40 dólares, señalará el inicio de un nuevo movimiento alcista a 0,42 dólares y luego a 0,46 dólares.
Bears must yank the price below $0.34 if they want to trap the aggressive bulls. That may result in a fall to the 50-day SMA ($0.31). The ADA/USDT pair may oscillate between $0.24 and $0.38 for longer.
Los bajistas deben bajar el precio por debajo de 0,34 dólares si quieren atrapar a los alcistas agresivos. Esto puede resultar en una caída a la SMA de 50 días ($0,31). El par ADA/USDT puede oscilar entre $0,24 y $0,38 por más tiempo.
Dogecoin (DOGE) price analysis
Dogecoin has maintained above the 20-day EMA ($0.08) for the past two days, but the rise lacks momentum. This indicates that bulls are cautious at higher levels.
Análisis de precios de Dogecoin (DOGE) Dogecoin se ha mantenido por encima de la EMA de 20 días ($0,08) durante los últimos dos días, pero el aumento carece de impulso. Esto indica que los alcistas son cautelosos en niveles más altos.
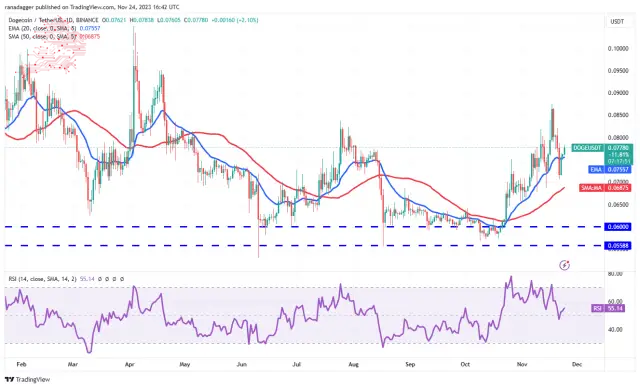
Buyers will have to propel the price above $0.08 to signal strength. The DOGE/USDT pair could surge toward the target objective of $0.10. This level may again witness a tough battle between the bulls and the bears.
Los compradores tendrán que impulsar el precio por encima de 0,08 dólares para señalar fuerza. El par DOGE/USDT podría subir hacia el objetivo de USD 0,10. Este nivel puede volver a ser testigo de una dura batalla entre alcistas y bajistas.
If the price turns down from $0.08, it will suggest that bears remain active at higher levels. The pair may then drop to the immediate support at $0.07. The flattish 20-day EMA and the RSI just above the midpoint do not give a clear advantage to the bulls or the bears.
Si el precio baja de 0,08 dólares, sugerirá que los bajistas permanecen activos en niveles más altos. Luego, el par puede caer hasta el soporte inmediato de 0,07 dólares. La EMA plana de 20 días y el RSI justo por encima del punto medio no dan una ventaja clara ni a los alcistas ni a los bajistas.
Toncoin (TON) price analysis
Buyers are trying to push Toncoin to the overhead resistance of $2.59. The repeated retest of a resistance level tends to weaken it.
Análisis de precios de Toncoin (TON) Los compradores están tratando de llevar a Toncoin a la resistencia superior de $ 2,59. La repetición repetida de un nivel de resistencia tiende a debilitarlo.
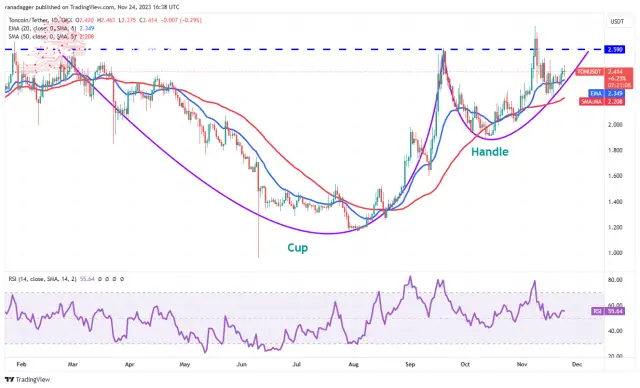
If bulls drive and sustain the price above the $2.59 to $2.77 resistance zone, it will complete a cup-and-handle pattern. That could start a new uptrend to $3.28 and, after that, to the pattern target of $4.03.
Si los alcistas impulsan y mantienen el precio por encima de la zona de resistencia de 2,59 a 2,77 dólares, se completará un patrón de copa y asa. Eso podría iniciar una nueva tendencia alcista hasta 3,28 dólares y, después de eso, hasta el objetivo del patrón de 4,03 dólares.
Alternatively, if the TON/USDT pair turns down from the overhead resistance, it will suggest that bears fiercely protect the level. That could result in a move down to the 50-day SMA ($2.20). A slide below this level will open the doors for a fall to $2 and $1.89.
Alternativamente, si el par TON/USDT cae desde la resistencia superior, sugerirá que los bajistas protegen ferozmente el nivel. Eso podría resultar en un movimiento hacia la SMA de 50 días ($2,20). Una caída por debajo de este nivel abrirá las puertas a una caída a 2 dólares y 1,89 dólares.
Chainlink (LINK) price analysis
Chainlink is facing selling at the downtrend line, as seen from the long wick on the November 23rd candlestick.
Análisis de precios de Chainlink (LINK) Chainlink se enfrenta a ventas en la línea de tendencia bajista, como se ve desde la mecha larga de la vela del 23 de noviembre.
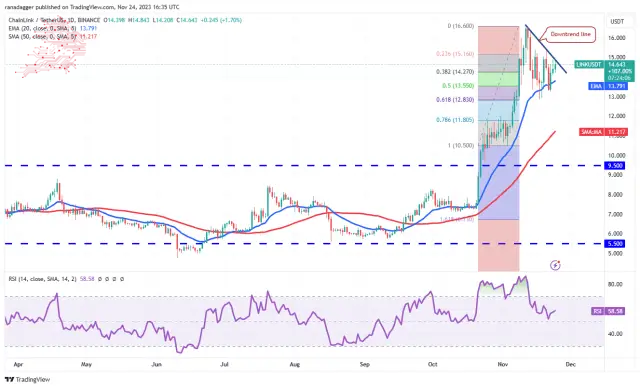
However, the bulls have not given up and have again pushed the price to the downtrend line. The cost is stuck between the downtrend line and the 61.8% Fibonacci retracement level of $12.83. This has resulted in a squeeze, likely resolving with a sharp move on either side.
Sin embargo, los alcistas no se dieron por vencidos y nuevamente empujaron el precio hacia la línea de tendencia bajista. El costo está atrapado entre la línea de tendencia bajista y el nivel de retroceso de Fibonacci del 61,8% de 12,83 dólares. Esto ha resultado en una contracción, que probablemente se resuelva con un movimiento brusco en ambos lados.
If the price surges above the downtrend line, the LINK/USDT pair may climb to $16.60 and $18.30. Instead, if the price turns down and plunges below $12.83, the decline could extend to the 50-day SMA ($11.21).
Si el precio sube por encima de la línea de tendencia bajista, el par LINK/USDT puede subir a USD 16,60 y USD 18,30. En cambio, si el precio baja y cae por debajo de USD 12,83, la caída podría extenderse a la SMA de 50 días (USD 11,21).
Avalanche (AVAX) price analysis
Avalanche has reached the overhead resistance at $22, a critical level to watch out for. The bears are expected to defend this level with vigour.
Análisis de precios de Avalanche (AVAX) Avalanche ha alcanzado la resistencia superior de 22 dólares, un nivel crítico al que hay que prestar atención. Se espera que los bajistas defiendan este nivel con vigor.
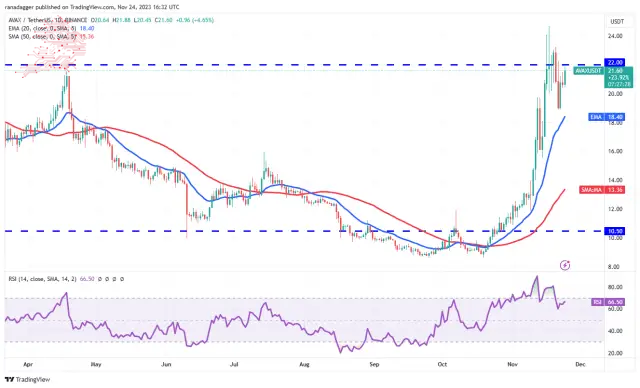
However, if bulls do not give up much ground from the current level, it will increase the likelihood of a break above $22. The pair may climb to $25, where the bears will likely mount a strong defence.
Sin embargo, si los alcistas no ceden mucho terreno desde el nivel actual, aumentará la probabilidad de una ruptura por encima de los 22 dólares. El par puede subir a $25, donde los bajistas probablemente montarán una fuerte defensa.
On the downside, the 20-day EMA ($18.40) remains critical to watch. If the price turns down and slips below this level, it will suggest the start of a deeper correction to $16. Such a move will indicate that the AVAX/USDT pair may spend more time between $10.50 and $22.
En el lado negativo, sigue siendo fundamental observar la EMA de 20 días (USD 18,40). Si el precio baja y cae por debajo de este nivel, sugerirá el inicio de una corrección más profunda hasta los 16 dólares. Tal movimiento indicará que el par AVAX/USDT puede pasar más tiempo entre USD 10,50 y USD 22.
Source – Rakesh Upadhyay
Fuente - Rakesh Upadhyay
Source: https://thebittimes.com/latest-market-overview-24th-nov-btc-eth-bnb-xrp-sol-ada-doge-ton-link-avax-tbt71575.html
Fuente: https://thebittimes.com/latest-market-overview-24th-nov-btc-eth-bnb-xrp-sol-ada-doge-ton-link-avax-tbt71575.html
 DogeHome
 Crypto News Land
 Crypto Daily™
 Crypto Intelligence
 Crypto Daily™
 CaptainAltcoin
 Thecryptoupdates
 Crypto Intelligence
 CoinsProbe


