


Bitcoin’s (BTC) price has surged past the $38,000 mark, suggesting the potential for an upward rally. The positive sentiment and sustained bullish pressure were evident as Bitcoin breached the critical resistance level on November 24th. Adrian Przelozny, CEO of Independent Reserve, expressed optimism, foreseeing a promising outlook for the next two years. He anticipates increased market activity in early 2024.
비트코인(BTC) 가격이 38,000달러를 돌파하며 상승세를 탈 가능성이 있음을 시사했습니다. 비트코인이 11월 24일 임계 저항 수준을 돌파하면서 긍정적인 정서와 지속적인 강세 압력이 분명해졌습니다. Independent Reserve의 CEO인 Adrian Przelozny는 향후 2년간의 전망을 유망하게 내다보며 낙관적인 입장을 표명했습니다. 그는 2024년 초에 시장 활동이 증가할 것으로 예상합니다.
Two significant factors driving the cryptocurrency market in the coming year include the Bitcoin halving scheduled for April and pending applications for a spot exchange-traded fund. Some of these ETF applications face a decision deadline in January. With these significant events on the horizon, Bitcoin will likely attract buyers even during price corrections.
내년에 암호화폐 시장을 이끄는 두 가지 중요한 요인에는 4월로 예정된 비트코인 반감기와 현물 상장지수펀드 신청 대기가 포함됩니다. 이들 ETF 신청 중 일부는 1월 결정 마감일에 직면해 있습니다. 이러한 중요한 이벤트가 임박하면 비트코인은 가격 조정 중에도 구매자를 끌어들일 가능성이 높습니다.
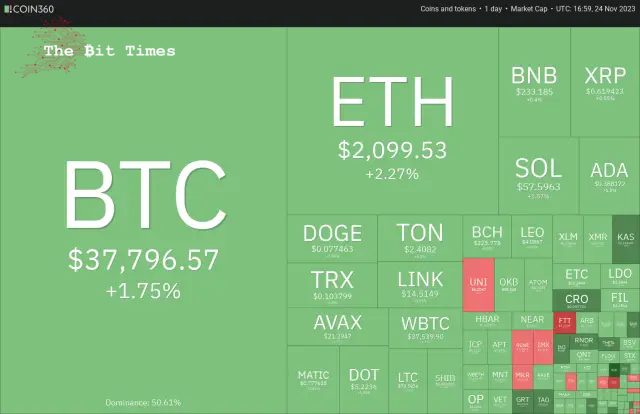
Analysts expect a retracement from $40,000 in the near term. That could be one of the reasons why Cathie Wood’s investment firm, ARK Invest, has been gradually selling into strength. The firm sold about 700,000 shares of the Grayscale Bitcoin Trust (GBTC) over the past month, but it is worth noting that ARK still holds more than 4.3 million GBTC shares.
Could crypto traders bulldoze their way through the overhead resistance levels in Bitcoin and major altcoins? What are the critical levels to watch out for?
암호화폐 거래자들이 비트코인과 주요 알트코인의 오버헤드 저항 수준을 돌파할 수 있을까요? 주의해야 할 중요한 수준은 무엇입니까?
Let’s analyze the charts of the top 10 cryptocurrencies to find out.
알아보기 위해 상위 10개 암호화폐의 차트를 분석해 보겠습니다.
Bitcoin (BTC) price analysis
Bitcoin pierced the stiff resistance of $37,980 on November 24th, but the bulls are struggling to sustain the breakout. This suggests that the bears are vigorously guarding the level.
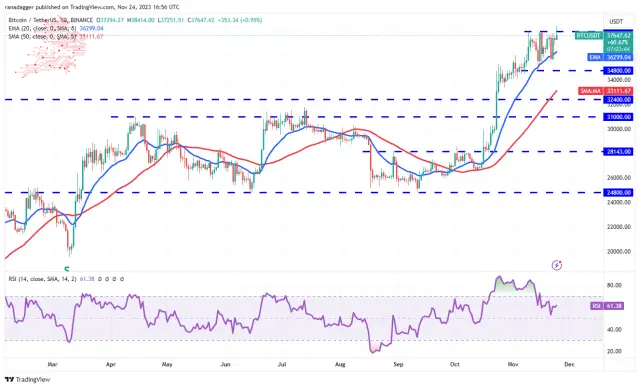
Both moving averages are sloping up, and the relative strength index (RSI) is above 61, indicating that the path of least resistance is to the upside. If buyers maintain the price above $37,980, the BTC/USDT pair could reach $40,000.
두 이동평균선 모두 우상향하고 상대강도지수(RSI)가 61을 넘어 저항이 가장 적은 경로가 상승세임을 나타냅니다. 구매자가 $37,980 이상의 가격을 유지하면 BTC/USDT 쌍은 $40,000에 도달할 수 있습니다.
This level may again witness a tough battle between the bulls and the bears, but if the buyers prevail, the pair could skyrocket to $48,000. Time is running out for the bears. They must sink the price below the 20-day EMA if they want to weaken the momentum. The short-term trend will turn negative below $34,800.
Ether (ETH) price analysis
The bulls pushed Ether above the resistance line on November 22nd, suggesting the start of the next leg of the up-move.
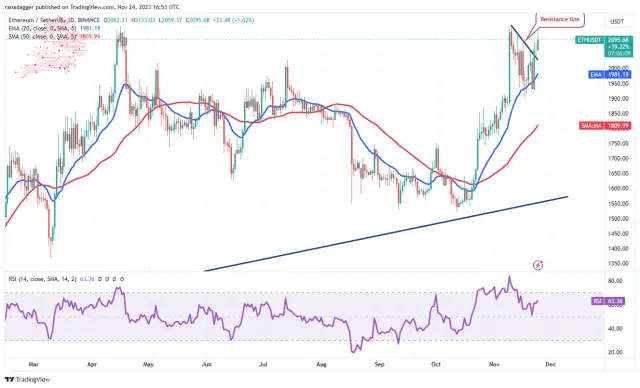
The bears tried to pull the price back below the resistance line on November 23rd, but the bulls held their ground. This suggests that the bulls try to flip the resistance line into support. The ETH/USDT pair could start a northward march toward $2,200 if they succeed.
하락세는 11월 23일 가격을 저항선 아래로 되돌리려 했지만 상승세는 그 자리를 지켰습니다. 이는 상승세가 저항선을 지지선으로 바꾸려고 한다는 것을 의미합니다. ETH/USDT 쌍은 성공할 경우 $2,200를 향해 북쪽으로 행진을 시작할 수 있습니다.
This level may act as a formidable resistance again, but if bulls overcome it, the pair will complete a large ascending triangle pattern. That could open the gates for a potential rally to the pattern target of $3,400.
이 수준은 다시 강력한 저항으로 작용할 수 있지만 상승세가 이를 극복하면 쌍은 큰 상승 삼각형 패턴을 완성하게 됩니다. 이는 3,400달러의 패턴 목표에 대한 잠재적인 반등의 문을 열 수 있습니다.
This bullish view will be invalidated soon if the price turns down and plummets below the vital support at $1,900.
BNB price analysis
BNB 가격 분석
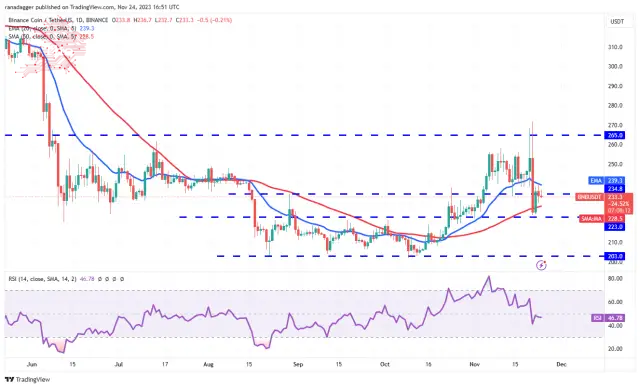
The 20-day EMA has started to turn down, and the RSI is just below the midpoint, indicating a minor advantage to the bears. The short-term trend will turn negative on a break and close below the crucial support at $223. That could clear the path for a fall to $203.
Bulls must push and sustain the price above the 20-day EMA if they want to prevent the downside. The BNB/USDT pair may spend more time between $223 and $265.
XRP price analysis
The bulls are trying to shove XRP above the 20-day EMA ($0.62), which suggests strong buying at lower levels.
XRP 가격 분석 강세론자들은 XRP를 20일 EMA(0.62달러) 위로 끌어올리려고 노력하고 있으며, 이는 더 낮은 수준에서 강력한 매수를 시사합니다.
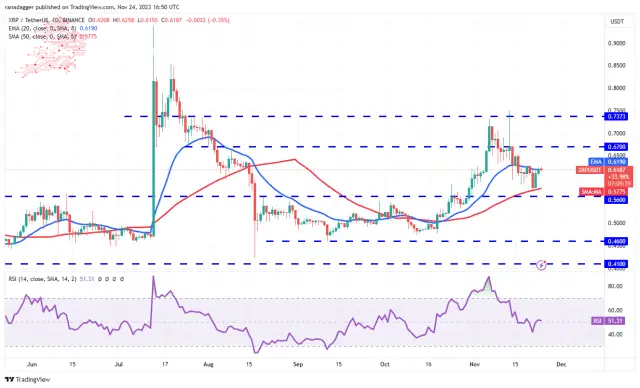
The 20-day EMA has flattened out, and the RSI is near the midpoint, indicating range-bound action in the short term. The XRP/USDT pair may swing between $0.56 and $0.74 for a few days.
If the price rises and sustains above the 20-day EMA, the pair could gradually climb to $0.67 and then to $0.74. Buyers must overcome this hurdle to indicate the start of a new up-move.
Conversely, if the price turns down from the current level and breaks below $0.56, it will signal the start of a sharper correction to $0.46.
반대로 가격이 현재 수준에서 하락하여 $0.56 아래로 떨어지면 $0.46으로 더 급격한 조정이 시작된다는 신호입니다.
Solana (SOL) price analysis
Solana has been trying to break above the $59 resistance for the past two days, but the bears have held their ground. A minor positive in favour of the bulls is that they have not ceded ground to the bears.
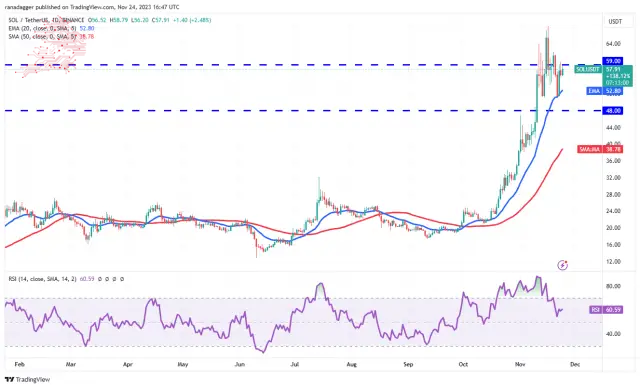
The rising 20-day EMA ($52.80) and the RSI in the positive territory suggest that bulls have the upper hand. That enhances the prospects of a rally above the overhead resistance. If that happens, the SOL/USDT pair could ascend to $68.
상승하는 20일 EMA($52.80)와 플러스 영역의 RSI는 황소가 우위를 점하고 있음을 시사합니다. 이는 머리 위 저항선 위에서 반등할 가능성을 높여줍니다. 그렇게 되면 SOL/USDT 쌍이 68달러까지 오를 수 있습니다.
Contrary to this assumption, the bears will strive to tug the pair below the 20-day EMA if the price turns down from the current level. If they can pull it off, the pair may drop to $48, where buyers will likely step in.
Cardano (ADA) price analysis
Cardano has been swinging above and below the $0.38 level for the past few days. This shows uncertainty about the next directional move between the bulls and the bears.
Cardano(ADA) 가격 분석 Cardano는 지난 며칠 동안 0.38달러 수준을 위아래로 움직이고 있습니다. 이는 상승세와 하락세 사이의 다음 방향 움직임에 대한 불확실성을 보여줍니다.
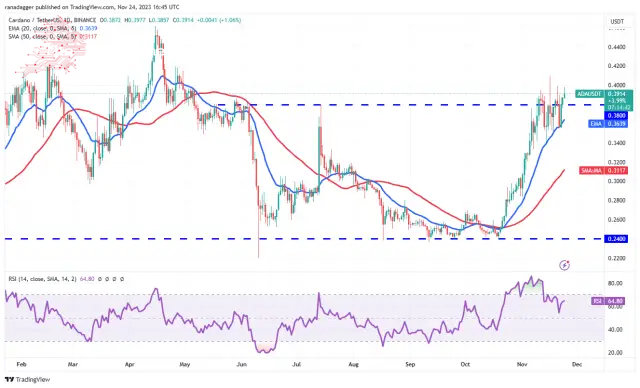
The upsloping moving averages and the RSI in the positive territory indicate that the bulls have a slight edge. If the price rises above $0.40, it will signal the start of a new up-move to $0.42 and later to $0.46.
상승하는 이동 평균과 양수 영역의 RSI는 상승세가 약간 우위에 있음을 나타냅니다. 가격이 $0.40 이상으로 상승하면 $0.42로, 나중에는 $0.46으로 새로운 상승이 시작된다는 신호가 됩니다.
Bears must yank the price below $0.34 if they want to trap the aggressive bulls. That may result in a fall to the 50-day SMA ($0.31). The ADA/USDT pair may oscillate between $0.24 and $0.38 for longer.
Dogecoin (DOGE) price analysis
Dogecoin has maintained above the 20-day EMA ($0.08) for the past two days, but the rise lacks momentum. This indicates that bulls are cautious at higher levels.
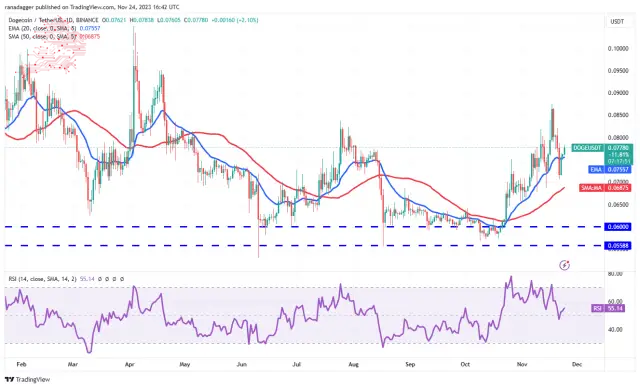
Buyers will have to propel the price above $0.08 to signal strength. The DOGE/USDT pair could surge toward the target objective of $0.10. This level may again witness a tough battle between the bulls and the bears.
구매자는 강세를 신호하기 위해 가격을 0.08달러 이상으로 끌어 올려야 합니다. DOGE/USDT 쌍은 목표 목표인 0.10달러를 향해 급등할 수 있습니다. 이 수준에서는 다시 황소와 곰 사이의 힘든 싸움을 목격할 수 있습니다.
If the price turns down from $0.08, it will suggest that bears remain active at higher levels. The pair may then drop to the immediate support at $0.07. The flattish 20-day EMA and the RSI just above the midpoint do not give a clear advantage to the bulls or the bears.
Toncoin (TON) price analysis
Buyers are trying to push Toncoin to the overhead resistance of $2.59. The repeated retest of a resistance level tends to weaken it.
Toncoin(TON) 가격 분석 구매자는 Toncoin을 $2.59의 오버헤드 저항까지 밀어붙이려고 노력하고 있습니다. 저항 수준을 반복적으로 다시 테스트하면 저항 수준이 약화되는 경향이 있습니다.
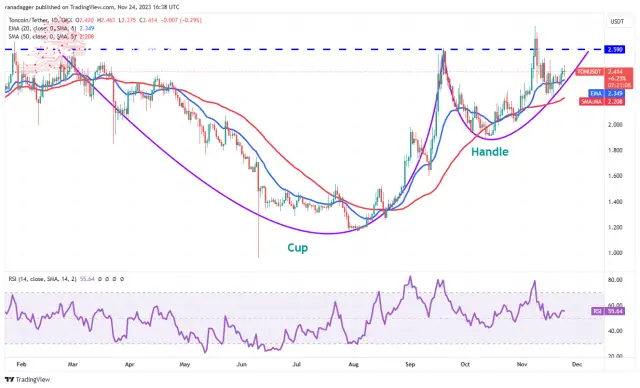
If bulls drive and sustain the price above the $2.59 to $2.77 resistance zone, it will complete a cup-and-handle pattern. That could start a new uptrend to $3.28 and, after that, to the pattern target of $4.03.
Alternatively, if the TON/USDT pair turns down from the overhead resistance, it will suggest that bears fiercely protect the level. That could result in a move down to the 50-day SMA ($2.20). A slide below this level will open the doors for a fall to $2 and $1.89.
또는 TON/USDT 쌍이 머리 위 저항에서 하락하는 경우 하락세가 치열하게 수준을 보호한다는 의미입니다. 이로 인해 50일 SMA($2.20)로 낮아질 수 있습니다. 이 수준 아래로 미끄러지면 $2와 $1.89로 하락할 수 있는 문이 열릴 것입니다.
Chainlink (LINK) price analysis
Chainlink is facing selling at the downtrend line, as seen from the long wick on the November 23rd candlestick.
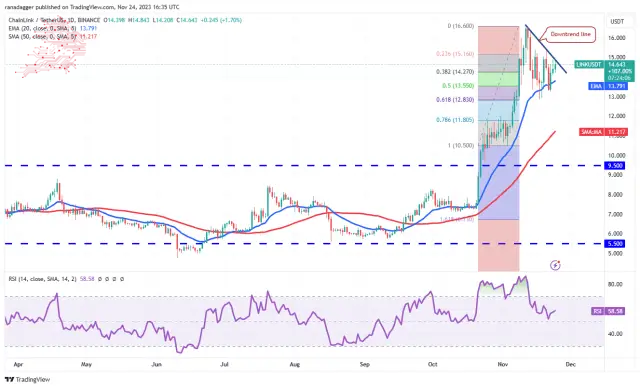
However, the bulls have not given up and have again pushed the price to the downtrend line. The cost is stuck between the downtrend line and the 61.8% Fibonacci retracement level of $12.83. This has resulted in a squeeze, likely resolving with a sharp move on either side.
그러나 상승세력은 포기하지 않고 가격을 다시 하락 추세선으로 밀었습니다. 가격은 하락 추세선과 61.8% 피보나치 되돌림 수준인 $12.83 사이에 머물러 있습니다. 이로 인해 압박이 발생했으며 양쪽에서 날카로운 움직임으로 해결될 가능성이 높습니다.
If the price surges above the downtrend line, the LINK/USDT pair may climb to $16.60 and $18.30. Instead, if the price turns down and plunges below $12.83, the decline could extend to the 50-day SMA ($11.21).
가격이 하락 추세선 위로 급등하면 LINK/USDT 쌍은 $16.60와 $18.30까지 오를 수 있습니다. 대신 가격이 하락하여 $12.83 아래로 떨어지면 하락폭은 50일 SMA($11.21)까지 확대될 수 있습니다.
Avalanche (AVAX) price analysis
Avalanche has reached the overhead resistance at $22, a critical level to watch out for. The bears are expected to defend this level with vigour.
Avalanche(AVAX) 가격 분석 Avalanche는 주의해야 할 중요한 수준인 $22의 오버헤드 저항에 도달했습니다. 곰들은 이 수준을 적극적으로 방어할 것으로 예상됩니다.
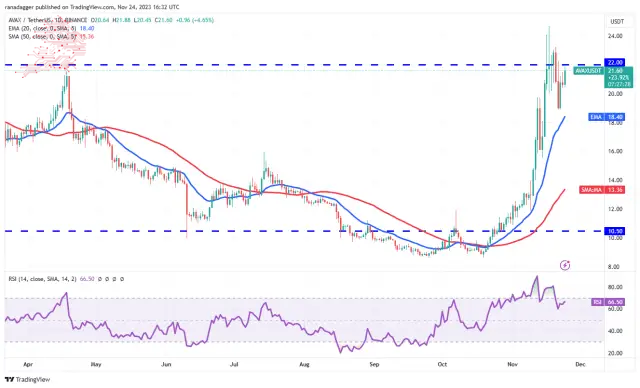
However, if bulls do not give up much ground from the current level, it will increase the likelihood of a break above $22. The pair may climb to $25, where the bears will likely mount a strong defence.
그러나 황소가 현재 수준에서 많은 기반을 포기하지 않으면 22달러 이상으로 돌파할 가능성이 높아집니다. 이 쌍은 $25까지 오를 수 있으며, 여기서 약세는 강력한 방어력을 발휘할 것입니다.
On the downside, the 20-day EMA ($18.40) remains critical to watch. If the price turns down and slips below this level, it will suggest the start of a deeper correction to $16. Such a move will indicate that the AVAX/USDT pair may spend more time between $10.50 and $22.
Source – Rakesh Upadhyay
출처 – Rakesh Upadhyay
Source: https://thebittimes.com/latest-market-overview-24th-nov-btc-eth-bnb-xrp-sol-ada-doge-ton-link-avax-tbt71575.html
출처: https://thebittimes.com/latest-market-overview-24th-nov-btc-eth-bnb-xrp-sol-ada-doge-ton-link-avax-tbt71575.html
 Crypto News Land
 DogeHome
 Coincu
 Coin Edition
 Coin_Gabbar
 Coincu
 BlockchainReporter


