


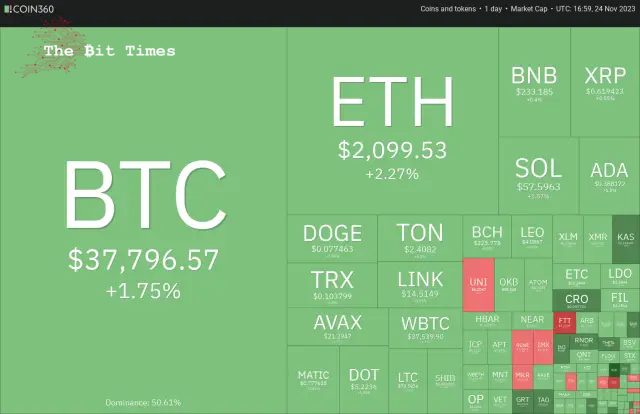
Bitcoin’s (BTC) price has surged past the $38,000 mark, suggesting the potential for an upward rally. The positive sentiment and sustained bullish pressure were evident as Bitcoin breached the critical resistance level on November 24th. Adrian Przelozny, CEO of Independent Reserve, expressed optimism, foreseeing a promising outlook for the next two years. He anticipates increased market activity in early 2024.
ビットコイン(BTC)の価格は3万8000ドルを超えて急騰しており、上昇相場の可能性を示唆している。 11月24日にビットコインが臨界抵抗線を突破したことから、ポジティブな感情と持続的な強気圧力は明らかだった。インディペンデント・リザーブのCEO、エイドリアン・プルゼロズニー氏は楽観的な見方を表明し、今後2年間の見通しは明るいと予想した。同氏は2024年初めに市場活動が活発化すると予想している。
Two significant factors driving the cryptocurrency market in the coming year include the Bitcoin halving scheduled for April and pending applications for a spot exchange-traded fund. Some of these ETF applications face a decision deadline in January. With these significant events on the horizon, Bitcoin will likely attract buyers even during price corrections.
来年の仮想通貨市場を牽引する2つの重要な要因としては、4月に予定されているビットコインの半減期と、スポットETFの申請が保留中であることが挙げられる。これらのETF申請の中には、1月に決定期限を迎えるものもある。これらの重要なイベントが目前に迫っているため、ビットコインは価格調整中でも買い手を引きつける可能性が高い。
Analysts expect a retracement from $40,000 in the near term. That could be one of the reasons why Cathie Wood’s investment firm, ARK Invest, has been gradually selling into strength. The firm sold about 700,000 shares of the Grayscale Bitcoin Trust (GBTC) over the past month, but it is worth noting that ARK still holds more than 4.3 million GBTC shares.
アナリストは、短期的には 40,000 ドルからのリトレースメントを予想しています。それが、キャシー ウッドの投資会社 ARK Invest が徐々に勢いを増している理由の 1 つである可能性があります。同社は先月、グレースケール・ビットコイン・トラスト(GBTC)の約70万株を売却したが、ARKが依然として430万株以上のGBTC株を保有していることは注目に値する。
Could crypto traders bulldoze their way through the overhead resistance levels in Bitcoin and major altcoins? What are the critical levels to watch out for?
仮想通貨トレーダーは、ビットコインや主要アルトコインの諸経費の抵抗レベルを強行突破できるでしょうか?注意すべき重要なレベルは何ですか?
Let’s analyze the charts of the top 10 cryptocurrencies to find out.
それを知るために、トップ 10 の仮想通貨のチャートを分析してみましょう。
Bitcoin (BTC) price analysis
ビットコイン(BTC)価格分析
Bitcoin pierced the stiff resistance of $37,980 on November 24th, but the bulls are struggling to sustain the breakout. This suggests that the bears are vigorously guarding the level.
ビットコインは11月24日に37,980ドルの厳しい抵抗線を突破したが、強気派はその突破を維持するのに苦労している。これは、クマがそのレベルを精力的に警備していることを示唆しています。
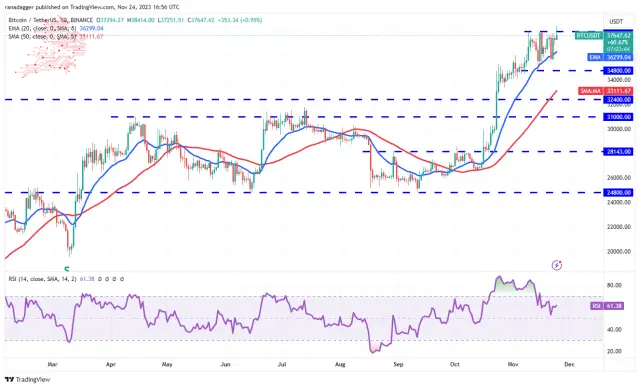
Both moving averages are sloping up, and the relative strength index (RSI) is above 61, indicating that the path of least resistance is to the upside. If buyers maintain the price above $37,980, the BTC/USDT pair could reach $40,000.
両方の移動平均は右肩上がりで、相対強度指数 (RSI) は 61 を上回っており、最も抵抗が少ない経路が上向きであることを示しています。買い手が37,980ドルを超える価格を維持すれば、BTC/USDTペアは40,000ドルに達する可能性があります。
This level may again witness a tough battle between the bulls and the bears, but if the buyers prevail, the pair could skyrocket to $48,000. Time is running out for the bears. They must sink the price below the 20-day EMA if they want to weaken the momentum. The short-term trend will turn negative below $34,800.
この水準でも再び強気派と弱気派の間の厳しい戦いが見られるかもしれないが、買い方が優勢であれば、このペアは4万8000ドルまで急騰する可能性がある。クマたちに残された時間は残りわずかです。勢いを弱めたい場合は、価格を20日間EMA以下に下げる必要があります。短期トレンドは34,800ドルを下回るとマイナスに転じるだろう。
Ether (ETH) price analysis
イーサ(ETH)価格分析
The bulls pushed Ether above the resistance line on November 22nd, suggesting the start of the next leg of the up-move.
強気派は11月22日にイーサをレジスタンスラインの上に押し上げ、次の上昇レグの開始を示唆しました。
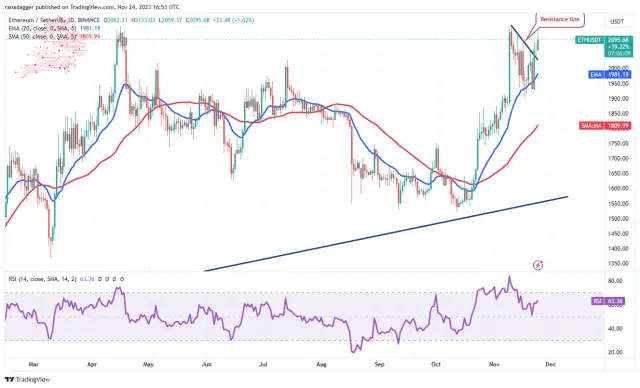
The bears tried to pull the price back below the resistance line on November 23rd, but the bulls held their ground. This suggests that the bulls try to flip the resistance line into support. The ETH/USDT pair could start a northward march toward $2,200 if they succeed.
弱気派は価格を11月23日の抵抗線以下に戻そうとしたが、強気派は踏みとどまった。これは、強気派がレジスタンスラインをサポートに反転させようとしていることを示唆しています。 ETH/USDTペアは、成功すれば2,200ドルに向けて北への行進を開始する可能性がある。
This level may act as a formidable resistance again, but if bulls overcome it, the pair will complete a large ascending triangle pattern. That could open the gates for a potential rally to the pattern target of $3,400.
このレベルは再び強力な抵抗として機能する可能性がありますが、強気派がそれを克服すれば、ペアは大きな上昇三角パターンを完成するでしょう。これにより、パターン目標である3,400ドルへの上昇の可能性への扉が開かれる可能性がある。
This bullish view will be invalidated soon if the price turns down and plummets below the vital support at $1,900.
価格が下落し、重要なサポートである1,900ドルを下回ると、この強気の見方はすぐに無効になるだろう。
BNB price analysis
BNB価格分析
BNBは11月22日に235ドルを超えましたが、強気派は20日間EMA(239ドル)の障害を克服できませんでした。これはクマが主導権を握ろうとしていることを示唆している。
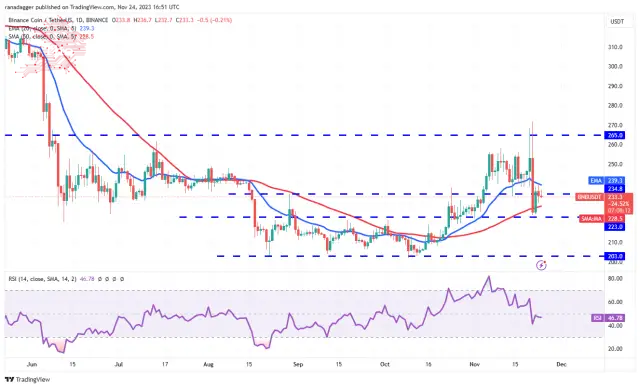
The 20-day EMA has started to turn down, and the RSI is just below the midpoint, indicating a minor advantage to the bears. The short-term trend will turn negative on a break and close below the crucial support at $223. That could clear the path for a fall to $203.
20日間EMAは下落し始めており、RSIは中間点のすぐ下にあり、弱気派がわずかに有利であることを示しています。短期トレンドはブレイクするとマイナスに転じ、重要なサポートである223ドルを下回って終了するだろう。そうなれば203ドルへの下落への道が開ける可能性がある。
Bulls must push and sustain the price above the 20-day EMA if they want to prevent the downside. The BNB/USDT pair may spend more time between $223 and $265.
強気派は、下値を防ぎたい場合、価格を20日間EMAを超えて押し上げ、維持する必要がある。 BNB/USDTペアは223ドルから265ドルの間でさらに時間を費やす可能性があります。
XRP price analysis
The bulls are trying to shove XRP above the 20-day EMA ($0.62), which suggests strong buying at lower levels.
XRP価格分析 強気派はXRPを20日間EMA(0.62ドル)以上に押し上げようとしており、これはより低いレベルでの強い買いを示唆しています。
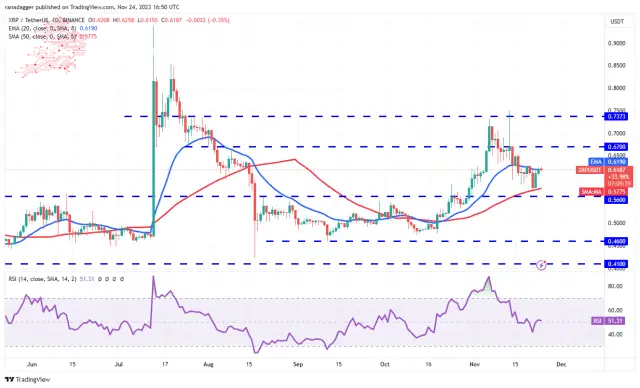
The 20-day EMA has flattened out, and the RSI is near the midpoint, indicating range-bound action in the short term. The XRP/USDT pair may swing between $0.56 and $0.74 for a few days.
20 日間 EMA は横ばいとなり、RSI は中間点付近にあり、短期的にはレンジ内での動きとなることを示しています。 XRP/USDTペアは数日間、0.56ドルから0.74ドルの間で変動する可能性がある。
If the price rises and sustains above the 20-day EMA, the pair could gradually climb to $0.67 and then to $0.74. Buyers must overcome this hurdle to indicate the start of a new up-move.
価格が上昇し、20日間EMAを上回った場合、ペアは徐々に0.67ドルまで上昇し、その後0.74ドルまで上昇する可能性がある。買い手は新たな上昇の始まりを示すためにこのハードルを乗り越える必要がある。
Conversely, if the price turns down from the current level and breaks below $0.56, it will signal the start of a sharper correction to $0.46.
逆に、価格が現在のレベルから下落し、0.56ドルを下回った場合は、0.46ドルへのより急激な調整が始まることを示します。
Solana (SOL) price analysis
Solana has been trying to break above the $59 resistance for the past two days, but the bears have held their ground. A minor positive in favour of the bulls is that they have not ceded ground to the bears.
ソラナ (SOL) 価格分析 ソラナは過去 2 日間、59 ドルの抵抗線を突破しようと努めてきましたが、弱気派は踏みとどまりました。強気派に有利なわずかなプラスは、強気派が弱気派に地位を譲らなかったことだ。
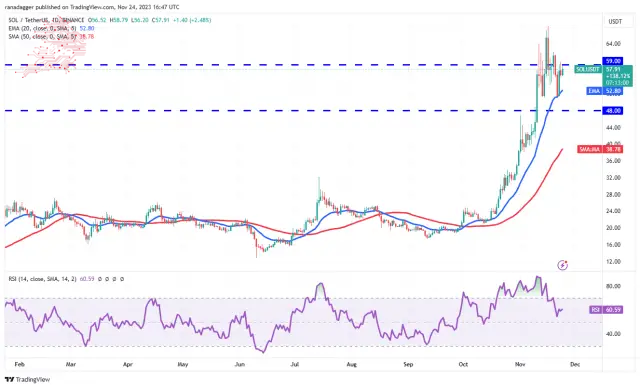
The rising 20-day EMA ($52.80) and the RSI in the positive territory suggest that bulls have the upper hand. That enhances the prospects of a rally above the overhead resistance. If that happens, the SOL/USDT pair could ascend to $68.
20日間EMA(52.80ドル)の上昇とRSIがプラス圏にあることは、強気派が優勢であることを示唆している。これにより、頭上の抵抗線を超えて上昇する可能性が高まる。そうなれば、SOL/USDTペアは68ドルまで上昇する可能性がある。
Contrary to this assumption, the bears will strive to tug the pair below the 20-day EMA if the price turns down from the current level. If they can pull it off, the pair may drop to $48, where buyers will likely step in.
この想定に反して、価格が現在の水準から下落した場合、弱気派はペアを20日間EMA以下に引き下げようとするだろう。それができれば、ペアは48ドルまで下落する可能性があり、そこに買い手が介入する可能性が高い。
Cardano (ADA) price analysis
Cardano has been swinging above and below the $0.38 level for the past few days. This shows uncertainty about the next directional move between the bulls and the bears.
カルダノ(ADA)の価格分析 カルダノはここ数日間、0.38ドルの水準を上下に変動しています。これは、強気派と弱気派の間の次の方向性についての不確実性を示しています。
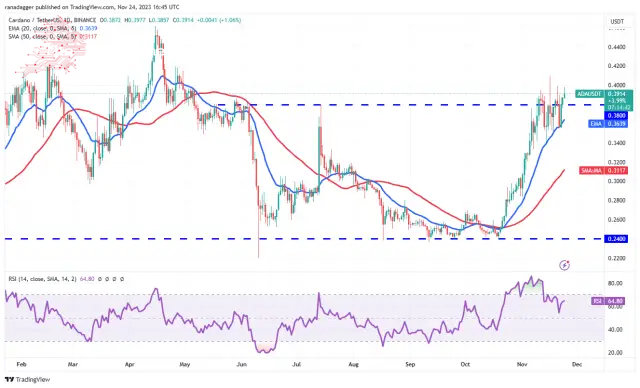
The upsloping moving averages and the RSI in the positive territory indicate that the bulls have a slight edge. If the price rises above $0.40, it will signal the start of a new up-move to $0.42 and later to $0.46.
移動平均線が右肩上がりで、RSI がプラス圏にあることは、強気派がわずかに有利であることを示しています。価格が0.40ドルを超えて上昇した場合、それは0.42ドルへの新たな上昇の開始を示し、その後は0.46ドルへの上昇となる。
Bears must yank the price below $0.34 if they want to trap the aggressive bulls. That may result in a fall to the 50-day SMA ($0.31). The ADA/USDT pair may oscillate between $0.24 and $0.38 for longer.
弱気派が攻撃的な強気派を罠にはめたければ、価格を0.34ドル以下に引き下げる必要がある。その結果、50日間SMA(0.31ドル)まで下落する可能性がある。 ADA/USDT ペアは長期にわたって 0.24 ドルから 0.38 ドルの間で変動する可能性があります。
Dogecoin (DOGE) price analysis
Dogecoin has maintained above the 20-day EMA ($0.08) for the past two days, but the rise lacks momentum. This indicates that bulls are cautious at higher levels.
ドージコイン(DOGE)の価格分析 ドージコインは過去2日間、20日間EMA(0.08ドル)を上回って維持しているが、上昇には勢いが欠けている。これは、強気派がより高いレベルでは慎重であることを示しています。
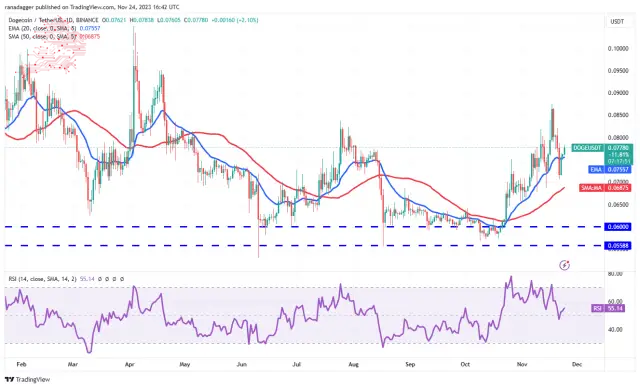
Buyers will have to propel the price above $0.08 to signal strength. The DOGE/USDT pair could surge toward the target objective of $0.10. This level may again witness a tough battle between the bulls and the bears.
買い手は強さを示すために価格を0.08ドル以上に引き上げる必要があるだろう。 DOGE/USDTペアは目標の0.10ドルに向けて急騰する可能性がある。このレベルでも再び強気派と弱気派の間の激しい戦いが見られるかもしれない。
If the price turns down from $0.08, it will suggest that bears remain active at higher levels. The pair may then drop to the immediate support at $0.07. The flattish 20-day EMA and the RSI just above the midpoint do not give a clear advantage to the bulls or the bears.
価格が0.08ドルから下落した場合、弱気派がより高いレベルで活発なままであることを示唆するだろう。その後、ペアは0.07ドルの当面のサポートに下落する可能性があります。平坦な20日間EMAと中間点のすぐ上のRSIは、強気派にも弱気派にも明らかな優位性を与えていない。
Toncoin (TON) price analysis
Buyers are trying to push Toncoin to the overhead resistance of $2.59. The repeated retest of a resistance level tends to weaken it.
トンコイン(TON)価格分析 買い手はトンコインを2.59ドルの直上抵抗線まで押し上げようとしている。抵抗レベルの再テストを繰り返すと、抵抗レベルが弱くなる傾向があります。
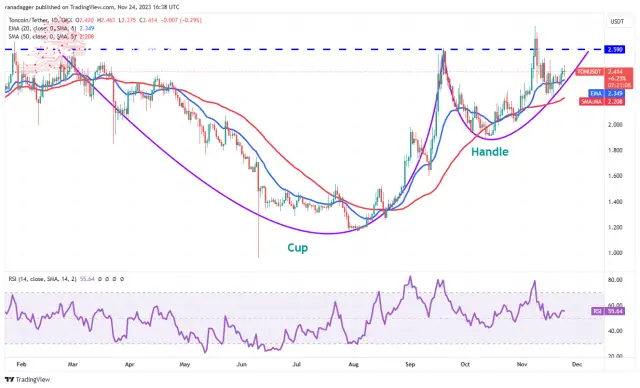
If bulls drive and sustain the price above the $2.59 to $2.77 resistance zone, it will complete a cup-and-handle pattern. That could start a new uptrend to $3.28 and, after that, to the pattern target of $4.03.
強気派が価格を2.59ドルから2.77ドルのレジスタンスゾーンを超えて維持すれば、カップアンドハンドルパターンが完成するだろう。これにより、3.28ドルまで新たな上昇トレンドが始まり、その後パターン目標の4.03ドルに達する可能性がある。
Alternatively, if the TON/USDT pair turns down from the overhead resistance, it will suggest that bears fiercely protect the level. That could result in a move down to the 50-day SMA ($2.20). A slide below this level will open the doors for a fall to $2 and $1.89.
あるいは、TON/USDTペアが頭上の抵抗線から下落した場合、弱気派がそのレベルを激しく守ることを示唆するだろう。これにより、50日SMA(2.20ドル)まで下落する可能性がある。このレベルを下回ると、2 ドルと 1.89 ドルへの下落の扉が開きます。
Chainlink (LINK) price analysis
Chainlink is facing selling at the downtrend line, as seen from the long wick on the November 23rd candlestick.
チェーンリンク(LINK)の価格分析 11月23日のローソク足の長い芯からわかるように、チェーンリンクは下降トレンドラインで売りに直面しています。
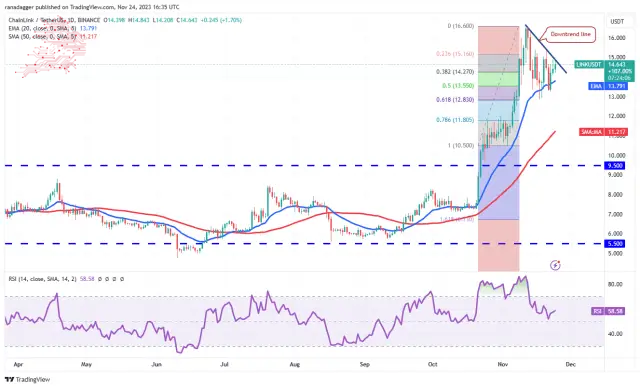
However, the bulls have not given up and have again pushed the price to the downtrend line. The cost is stuck between the downtrend line and the 61.8% Fibonacci retracement level of $12.83. This has resulted in a squeeze, likely resolving with a sharp move on either side.
しかし、強気派は諦めず、再び価格を下降トレンドラインに押し上げた。コストは下降トレンドラインと61.8%フィボナッチリトレースメントレベルの12.83ドルの間に行き詰まっています。これによりスクイズが発生し、どちらかの側が鋭い動きをすることで解決する可能性があります。
If the price surges above the downtrend line, the LINK/USDT pair may climb to $16.60 and $18.30. Instead, if the price turns down and plunges below $12.83, the decline could extend to the 50-day SMA ($11.21).
価格が下降トレンドラインを超えて急騰した場合、LINK/USDTペアは16.60ドルと18.30ドルまで上昇する可能性があります。むしろ、価格が下落に転じて12.83ドルを下回った場合、下落幅は50日間SMA(11.21ドル)まで拡大する可能性がある。
Avalanche (AVAX) price analysis
Avalanche has reached the overhead resistance at $22, a critical level to watch out for. The bears are expected to defend this level with vigour.
Avalanche (AVAX) 価格分析 Avalanche は 22 ドルの頭上の抵抗線に達しており、注意すべき重要なレベルです。弱気派はこのレベルを精力的に守ることが期待されている。
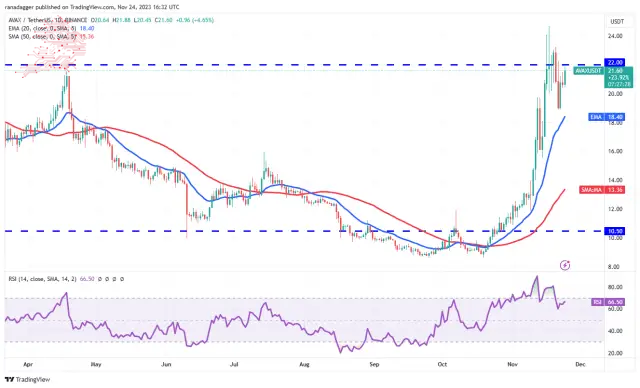
However, if bulls do not give up much ground from the current level, it will increase the likelihood of a break above $22. The pair may climb to $25, where the bears will likely mount a strong defence.
しかし、強気派が現在の水準から大きく譲歩しなければ、22ドルを突破する可能性が高まるだろう。ペアは25ドルまで上昇する可能性があり、弱気派はおそらく強力な防御を開始するだろう。
On the downside, the 20-day EMA ($18.40) remains critical to watch. If the price turns down and slips below this level, it will suggest the start of a deeper correction to $16. Such a move will indicate that the AVAX/USDT pair may spend more time between $10.50 and $22.
マイナス面としては、20 日間 EMA (18.40 ドル) が依然として重要です。価格が下落し、このレベルを下回った場合、16ドルへのさらなる調整が始まることを示唆するでしょう。このような動きは、AVAX/USDTペアが10.50ドルから22ドルの間でより多くの時間を費やす可能性があることを示しています。
Source – Rakesh Upadhyay
出典 – ラケシュ・ウパディヤイ
Source: https://thebittimes.com/latest-market-overview-24th-nov-btc-eth-bnb-xrp-sol-ada-doge-ton-link-avax-tbt71575.html
出典: https://thebittimes.com/latest-market-overview-24th-nov-btc-eth-bnb-xrp-sol-ada-doge-ton-link-avax-tbt71575.html
 DogeHome
 Coincu
 Coin Edition
 Coin_Gabbar
 Coincu
 BlockchainReporter
 CoinPedia News


