


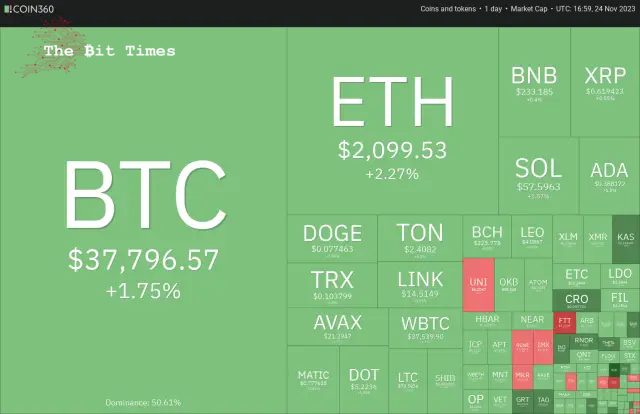
Bitcoin’s (BTC) price has surged past the $38,000 mark, suggesting the potential for an upward rally. The positive sentiment and sustained bullish pressure were evident as Bitcoin breached the critical resistance level on November 24th. Adrian Przelozny, CEO of Independent Reserve, expressed optimism, foreseeing a promising outlook for the next two years. He anticipates increased market activity in early 2024.
比特幣 (BTC) 的價格已飆升至 38,000 美元大關,顯示有上漲的潛力。隨著比特幣於 11 月 24 日突破關鍵阻力位,積極情緒和持續看漲壓力顯而易見。 Independent Reserve執行長 Adrian Przelozny表示樂觀,預計未來兩年前景光明。他預計 2024 年初市場活動將會增加。
Two significant factors driving the cryptocurrency market in the coming year include the Bitcoin halving scheduled for April and pending applications for a spot exchange-traded fund. Some of these ETF applications face a decision deadline in January. With these significant events on the horizon, Bitcoin will likely attract buyers even during price corrections.
推動來年加密貨幣市場的兩個重要因素包括定於四月進行的比特幣減半以及現貨交易所交易基金的待決申請。其中一些 ETF 申請面臨 1 月份的決定截止日期。隨著這些重大事件即將發生,即使在價格調整期間,比特幣也可能吸引買家。
Analysts expect a retracement from $40,000 in the near term. That could be one of the reasons why Cathie Wood’s investment firm, ARK Invest, has been gradually selling into strength. The firm sold about 700,000 shares of the Grayscale Bitcoin Trust (GBTC) over the past month, but it is worth noting that ARK still holds more than 4.3 million GBTC shares.
分析師預計短期內會從 4 萬美元回撤。這可能是凱西·伍德 (Cathie Wood) 的投資公司 ARK Invest 逐漸拋售的原因之一。該公司在過去一個月出售了約 70 萬股灰階比特幣信託(GBTC)股票,但值得注意的是,ARK 仍持有超過 430 萬股 GBTC 股票。
Could crypto traders bulldoze their way through the overhead resistance levels in Bitcoin and major altcoins? What are the critical levels to watch out for?
加密貨幣交易者能否突破比特幣和主要山寨幣的上方阻力位?需要注意的關鍵水平是什麼?
Let’s analyze the charts of the top 10 cryptocurrencies to find out.
讓我們分析一下前 10 名加密貨幣的圖表來找出答案。
Bitcoin (BTC) price analysis
比特幣(BTC)價格分析
Bitcoin pierced the stiff resistance of $37,980 on November 24th, but the bulls are struggling to sustain the breakout. This suggests that the bears are vigorously guarding the level.
11 月 24 日,比特幣突破了 37,980 美元的強勁阻力位,但多頭正在努力維持突破。這表明空頭正在積極守衛該水平。
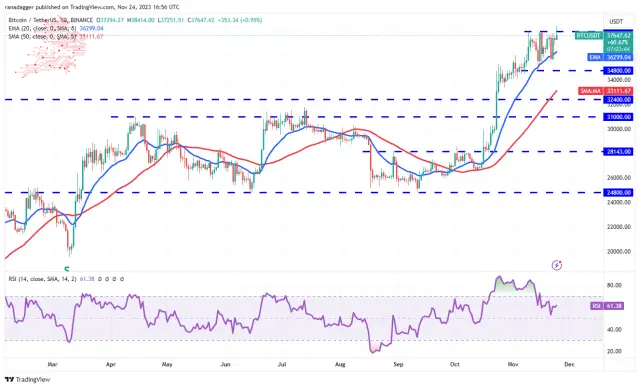
Both moving averages are sloping up, and the relative strength index (RSI) is above 61, indicating that the path of least resistance is to the upside. If buyers maintain the price above $37,980, the BTC/USDT pair could reach $40,000.
兩條移動平均線均向上傾斜,相對強弱指數 (RSI) 高於 61,顯示阻力最小的路徑是上行。如果買家將價格維持在 37,980 美元以上,BTC/USDT 貨幣對可能會達到 40,000 美元。
This level may again witness a tough battle between the bulls and the bears, but if the buyers prevail, the pair could skyrocket to $48,000. Time is running out for the bears. They must sink the price below the 20-day EMA if they want to weaken the momentum. The short-term trend will turn negative below $34,800.
這一水平可能會再次見證多頭和空頭之間的激烈戰鬥,但如果買家獲勝,該貨幣對可能會飆升至 48,000 美元。留給熊的時間已經不多了。如果他們想削弱勢頭,就必須將價格壓至 20 日均線以下。跌破34,800美元短期趨勢將轉為負值。
Ether (ETH) price analysis
以太幣(ETH)價格分析
The bulls pushed Ether above the resistance line on November 22nd, suggesting the start of the next leg of the up-move.
11 月 22 日,多頭將以太幣推升至阻力線上方,顯示下一波上漲趨勢的開始。
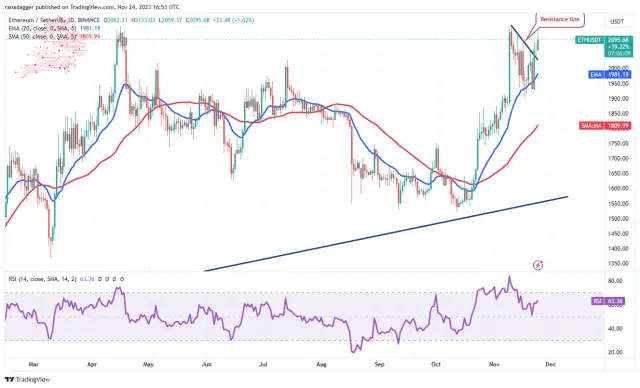
The bears tried to pull the price back below the resistance line on November 23rd, but the bulls held their ground. This suggests that the bulls try to flip the resistance line into support. The ETH/USDT pair could start a northward march toward $2,200 if they succeed.
11 月 23 日,空頭試圖將價格拉回阻力線以下,但多頭堅守陣地。這表明多頭試圖將阻力線轉變為支撐線。如果成功,ETH/USDT 貨幣對可能會開始向 2,200 美元進軍。
This level may act as a formidable resistance again, but if bulls overcome it, the pair will complete a large ascending triangle pattern. That could open the gates for a potential rally to the pattern target of $3,400.
該水平可能再次成為強大的阻力位,但如果多頭克服該水平,該貨幣對將完成一個大的上升三角形模式。這可能會打開潛在反彈至 3,400 美元目標位的大門。
This bullish view will be invalidated soon if the price turns down and plummets below the vital support at $1,900.
如果價格下跌並跌破 1,900 美元的重要支撐位,這種看漲觀點很快就會失效。
BNB price analysis
BNB價格分析
BNB 於 11 月 22 日躍升至 235 美元上方,但多頭未能克服 20 日均線(239 美元)的障礙。這顯示空頭正試圖控制局面。
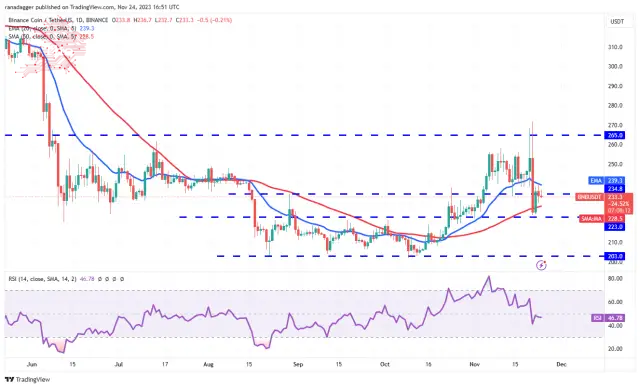
The 20-day EMA has started to turn down, and the RSI is just below the midpoint, indicating a minor advantage to the bears. The short-term trend will turn negative on a break and close below the crucial support at $223. That could clear the path for a fall to $203.
20 日均線已開始向下,RSI 略低於中點,顯示空頭略有優勢。突破後短期趨勢將轉為負面,收盤價低於關鍵支撐位 223 美元。這可能為跌至 203 美元掃清道路。
Bulls must push and sustain the price above the 20-day EMA if they want to prevent the downside. The BNB/USDT pair may spend more time between $223 and $265.
如果多頭想要阻止下跌,就必須將價格推高並維持在 20 日均線上方。 BNB/USDT 貨幣對可能會花費更多時間在 223 美元至 265 美元之間。
XRP price analysis
The bulls are trying to shove XRP above the 20-day EMA ($0.62), which suggests strong buying at lower levels.
XRP 價格分析 多頭正試圖將 XRP 推至 20 日均線(0.62 美元)之上,這表明較低水平的強勁買盤。
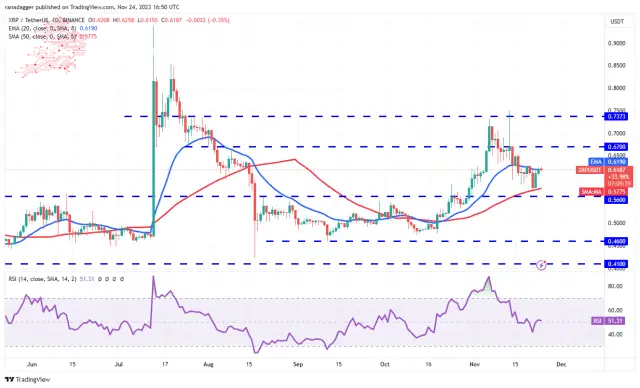
The 20-day EMA has flattened out, and the RSI is near the midpoint, indicating range-bound action in the short term. The XRP/USDT pair may swing between $0.56 and $0.74 for a few days.
20日均線已趨於平緩,RSI接近中點,顯示短期內將呈現區間震盪走勢。 XRP/USDT 貨幣對可能會在 0.56 美元至 0.74 美元之間波動幾天。
If the price rises and sustains above the 20-day EMA, the pair could gradually climb to $0.67 and then to $0.74. Buyers must overcome this hurdle to indicate the start of a new up-move.
如果價格上漲並維持在 20 日均線之上,該貨幣對可能會逐漸攀升至 0.67 美元,然後升至 0.74 美元。買家必須克服這一障礙才能表明新的上漲趨勢的開始。
Conversely, if the price turns down from the current level and breaks below $0.56, it will signal the start of a sharper correction to $0.46.
相反,如果價格從當前水準下跌並跌破 0.56 美元,則將預示著將開始大幅調整至 0.46 美元。
Solana (SOL) price analysis
Solana has been trying to break above the $59 resistance for the past two days, but the bears have held their ground. A minor positive in favour of the bulls is that they have not ceded ground to the bears.
Solana (SOL) 價格分析 在過去兩天,Solana 一直試圖突破 59 美元的阻力位,但空頭堅守陣地。有利於多頭的一個小正面因素是,他們沒有向空頭讓出陣地。
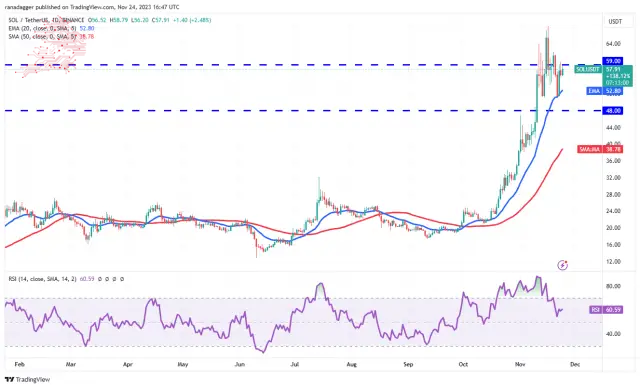
The rising 20-day EMA ($52.80) and the RSI in the positive territory suggest that bulls have the upper hand. That enhances the prospects of a rally above the overhead resistance. If that happens, the SOL/USDT pair could ascend to $68.
不斷上升的 20 日均線(52.80 美元)和 RSI 處於正值區域表示多頭佔上風。這增強了反彈至上方阻力位上方的前景。如果發生這種情況,SOL/USDT 貨幣對可能會升至 68 美元。
Contrary to this assumption, the bears will strive to tug the pair below the 20-day EMA if the price turns down from the current level. If they can pull it off, the pair may drop to $48, where buyers will likely step in.
與這一假設相反,如果價格從當前水平下跌,空頭將努力將該貨幣對拉至 20 日均線下方。如果他們能成功,該貨幣對可能會跌至 48 美元,買家可能會介入。
Cardano (ADA) price analysis
Cardano has been swinging above and below the $0.38 level for the past few days. This shows uncertainty about the next directional move between the bulls and the bears.
卡爾達諾 (ADA) 價格分析 過去幾天卡爾達諾一直在 0.38 美元的水平上下波動。這表明多頭和空頭之間的下一步走勢存在不確定性。
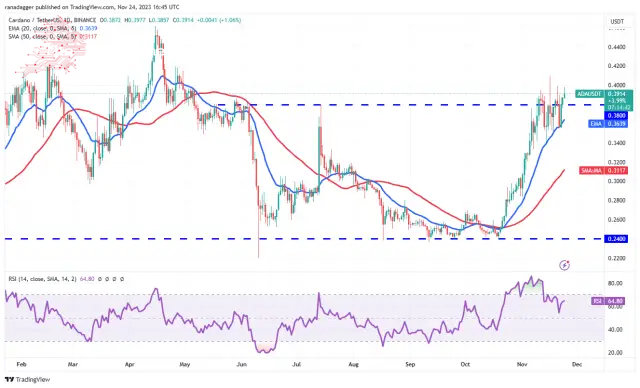
The upsloping moving averages and the RSI in the positive territory indicate that the bulls have a slight edge. If the price rises above $0.40, it will signal the start of a new up-move to $0.42 and later to $0.46.
向上傾斜的移動平均線和正值區域的 RSI 顯示多頭有輕微優勢。如果價格升至 0.40 美元以上,則將標誌著新一輪上漲至 0.42 美元,隨後升至 0.46 美元的開始。
Bears must yank the price below $0.34 if they want to trap the aggressive bulls. That may result in a fall to the 50-day SMA ($0.31). The ADA/USDT pair may oscillate between $0.24 and $0.38 for longer.
如果空頭想捕捉激進的多頭,就必須將價格拉至 0.34 美元以下。這可能會導致跌至 50 日移動平均線(0.31 美元)。 ADA/USDT 貨幣對可能會在 0.24 美元至 0.38 美元之間波動更長時間。
Dogecoin (DOGE) price analysis
Dogecoin has maintained above the 20-day EMA ($0.08) for the past two days, but the rise lacks momentum. This indicates that bulls are cautious at higher levels.
狗狗幣(DOGE)價格分析 過去兩天狗狗幣一直維持在20日均線(0.08美元)上方,但上漲動力不足。這顯示多頭在較高水準上持謹慎態度。
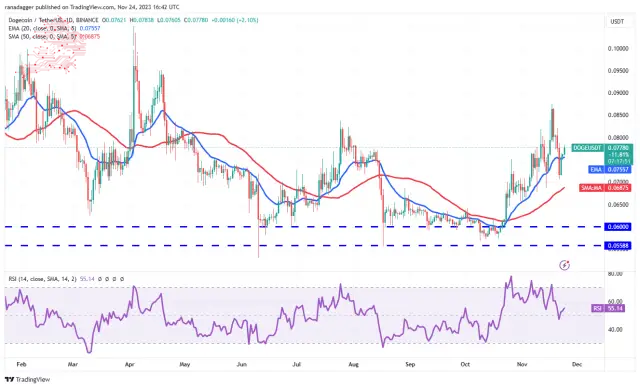
Buyers will have to propel the price above $0.08 to signal strength. The DOGE/USDT pair could surge toward the target objective of $0.10. This level may again witness a tough battle between the bulls and the bears.
買家必須將價格推高至 0.08 美元以上才能發出強勢訊號。 DOGE/USDT 貨幣對可能飆升至 0.10 美元的目標。這一水平可能會再次見證多頭和空頭之間的一場硬仗。
If the price turns down from $0.08, it will suggest that bears remain active at higher levels. The pair may then drop to the immediate support at $0.07. The flattish 20-day EMA and the RSI just above the midpoint do not give a clear advantage to the bulls or the bears.
如果價格從 0.08 美元回落,則表示空頭在較高水準仍保持活躍。隨後該貨幣對可能會跌至 0.07 美元的直接支撐位。持平的 20 日均線和略高於中點的 RSI 並沒有為多頭或空頭帶來明顯的優勢。
Toncoin (TON) price analysis
Buyers are trying to push Toncoin to the overhead resistance of $2.59. The repeated retest of a resistance level tends to weaken it.
Toncoin (TON) 價格分析 買家正試圖將 Toncoin 推至 2.59 美元的上方阻力位。反覆重新測試阻力位往往會削弱它。
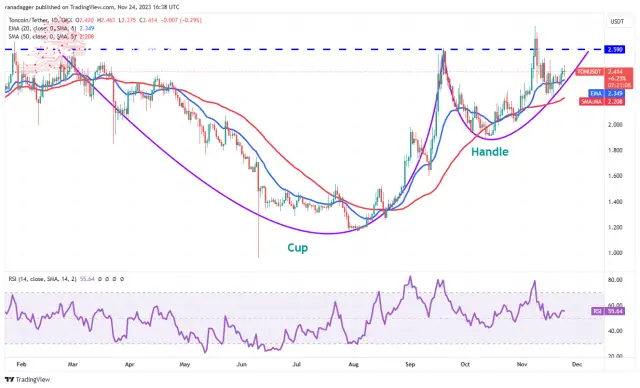
If bulls drive and sustain the price above the $2.59 to $2.77 resistance zone, it will complete a cup-and-handle pattern. That could start a new uptrend to $3.28 and, after that, to the pattern target of $4.03.
如果多頭推動並維持價格高於 2.59 美元至 2.77 美元阻力區,則它將完成杯柄形態。這可能會開啟新的上升趨勢,升至 3.28 美元,然後升至 4.03 美元的形態目標。
Alternatively, if the TON/USDT pair turns down from the overhead resistance, it will suggest that bears fiercely protect the level. That could result in a move down to the 50-day SMA ($2.20). A slide below this level will open the doors for a fall to $2 and $1.89.
或者,如果 TON/USDT 貨幣對從上方阻力位下跌,則表示空頭強烈保護該水準。這可能導致價格下跌至 50 日移動平均線(2.20 美元)。跌破該水準將為跌至 2 美元和 1.89 美元打開大門。
Chainlink (LINK) price analysis
Chainlink is facing selling at the downtrend line, as seen from the long wick on the November 23rd candlestick.
Chainlink (LINK) 價格分析 從 11 月 23 日燭台上的長影線可以看出,Chainlink 正面臨下降趨勢線的拋售。
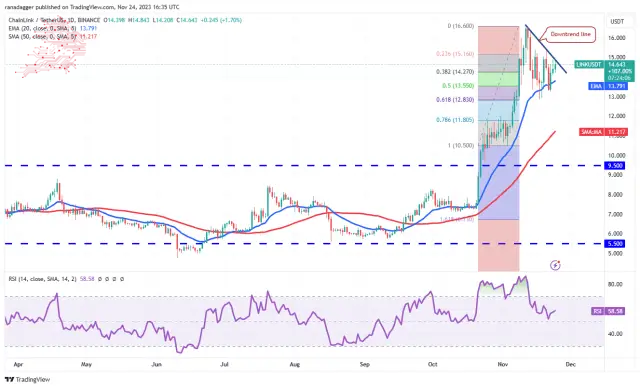
However, the bulls have not given up and have again pushed the price to the downtrend line. The cost is stuck between the downtrend line and the 61.8% Fibonacci retracement level of $12.83. This has resulted in a squeeze, likely resolving with a sharp move on either side.
然而,多頭並沒有放棄,並再次將價格推向下降趨勢線。成本陷入下降趨勢線和 61.8% 斐波那契回檔位 12.83 美元之間。這導致了擠壓,很可能透過雙方的大幅波動來解決。
If the price surges above the downtrend line, the LINK/USDT pair may climb to $16.60 and $18.30. Instead, if the price turns down and plunges below $12.83, the decline could extend to the 50-day SMA ($11.21).
如果價格飆升至下降趨勢線之上,LINK/USDT 貨幣對可能會攀升至 16.60 美元和 18.30 美元。相反,如果價格下跌並跌破 12.83 美元,跌勢可能會延伸至 50 日移動平均線(11.21 美元)。
Avalanche (AVAX) price analysis
Avalanche has reached the overhead resistance at $22, a critical level to watch out for. The bears are expected to defend this level with vigour.
Avalanche (AVAX) 價格分析 Avalanche 已達到 22 美元的上方阻力位,這是一個值得關注的關鍵水平。預計空頭將大力捍衛這一水平。
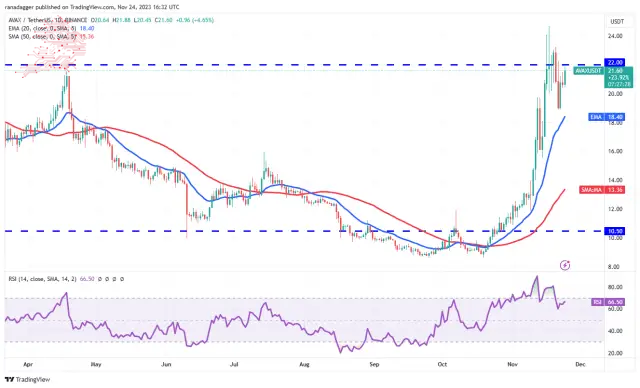
However, if bulls do not give up much ground from the current level, it will increase the likelihood of a break above $22. The pair may climb to $25, where the bears will likely mount a strong defence.
然而,如果多頭不從當前水平回撤太多,那麼突破 22 美元的可能性將會增加。該貨幣對可能會攀升至 25 美元,空頭可能會在此進行強有力的防禦。
On the downside, the 20-day EMA ($18.40) remains critical to watch. If the price turns down and slips below this level, it will suggest the start of a deeper correction to $16. Such a move will indicate that the AVAX/USDT pair may spend more time between $10.50 and $22.
下檔方面,20 日均線(18.40 美元)仍然值得關注。如果價格下跌並跌破該水平,則表示將開始進一步回調至 16 美元。這項舉措將表明 AVAX/USDT 貨幣對可能會在 10.50 美元至 22 美元之間花費更多時間。
Source – Rakesh Upadhyay
來源——Rakesh Upadhyay
Source: https://thebittimes.com/latest-market-overview-24th-nov-btc-eth-bnb-xrp-sol-ada-doge-ton-link-avax-tbt71575.html
資料來源:https://thebittimes.com/latest-market-overview-24th-nov-btc-eth-bnb-xrp-sol-ada-doge-ton-link-avax-tbt71575.html
 crypto.news
 DogeHome
 CFN
CFN Times Tabloid
 Thecoinrepublic.com
 Crypto News Land
 CoinPedia News


