

Bitcoin (BTC) has been facing stiff resistance near $52,000, increasing the possibility of a short-term correction. The sideways action resulted in net outflows of roughly $36 million from the spot Bitcoin exchange-traded funds (ETFs) on Feb. 21, according to various sources, including BitMEX Research. However, the bleeding stalled on Feb. 22, and the day saw net inflows of about $251 million into the ETFs.
Bitcoin (BTC) se ha enfrentado a una fuerte resistencia cercana a los 52.000 dólares, lo que aumenta la posibilidad de una corrección a corto plazo. La acción lateral resultó en salidas netas de aproximadamente $ 36 millones de los fondos cotizados en bolsa (ETF) de Bitcoin el 21 de febrero, según varias fuentes, incluida BitMEX Research. Sin embargo, la hemorragia se detuvo el 22 de febrero, y ese día se registraron entradas netas de alrededor de 251 millones de dólares en los ETF.
Some analysts believe the markets are ready for a pullback before the halving in April. Popular trader and analyst Rekt Capital said Bitcoin’s current bull phase is similar to the 2016 and 2020 bull runs. If history repeats itself, “a pre-halving retrace” followed by “a post halving reaccumulation period” is possible.
Algunos analistas creen que los mercados están preparados para un retroceso antes de la reducción a la mitad en abril. El popular comerciante y analista Rekt Capital dijo que la actual fase alcista de Bitcoin es similar a las corridas alcistas de 2016 y 2020. Si la historia se repite, es posible "un retroceso previo a la reducción a la mitad" seguido de "un período de reacumulación posterior a la reducción a la mitad".
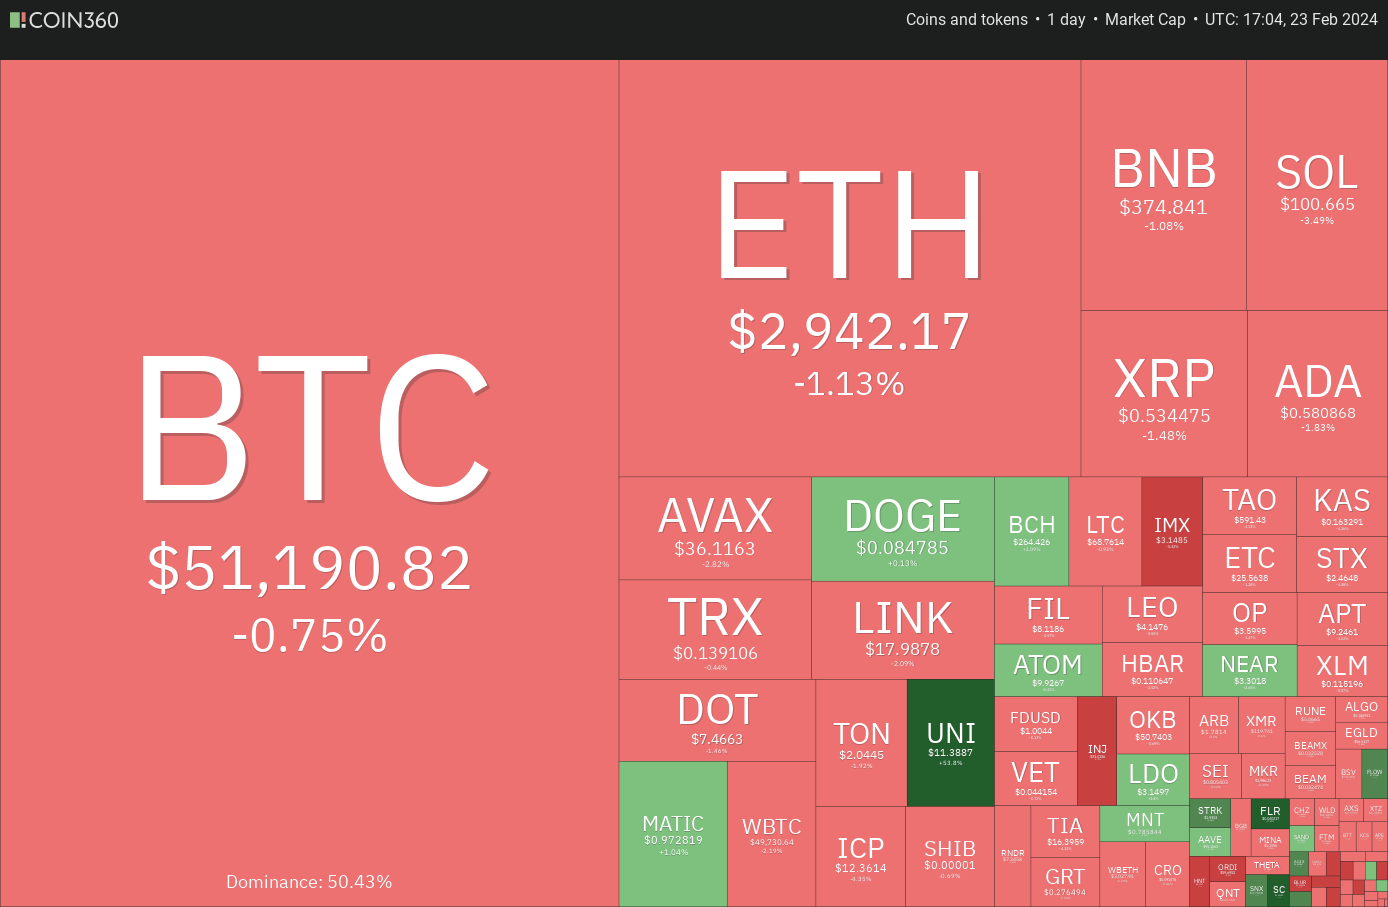
Bitcoin’s hesitation to continue its rally has triggered profit-booking in select altcoins. A corrective phase is positive for the long-term health of the markets as it shakes out the weak hands and allows the stronger hands to add at lower levels.
La vacilación de Bitcoin para continuar su repunte ha provocado la reserva de ganancias en altcoins seleccionadas. Una fase correctiva es positiva para la salud a largo plazo de los mercados, ya que sacude las manos débiles y permite que las manos más fuertes sumen en niveles más bajos.
What are the crucial support levels to watch out for on the downside in Bitcoin and altcoins? Let’s analyze the charts of the top 10 cryptocurrencies to find out.
¿Cuáles son los niveles de soporte cruciales a tener en cuenta a la baja en Bitcoin y altcoins? Analicemos los gráficos de las 10 principales criptomonedas para descubrirlo.
Bitcoin price analysis
Análisis de precios de Bitcoin
The long tail on Bitcoin’s Nov. 21 candlestick shows that the bulls purchased the dip to the immediate support of $50,625, but could not overcome the barrier at $52,000.
La larga cola de la vela de Bitcoin del 21 de noviembre muestra que los alcistas compraron la caída hasta el soporte inmediato de $50,625, pero no pudieron superar la barrera de $52,000.
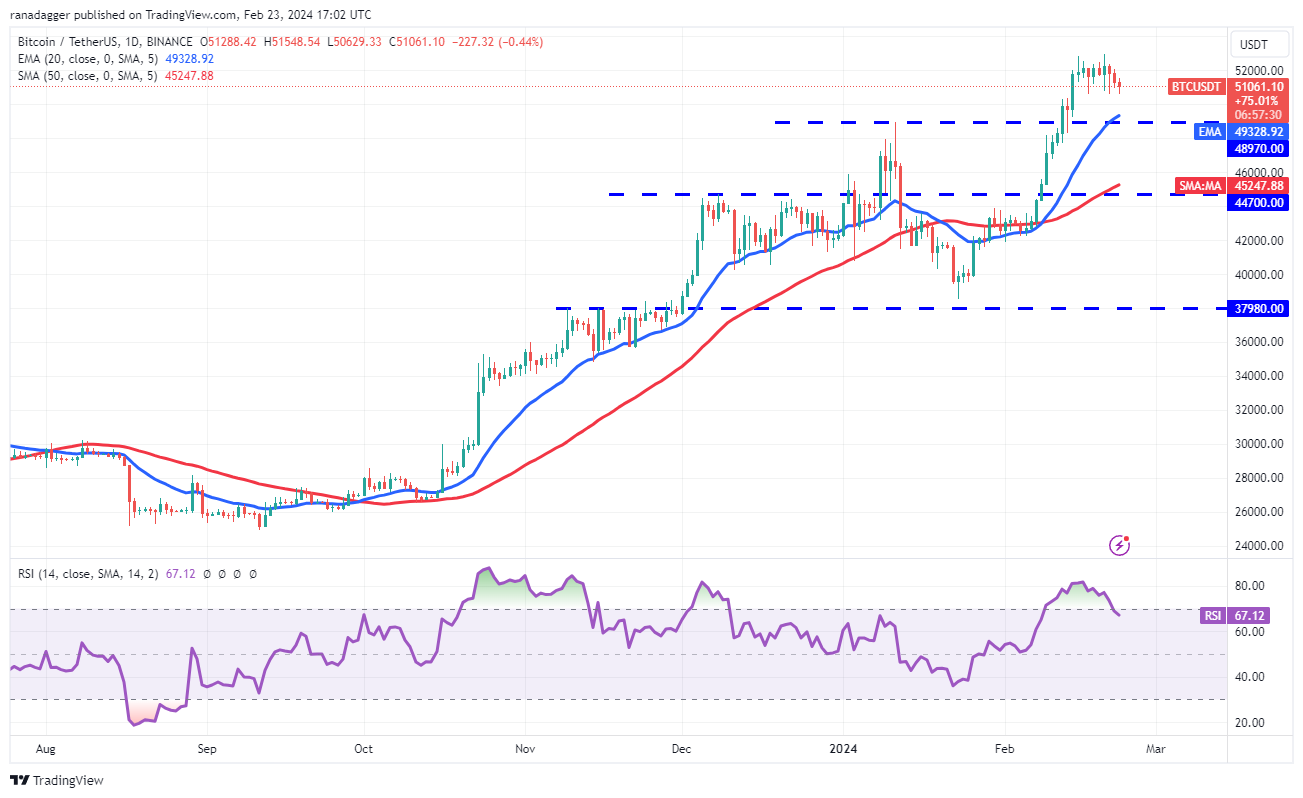
The bears will again try to yank the price below $50,625. If they can pull it off, the BTC/USDT pair could plunge to the strong support at $48,970. A bounce off this level will indicate that the sentiment remains bullish and traders are buying on dips. The uptrend will resume on a break above $52,000. The pair could then reach $60,000.
Los bajistas intentarán nuevamente bajar el precio por debajo de los USD 50,625. Si pueden lograrlo, el par BTC/USDT podría caer hasta el fuerte soporte de $48,970. Un rebote desde este nivel indicará que el sentimiento sigue siendo alcista y que los operadores están comprando en las caídas. La tendencia alcista se reanudará con una ruptura por encima de los 52.000 dólares. El par podría entonces alcanzar los 60.000 dólares.
However, the bears are likely to have other plans. They will try to pull the price below $48,970. If they do that, the selling could intensify, and the pair may nosedive to the 50-day SMA ($45,247).
Sin embargo, es probable que los bajistas tengan otros planes. Intentarán bajar el precio por debajo de los 48.970 dólares. Si lo hacen, las ventas podrían intensificarse y el par podría caer en picada hasta la SMA de 50 días ($45,247).
Ether price analysis
Análisis de precios de éter
Ether (ETH) tried to jump above the psychological resistance of $3,000 on Feb. 22, but the bears held their ground.
Ether (ETH) intentó saltar por encima de la resistencia psicológica de 3.000 dólares el 22 de febrero, pero los bajistas se mantuvieron firmes.
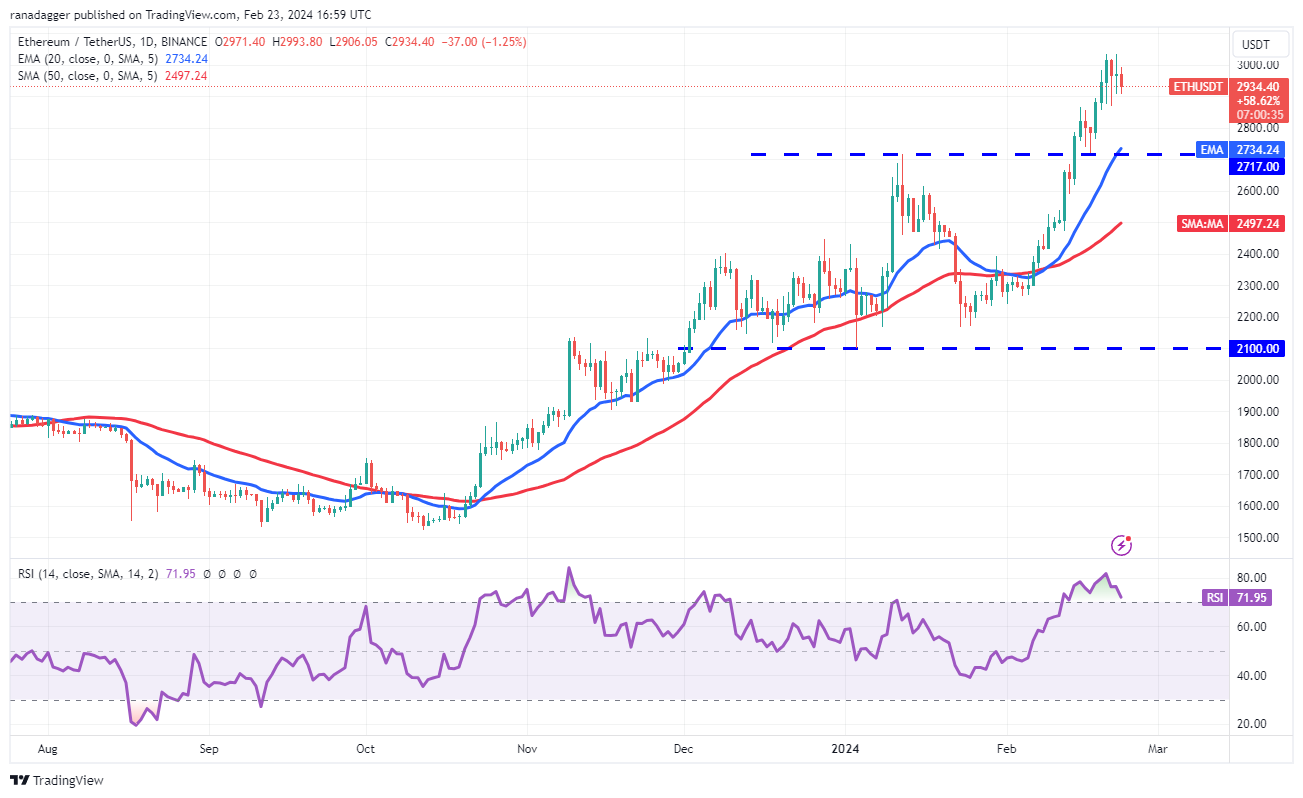
Sellers are trying to start a correction toward the breakout level of $2,717. This is an important level to watch out for because the 20-day EMA ($2,734) is nearby. If the price rebounds off $2,717 with force, it will indicate that the bulls have flipped the level into support. The bulls will then again attempt to clear the hurdle at $3,000. If they succeed, the ETH/USDT pair may reach $3,300.
Los vendedores están intentando iniciar una corrección hacia el nivel de ruptura de 2.717$. Este es un nivel importante al que hay que prestar atención porque la EMA de 20 días (USD 2,734) está cerca. Si el precio rebota con fuerza desde $ 2,717, indicará que los alcistas han convertido el nivel en soporte. Los alcistas intentarán nuevamente superar el obstáculo de los 3.000 dólares. Si tienen éxito, el par ETH/USDT puede alcanzar los $3,300.
The bears will have to tug and maintain the price below $2,717 to weaken the bulls. The pair may then tumble to the 50-day SMA ($2,497). Such a deeper fall could delay the start of the next leg of the uptrend.
Los bajistas tendrán que tirar y mantener el precio por debajo de 2.717 dólares para debilitar a los alcistas. Luego, el par puede caer hasta la SMA de 50 días ($2,497). Una caída tan profunda podría retrasar el inicio del siguiente tramo de la tendencia alcista.
BNB price analysis
Análisis de precios de BNB
BNB (BNB) resumed its uptrend after breaking above the $367 resistance on Feb. 21. The next target objective on the upside is $400.
BNB (BNB) reanudó su tendencia alcista después de superar la resistencia de $ 367 el 21 de febrero. El próximo objetivo al alza son $ 400.
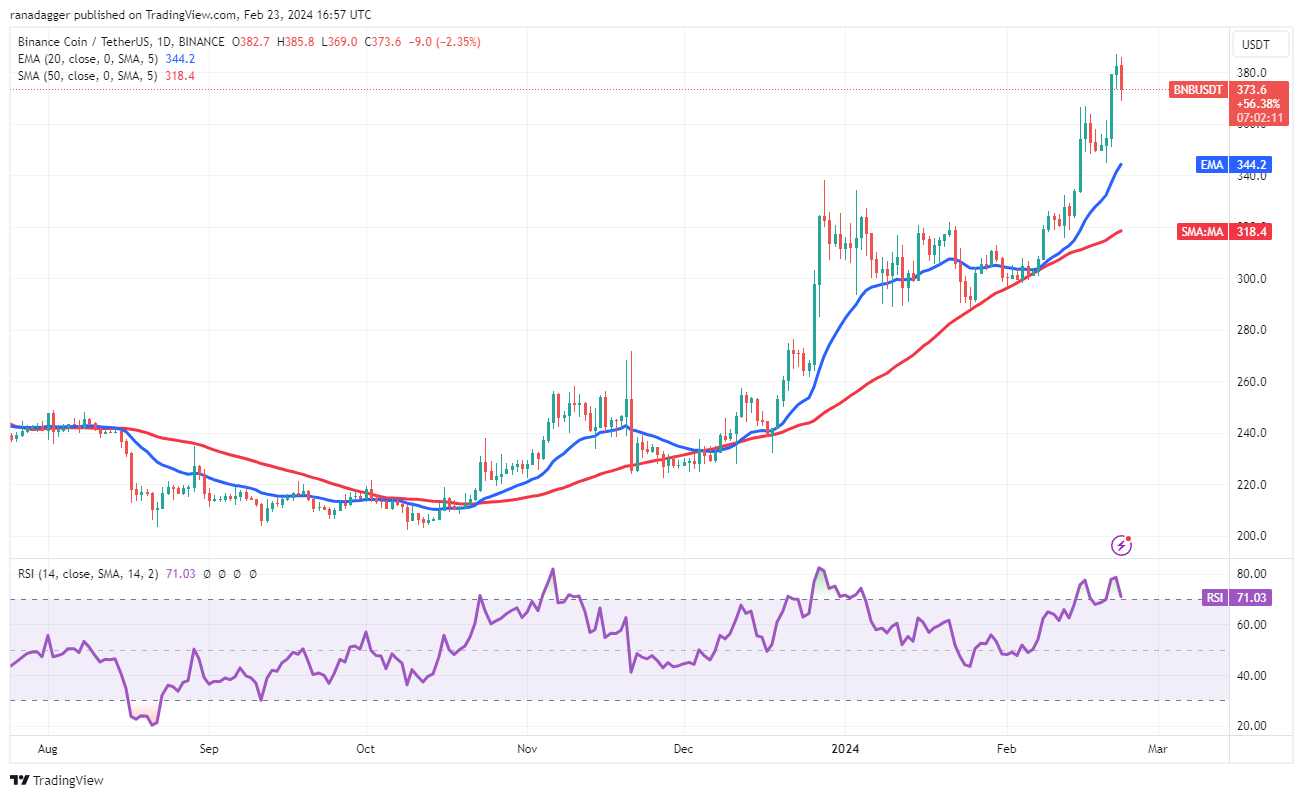
The bears will try to stall the up move at $400, but if the bulls do not give up much ground from the level, it will indicate that every minor dip is being bought. That will improve the prospects of a rally to $460.
Los bajistas intentarán detener el movimiento alcista en $400, pero si los alcistas no ceden mucho terreno desde el nivel, indicará que se están comprando cada caída menor. Eso mejorará las perspectivas de un repunte hasta los 460 dólares.
The first support on the downside is $368, and then the 20-day EMA ($344). If the supports fail to hold, the correction could reach the 50-day SMA ($318). This is an essential level for the bulls to defend because a break below it will signal a trend change.
El primer soporte a la baja es $368, y luego la EMA de 20 días ($344). Si los soportes no se mantienen, la corrección podría alcanzar la SMA de 50 días ($318). Este es un nivel esencial que los alcistas deben defender porque una ruptura por debajo de él indicará un cambio de tendencia.
Solana price analysis
Análisis de precios de Solana
Solana (SOL) bounced off the 50-day SMA ($99) on Feb. 21, but the bulls could not push the price above the 20-day EMA ($105).
Solana (SOL) rebotó en la SMA de 50 días ($99) el 21 de febrero, pero los alcistas no pudieron impulsar el precio por encima de la EMA de 20 días ($105).
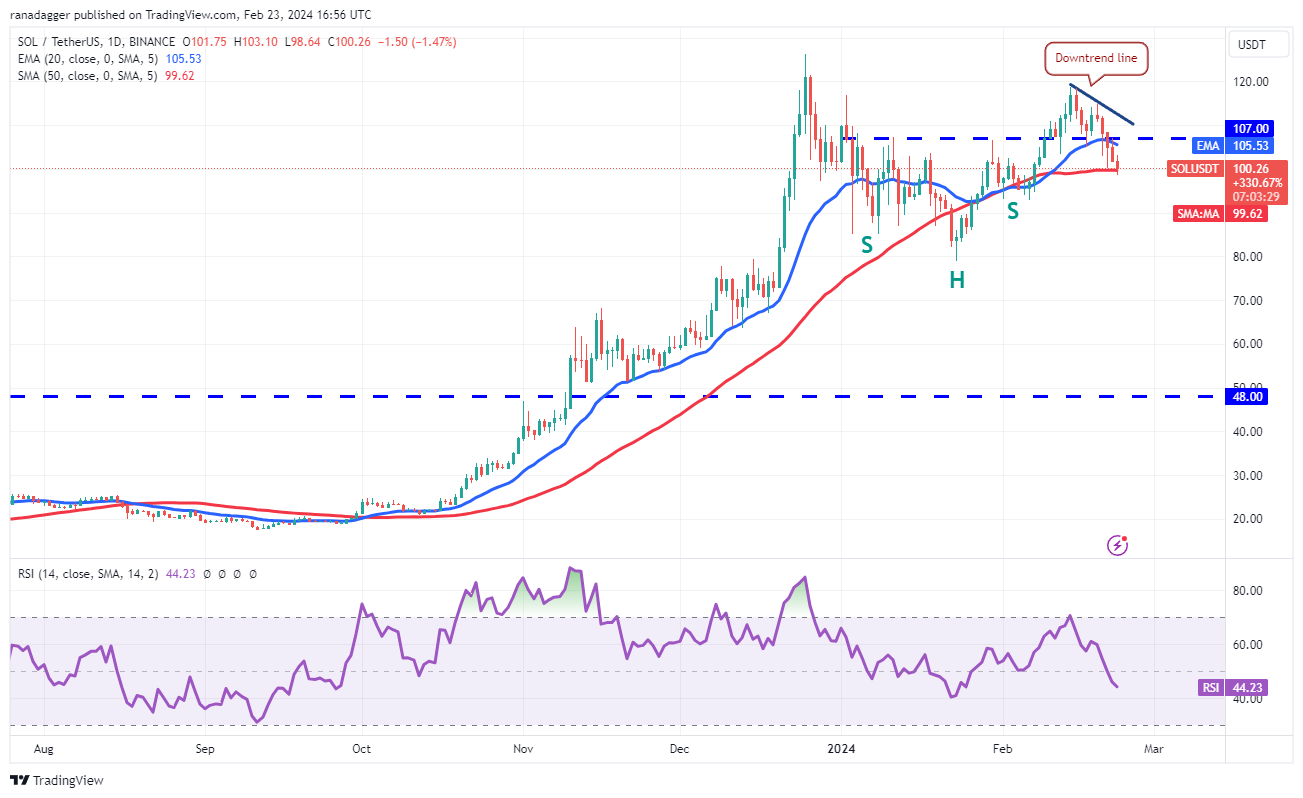
The bears will try to strengthen their position by pulling the price below the 50-day SMA. If they do that, the SOL/USDT pair could descend to $93 and then to $80. This level is likely to attract aggressive buying by the bulls.
Los bajistas intentarán fortalecer su posición llevando el precio por debajo de la SMA de 50 días. Si hacen eso, el par SOL/USDT podría descender a $93 y luego a $80. Es probable que este nivel atraiga compras agresivas por parte de los alcistas.
On the upside, the bulls will have to overcome the barrier at the downtrend line to signal that the correction may be over. The pair could then attempt a rally to $126, where the bears are likely to mount a strong defense.
Por el lado positivo, los alcistas tendrán que superar la barrera en la línea de tendencia bajista para indicar que la corrección puede haber terminado. Luego, el par podría intentar un repunte hasta los USD 126, donde es probable que los bajistas monten una fuerte defensa.
XRP price analysis
Análisis de precios XRP
XRP (XRP) formed an inside-day candlestick pattern on Feb. 22, indicating indecision between the buyers and sellers. This uncertainty resolved to the downside on Feb. 23, suggesting that the bears had overpowered the bulls.
XRP (XRP) formó un patrón de velas intradía el 22 de febrero, lo que indica indecisión entre compradores y vendedores. Esta incertidumbre se resolvió a la baja el 23 de febrero, lo que sugiere que los bajistas habían dominado a los alcistas.
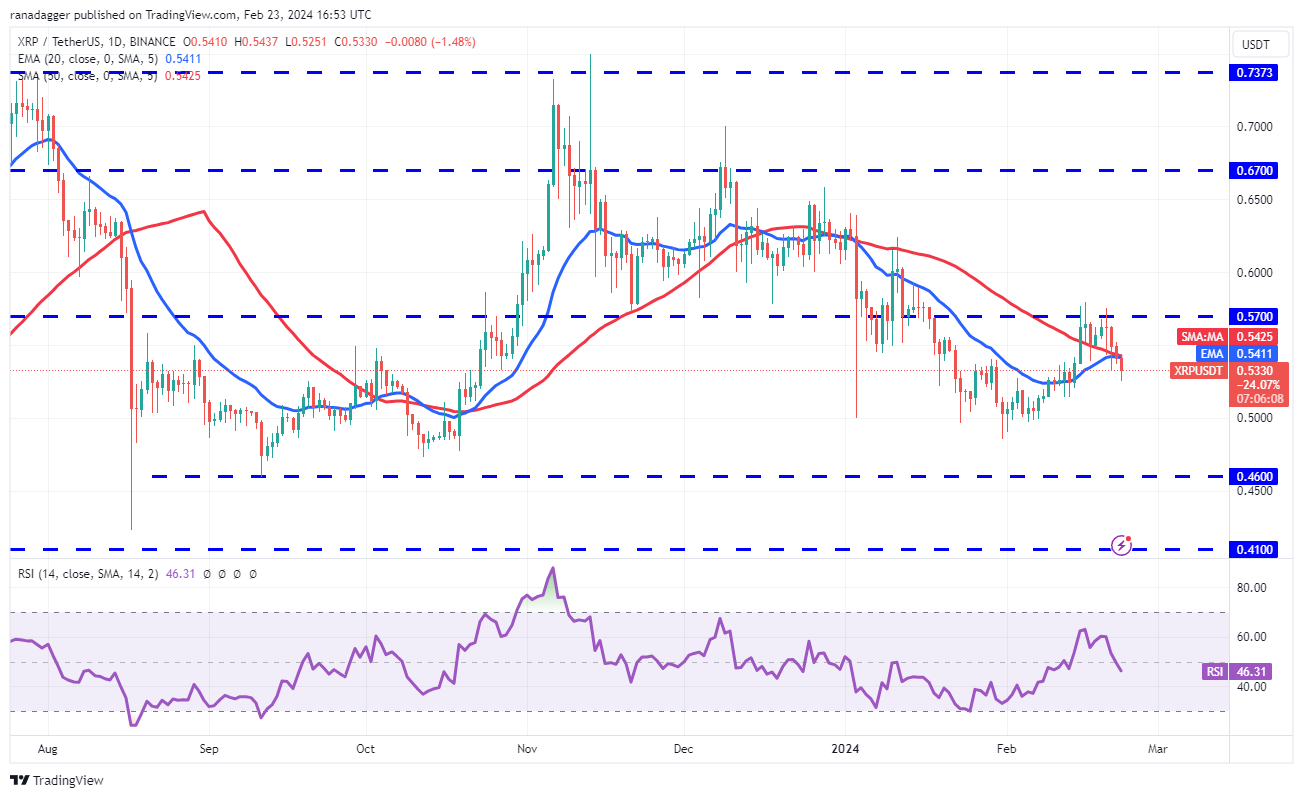
The bears will try to sink the pair to the strong support zone between $0.48 and $0.46. A strong rebound of this zone suggests that the XRP/USDT pair remains range-bound between $0.46 and $0.57 for a few days.
Los bajistas intentarán hundir el par hasta la fuerte zona de soporte entre USD 0,48 y USD 0,46. Un fuerte rebote de esta zona sugiere que el par XRP/USDT se mantiene dentro del rango entre $0,46 y $0,57 durante unos días.
The bulls will have to shove the price above $0.57 to indicate the start of a new up move. The pair will then attempt a rally to $0.67 and subsequently to the formidable resistance at $0.74.
Los alcistas tendrán que empujar el precio por encima de 0,57 dólares para indicar el inicio de un nuevo movimiento alcista. Luego, el par intentará subir a 0,67 dólares y posteriormente a la formidable resistencia de 0,74 dólares.
Cardano price analysis
Análisis de precios de Cardano
Cardano (ADA) is trying to take support at the 20-day EMA ($0.57), but the bears have not given up and are maintaining the selling pressure.
Cardano (ADA) está intentando conseguir soporte en la EMA de 20 días (0,57 dólares), pero los bajistas no se han rendido y mantienen la presión de venta.
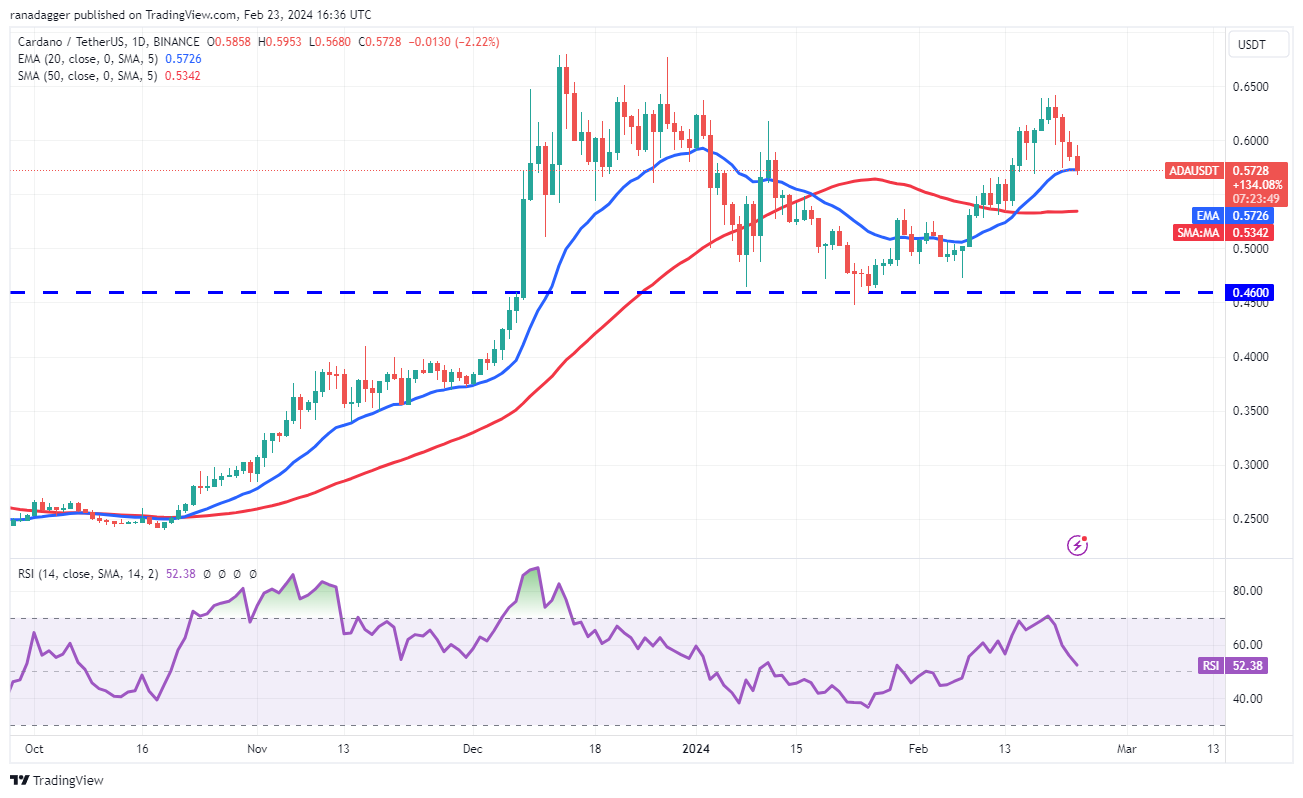
If the bears prevail, the ADA/USDT pair could skid to the 50-day SMA ($0.53). This is an important level for the bulls to defend because if this level gives way, the pair could plummet to the vital support at $0.46.
Si los bajistas prevalecen, el par ADA/USDT podría deslizarse hasta la SMA de 50 días ($0,53). Este es un nivel importante que deben defender los alcistas porque si este nivel cede, el par podría caer en picado hasta el soporte vital de 0,46 dólares.
On the contrary, if the price rebounds off the 20-day EMA with strength, it will suggest that the sentiment remains positive and traders are buying on dips. The bulls will then try to overcome the resistance zone between $0.64 and $0.68.
Por el contrario, si el precio rebota con fuerza en la EMA de 20 días, sugerirá que el sentimiento sigue siendo positivo y que los operadores están comprando en las caídas. Los alcistas intentarán entonces superar la zona de resistencia entre 0,64 y 0,68 dólares.
Avalanche price analysis
Análisis de precios de avalancha
Avalanche (AVAX) tried to start a recovery on Feb. 22, but the bears fiercely defended the 20-day EMA ($37.90). This suggests that recoveries are being sold into.
Avalanche (AVAX) intentó iniciar una recuperación el 22 de febrero, pero los bajistas defendieron ferozmente la EMA de 20 días ($37,90). Esto sugiere que se están vendiendo las recuperaciones.
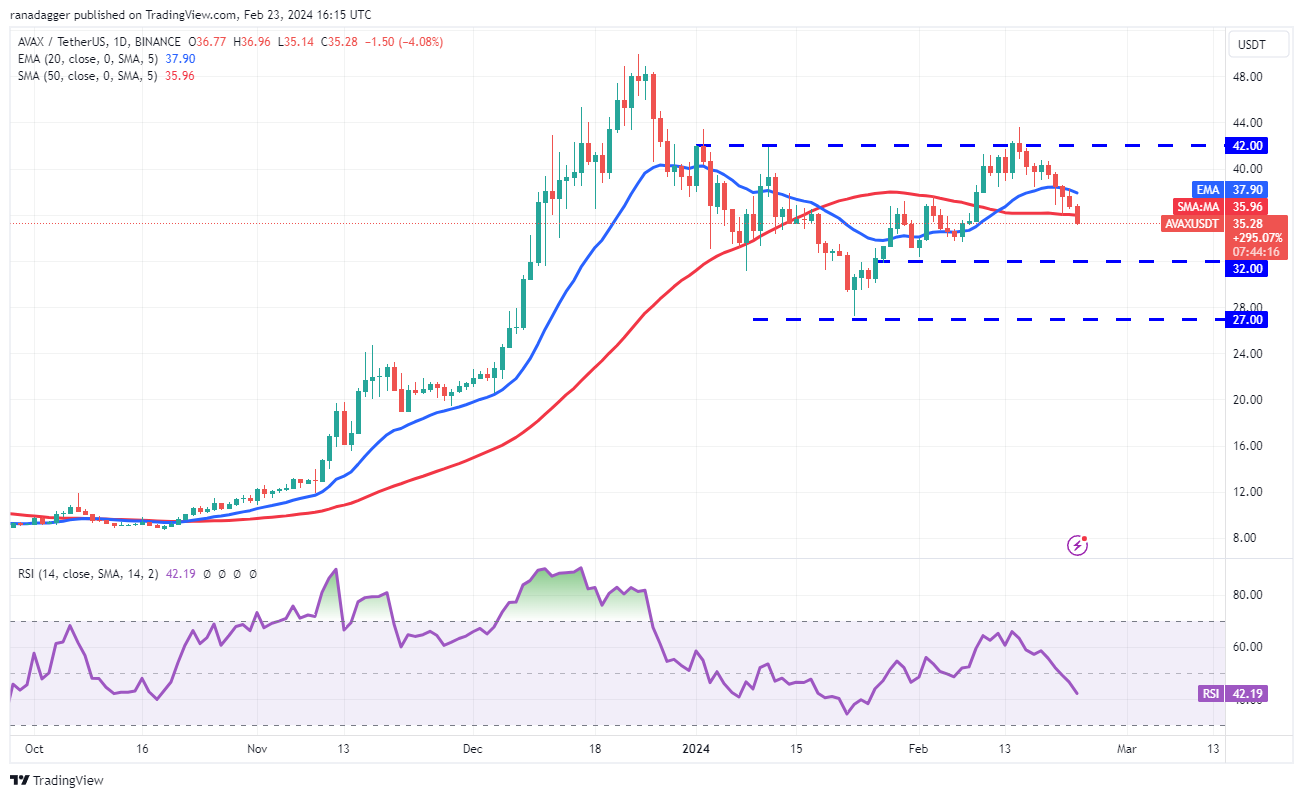
The bears continued selling on Feb. 23 and pulled the price below the 50-day SMA ($35.96). The AVAX/USDT pair could drop to the solid support at $32. A solid bounce off this level will suggest that the pair may oscillate between $32 and $42 for a while.
Los bajistas continuaron vendiendo el 23 de febrero y llevaron el precio por debajo de la SMA de 50 días ($35,96). El par AVAX/USDT podría caer al soporte sólido de $32. Un rebote sólido desde este nivel sugerirá que el par puede oscilar entre $32 y $42 por un tiempo.
Contrarily, if the price turns up from the current level and rises above the 20-day EMA, it will suggest strong buying at lower levels. The bulls will then attempt to drive the price above $42 and complete the inverse head-and-shoulders pattern.
Por el contrario, si el precio sube desde el nivel actual y supera la EMA de 20 días, sugerirá compras fuertes en niveles más bajos. Luego, los alcistas intentarán llevar el precio por encima de los 42 dólares y completar el patrón inverso de cabeza y hombros.
Related: Here’s what happened in crypto today
Relacionado: Esto es lo que sucedió hoy en las criptomonedas
Dogecoin price analysis
Análisis de precios de Dogecoin
The bulls are trying to maintain Dogecoin (DOGE) above the symmetrical triangle, while the bears are trying to pull the price back below it.
Los alcistas están tratando de mantener Dogecoin (DOGE) por encima del triángulo simétrico, mientras que los bajistas intentan hacer que el precio vuelva a estar por debajo de él.
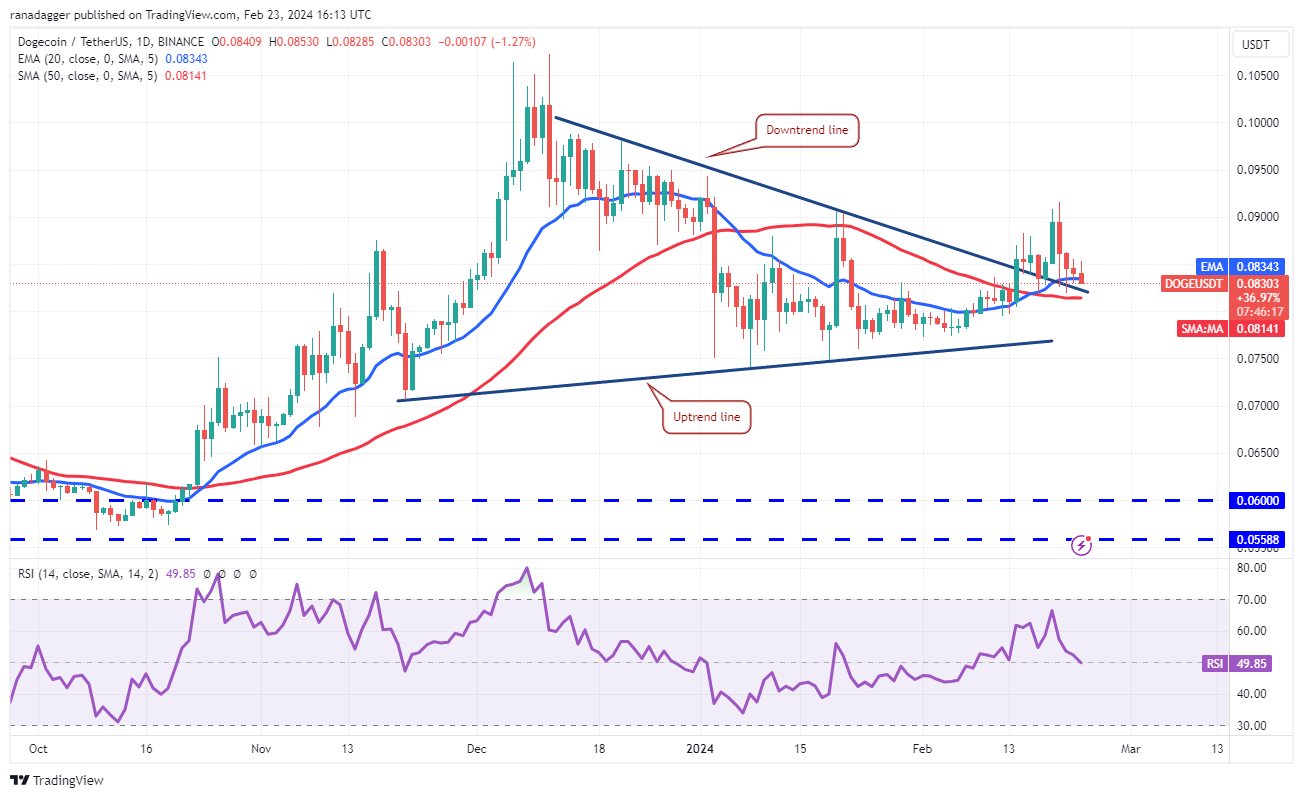
If the price rebounds off the current level, the bulls will try to propel the DOGE/USDT pair above the $0.09 resistance. If they succeed, the pair could start an uptrend toward the $0.10 to $0.11 resistance zone.
Si el precio rebota en el nivel actual, los alcistas intentarán impulsar el par DOGE/USDT por encima de la resistencia de $0,09. Si tienen éxito, el par podría iniciar una tendencia alcista hacia la zona de resistencia de $0,10 a $0,11.
This positive view will be invalidated in the near term if the price turns down and plummets below the 50-day SMA ($0.08). The pair could then slump to the uptrend line. A break below this level will tilt the advantage in favor of the bears.
Esta visión positiva quedará invalidada en el corto plazo si el precio baja y cae por debajo de la SMA de 50 días ($0,08). El par podría entonces caer hasta la línea de tendencia alcista. Una ruptura por debajo de este nivel inclinará la ventaja a favor de los bajistas.
Chainlink price analysis
Análisis de precios de cadena
Chainlink (LINK) has pulled back in an uptrend. The bears are trying to drag the price to the breakout level of $17.32.
Chainlink (LINK) ha retrocedido en una tendencia alcista. Los bajistas están tratando de arrastrar el precio al nivel de ruptura de 17,32 dólares.
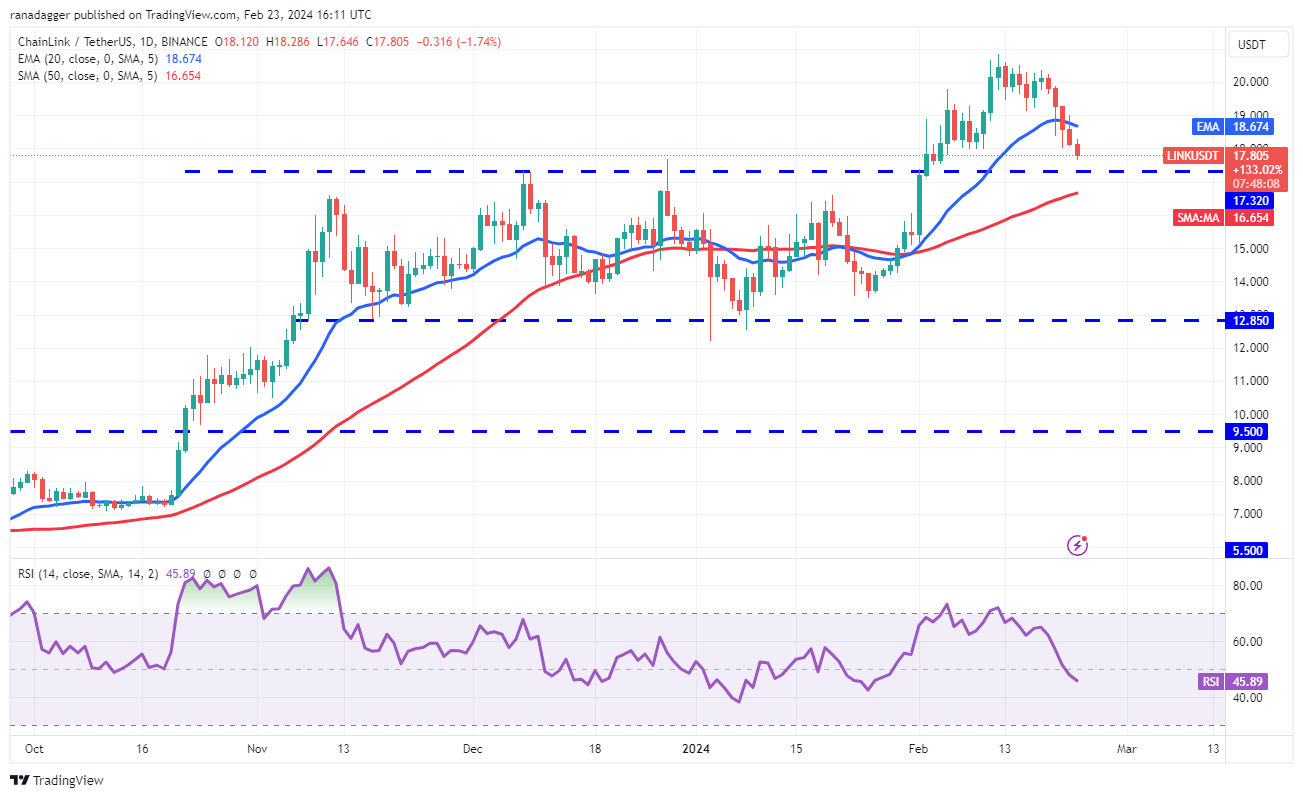
If the price rebounds off $17.32 with strength and rises above the 20-day EMA ($18.67), it will suggest that the bulls have flipped the level into support. That will increase the likelihood of a retest of $20.85.
Si el precio rebota con fuerza desde 17,32 dólares y sube por encima de la EMA de 20 días (18,67 dólares), sugerirá que los alcistas han convertido el nivel en soporte. Eso aumentará la probabilidad de una nueva prueba de $20,85.
The critical support to watch on the downside is the 50-day SMA ($16.65). If this level cracks, it will indicate that the bulls have given up. That may start a deeper correction to $15 and later to $12.85.
El soporte crítico a tener en cuenta a la baja es la SMA de 50 días ($16,65). Si este nivel se rompe, indicará que los alcistas se han rendido. Eso puede iniciar una corrección más profunda a 15 dólares y luego a 12,85 dólares.
Polkadot price analysis
Análisis de precios de lunares
The bulls are trying to keep Polkadot (DOT) inside the ascending channel pattern, while the bears are striving to pull the price below it.
Los alcistas están tratando de mantener a Polkadot (DOT) dentro del patrón del canal ascendente, mientras que los bajistas se esfuerzan por bajar el precio por debajo de él.
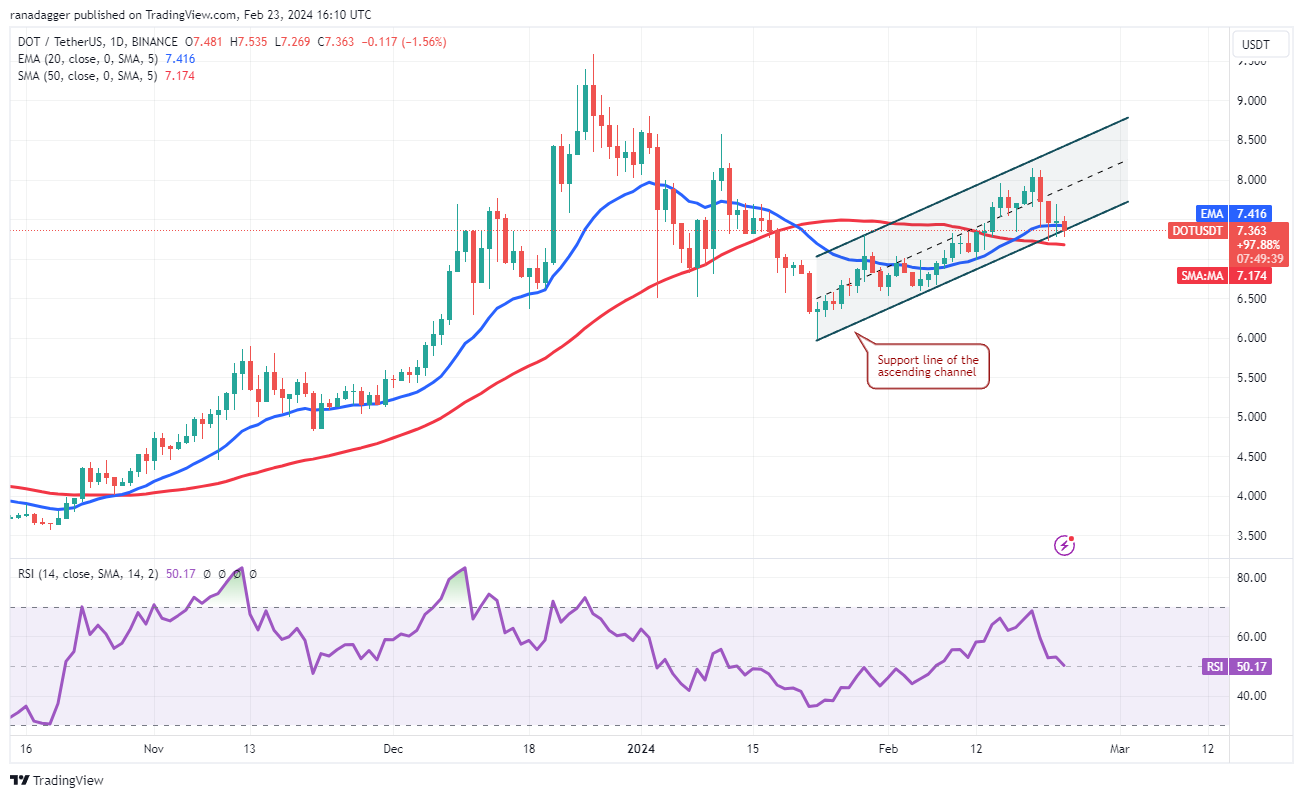
The flattish 20-day EMA ($7.41) and the RSI near the midpoint do not give a clear advantage either to the bulls or the bears. If the price breaks below the 50-day SMA ($7.17), the DOT/USDT pair could slide to $6.50.
La EMA plana de 20 días ($7,41) y el RSI cerca del punto medio no dan una ventaja clara ni a los alcistas ni a los bajistas. Si el precio cae por debajo de la SMA de 50 días ($7,17), el par DOT/USDT podría caer a $6,50.
On the other hand, a strong bounce off the current level will indicate that the bulls are fiercely defending the support line. That may keep the price inside the channel for some more time. The bulls will try to push the pair to the channel’s resistance line.
Por otro lado, un fuerte rebote desde el nivel actual indicará que los alcistas están defendiendo ferozmente la línea de soporte. Eso puede mantener el precio dentro del canal por más tiempo. Los alcistas intentarán empujar al par hacia la línea de resistencia del canal.
This article does not contain investment advice or recommendations. Every investment and trading move involves risk, and readers should conduct their own research when making a decision.
Este artículo no contiene consejos ni recomendaciones de inversión. Cada movimiento de inversión y comercio implica riesgos, y los lectores deben realizar su propia investigación al tomar una decisión.
 Crypto Daily™
 CaptainAltcoin
 Thecryptoupdates
 Crypto Intelligence
 CoinsProbe
 Crypto News Land
 DogeHome
 InsideBitcoin News
 Coin Edition


