Bitcoin (BTC) has been facing stiff resistance near $52,000, increasing the possibility of a short-term correction. The sideways action resulted in net outflows of roughly $36 million from the spot Bitcoin exchange-traded funds (ETFs) on Feb. 21, according to various sources, including BitMEX Research. However, the bleeding stalled on Feb. 22, and the day saw net inflows of about $251 million into the ETFs.
ビットコイン(BTC)は5万2000ドル付近の厳しい抵抗に直面しており、短期的な調整の可能性が高まっている。 BitMEX Researchを含むさまざまな情報源によると、この横ばいの動きにより、2月21日にはスポットビットコイン上場投資信託(ETF)から約3,600万ドルの純流出が生じたという。しかし、2月22日には出血が止まり、その日はETFに約2億5,100万ドルの純流入が見られた。
Some analysts believe the markets are ready for a pullback before the halving in April. Popular trader and analyst Rekt Capital said Bitcoin’s current bull phase is similar to the 2016 and 2020 bull runs. If history repeats itself, “a pre-halving retrace” followed by “a post halving reaccumulation period” is possible.
一部のアナリストは、市場は4月の半減期を前に反落の準備ができていると考えている。人気トレーダー兼アナリストのレクト・キャピタル氏は、ビットコインの現在の強気局面は2016年と2020年の強気相場に似ていると述べた。歴史が繰り返される場合、「半減前のリトレース」とそれに続く「半減後の再蓄積期間」が発生する可能性があります。
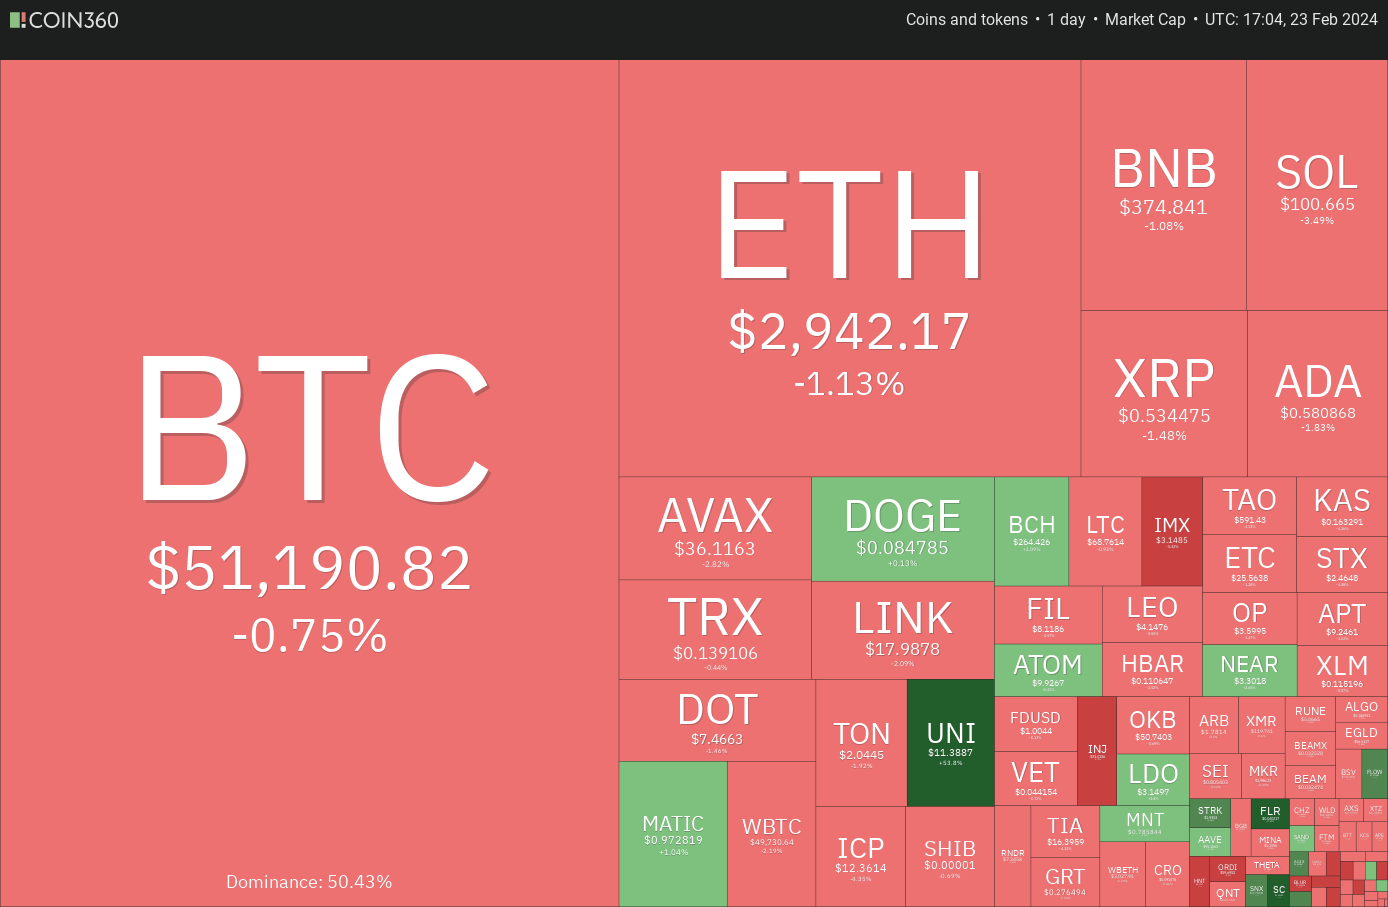
Bitcoin’s hesitation to continue its rally has triggered profit-booking in select altcoins. A corrective phase is positive for the long-term health of the markets as it shakes out the weak hands and allows the stronger hands to add at lower levels.
ビットコインが上昇を続けることをためらったことが、一部のアルトコインで利益確定の動きを引き起こした。調整フェーズは、弱いハンドを振り払い、より強いハンドがより低いレベルで追加できるようにするため、市場の長期的な健全性にとってプラスです。
What are the crucial support levels to watch out for on the downside in Bitcoin and altcoins? Let’s analyze the charts of the top 10 cryptocurrencies to find out.
ビットコインとアルトコインの下落時に注意すべき重要なサポートレベルは何ですか?それを知るために、トップ 10 の仮想通貨のチャートを分析してみましょう。
Bitcoin price analysis
ビットコイン価格分析
The long tail on Bitcoin’s Nov. 21 candlestick shows that the bulls purchased the dip to the immediate support of $50,625, but could not overcome the barrier at $52,000.
ビットコインの11月21日のローソク足のロングテールは、強気派が当面のサポートである50,625ドルまで押し目を購入したが、52,000ドルの壁を超えることができなかったことを示している。
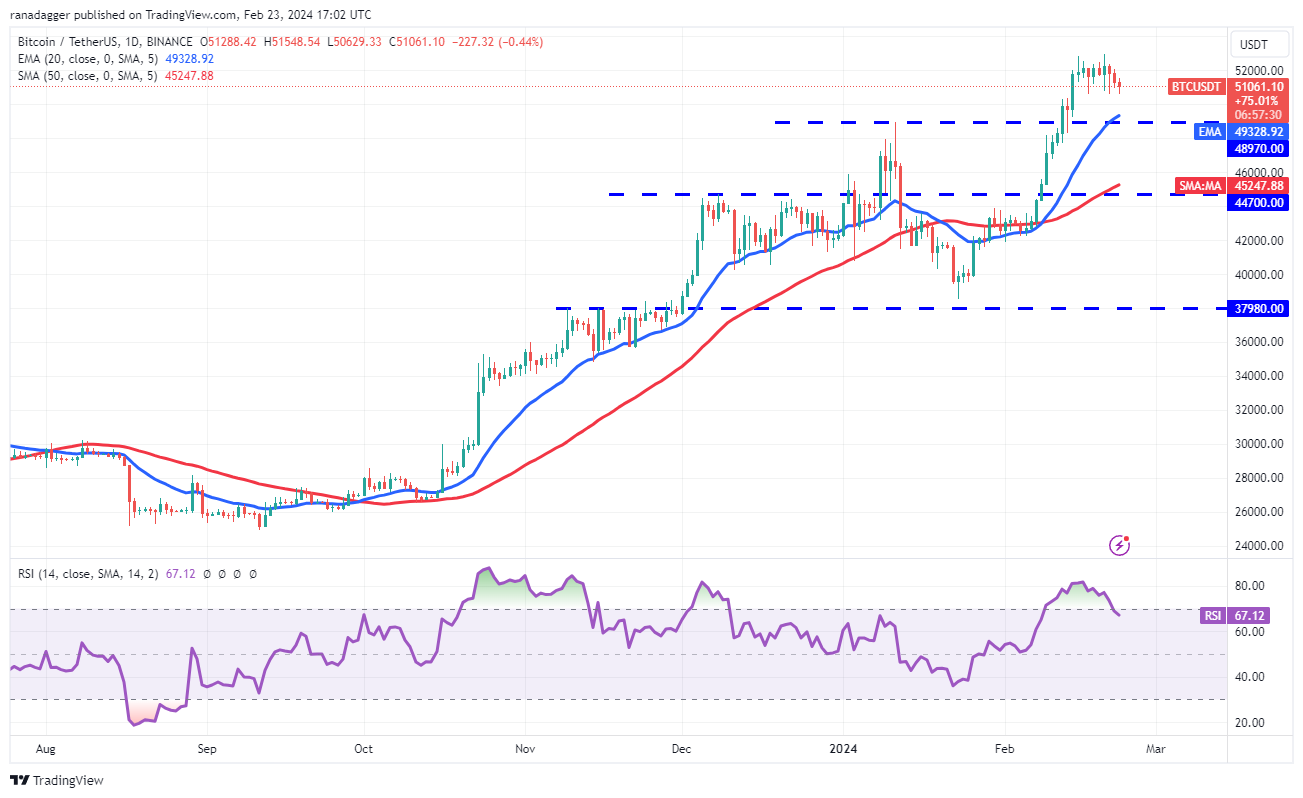
The bears will again try to yank the price below $50,625. If they can pull it off, the BTC/USDT pair could plunge to the strong support at $48,970. A bounce off this level will indicate that the sentiment remains bullish and traders are buying on dips. The uptrend will resume on a break above $52,000. The pair could then reach $60,000.
弱気派は再び価格を50,625ドル以下に引き下げようとするだろう。それができれば、BTC/USDTペアは48,970ドルの強力なサポートまで急落する可能性がある。この水準からの反発は、地合いが引き続き強気でトレーダーが押し目買いをしていることを示すだろう。上昇トレンドは52,000ドルを超えると再開するだろう。そうすれば、ペアは60,000ドルに達する可能性があります。
However, the bears are likely to have other plans. They will try to pull the price below $48,970. If they do that, the selling could intensify, and the pair may nosedive to the 50-day SMA ($45,247).
しかし、クマたちは別の計画を持っている可能性が高い。彼らは価格を48,970ドル以下に引き下げようとするだろう。そうなれば売りが激化し、50日間SMA(4万5247ドル)まで急落する可能性がある。
Ether price analysis
イーサ価格分析
Ether (ETH) tried to jump above the psychological resistance of $3,000 on Feb. 22, but the bears held their ground.
イーサ(ETH)は2月22日に心理的抵抗である3,000ドルを超えようとしたが、弱気派は踏みとどまった。
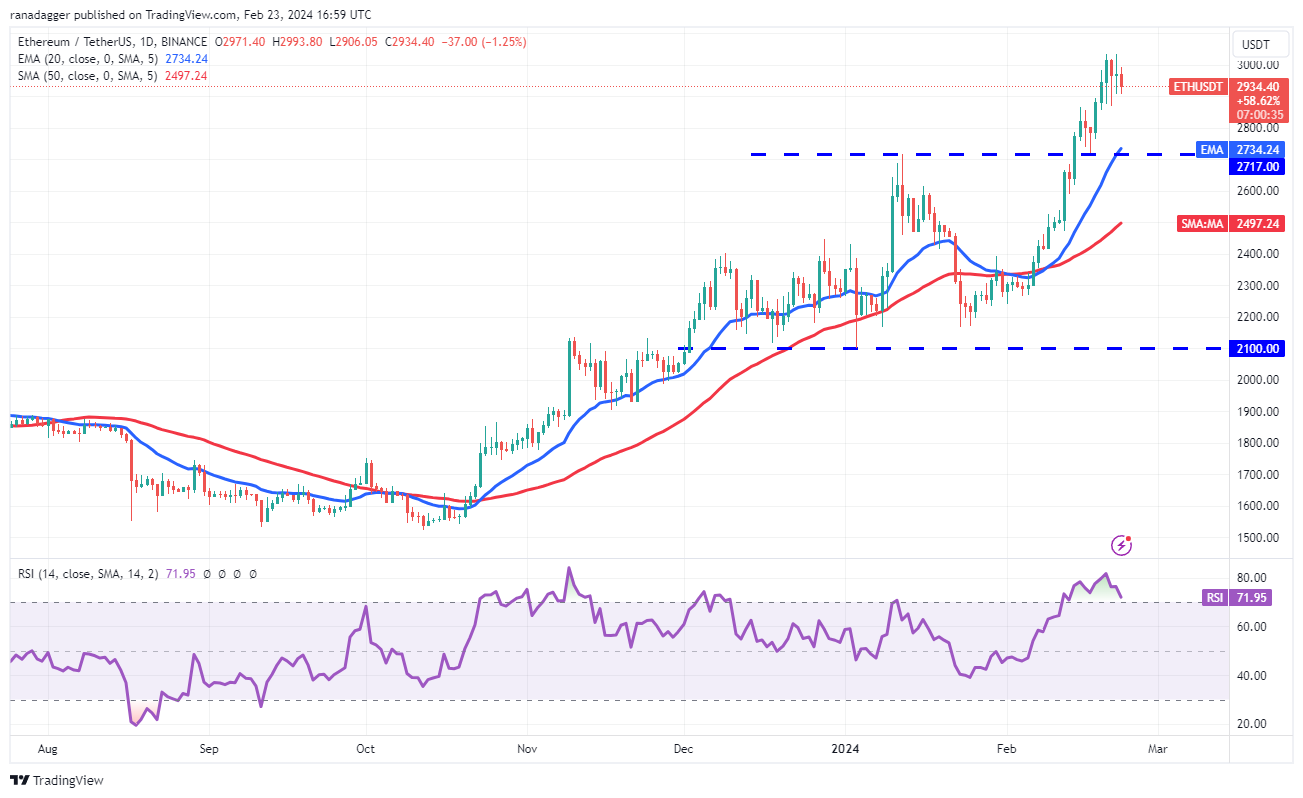
Sellers are trying to start a correction toward the breakout level of $2,717. This is an important level to watch out for because the 20-day EMA ($2,734) is nearby. If the price rebounds off $2,717 with force, it will indicate that the bulls have flipped the level into support. The bulls will then again attempt to clear the hurdle at $3,000. If they succeed, the ETH/USDT pair may reach $3,300.
売り手は2,717ドルのブレイクアウトレベルに向けて調整を開始しようとしている。 20日間EMA(2,734ドル)が近くにあるため、これは注意すべき重要なレベルです。価格が2,717ドルから勢いよく反発した場合、それは強気派がそのレベルをサポートに反転させたことを示すでしょう。その後、強気派は再び3,000ドルのハードルを越えようとするだろう。成功すれば、ETH/USDTペアは3,300ドルに達する可能性がある。
The bears will have to tug and maintain the price below $2,717 to weaken the bulls. The pair may then tumble to the 50-day SMA ($2,497). Such a deeper fall could delay the start of the next leg of the uptrend.
弱気派は強気派を弱めるために価格を2,717ドル以下に維持する必要がある。その後、ペアは50日間SMA(2,497ドル)まで下落する可能性がある。このように下落が深くなると、上昇トレンドの次の区間の開始が遅れる可能性があります。
BNB price analysis
BNB価格分析
BNB (BNB) resumed its uptrend after breaking above the $367 resistance on Feb. 21. The next target objective on the upside is $400.
BNB (BNB) は、2 月 21 日に 367 ドルの抵抗線を突破した後、上昇トレンドを再開しました。次の上昇目標は 400 ドルです。
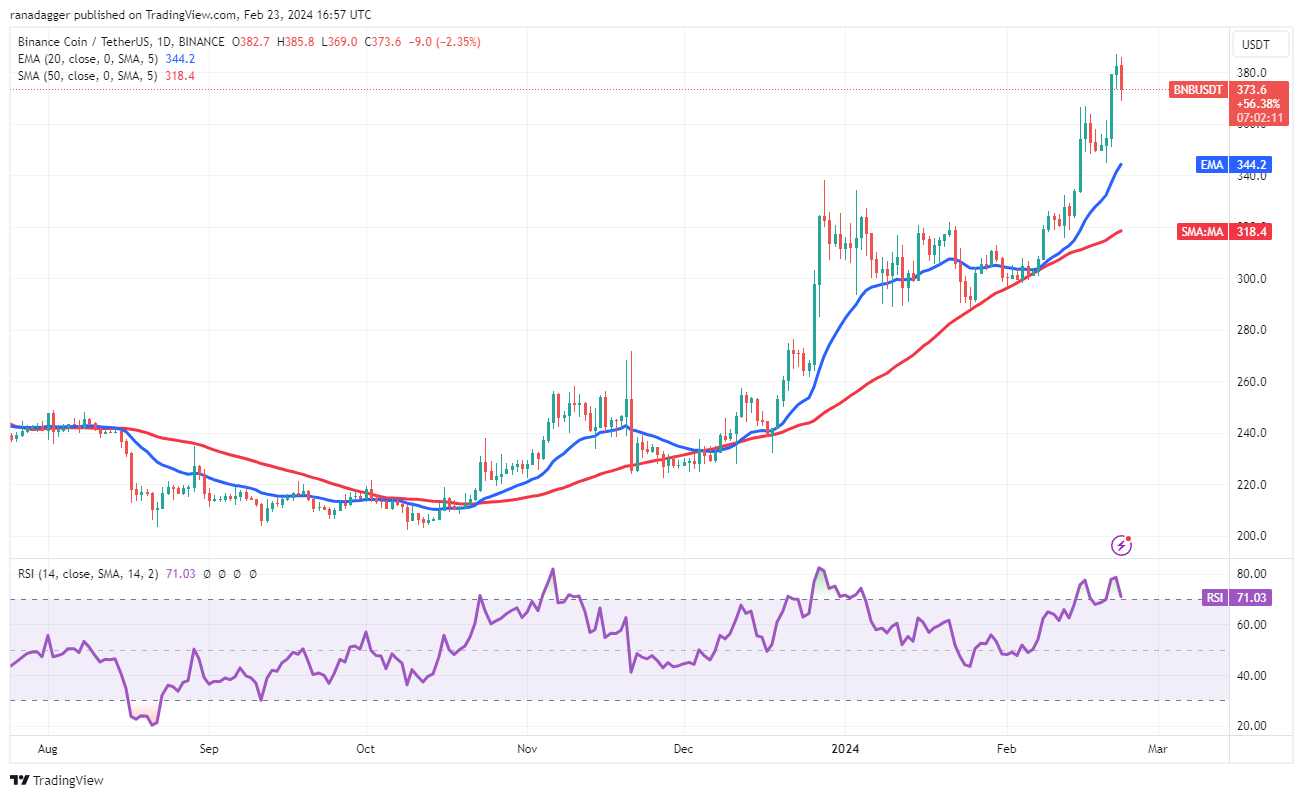
The bears will try to stall the up move at $400, but if the bulls do not give up much ground from the level, it will indicate that every minor dip is being bought. That will improve the prospects of a rally to $460.
弱気派は400ドルでの上昇を阻止しようとするだろうが、強気派がその水準から大きく譲歩しなければ、あらゆる小さな押し目は買われていることを示すことになるだろう。これにより、460ドルまで上昇する可能性が高まるだろう。
The first support on the downside is $368, and then the 20-day EMA ($344). If the supports fail to hold, the correction could reach the 50-day SMA ($318). This is an essential level for the bulls to defend because a break below it will signal a trend change.
下値の最初のサポートは 368 ドルで、次に 20 日間 EMA (344 ドル) です。サポートが維持できなければ、調整は50日間のSMA(318ドル)に達する可能性がある。これを下回るとトレンドの変化を示すため、強気派にとってこれは守るために不可欠なレベルです。
Solana price analysis
ソラナの価格分析
Solana (SOL) bounced off the 50-day SMA ($99) on Feb. 21, but the bulls could not push the price above the 20-day EMA ($105).
ソラナ(SOL)は2月21日に50日間SMA(99ドル)から反発したが、強気派は価格を20日間EMA(105ドル)を超えることができなかった。
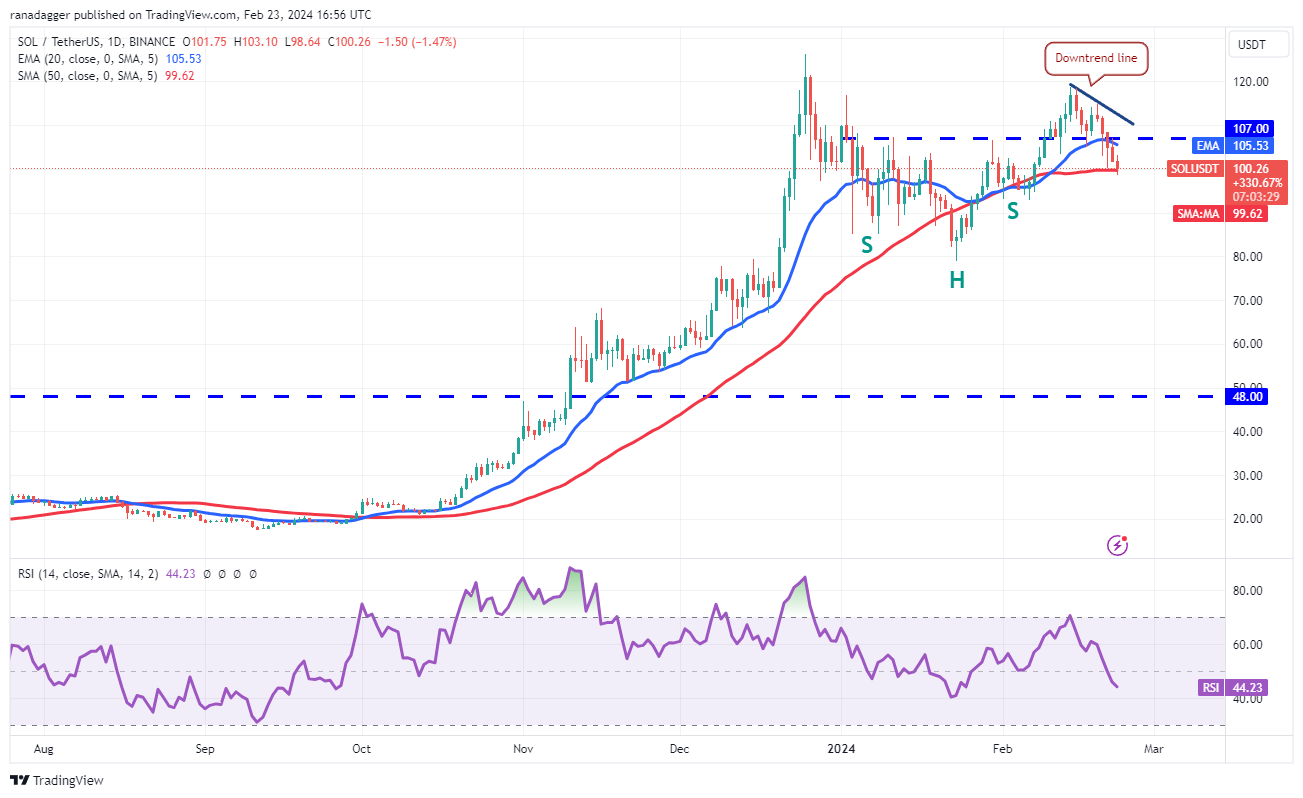
The bears will try to strengthen their position by pulling the price below the 50-day SMA. If they do that, the SOL/USDT pair could descend to $93 and then to $80. This level is likely to attract aggressive buying by the bulls.
弱気派は価格を50日間のSMAを下回ることでポジションを強化しようとするだろう。そうなれば、SOL/USDTペアは93ドル、そして80ドルに下落する可能性がある。この水準は強気派による積極的な買いを呼び込む可能性が高い。
On the upside, the bulls will have to overcome the barrier at the downtrend line to signal that the correction may be over. The pair could then attempt a rally to $126, where the bears are likely to mount a strong defense.
上昇局面では、強気派は調整が終わった可能性を示すために下降トレンドラインの障壁を乗り越える必要があるだろう。その後、ペアは126ドルへの上昇を試みる可能性があり、弱気派は強力な防御を開始する可能性が高い。
XRP price analysis
XRP価格分析
XRP (XRP) formed an inside-day candlestick pattern on Feb. 22, indicating indecision between the buyers and sellers. This uncertainty resolved to the downside on Feb. 23, suggesting that the bears had overpowered the bulls.
XRP(XRP)は2月22日に日中のローソク足パターンを形成し、買い手と売り手の間の優柔不断を示しました。この不確実性は2月23日に下向きに解消され、弱気派が強気派を圧倒したことを示唆した。
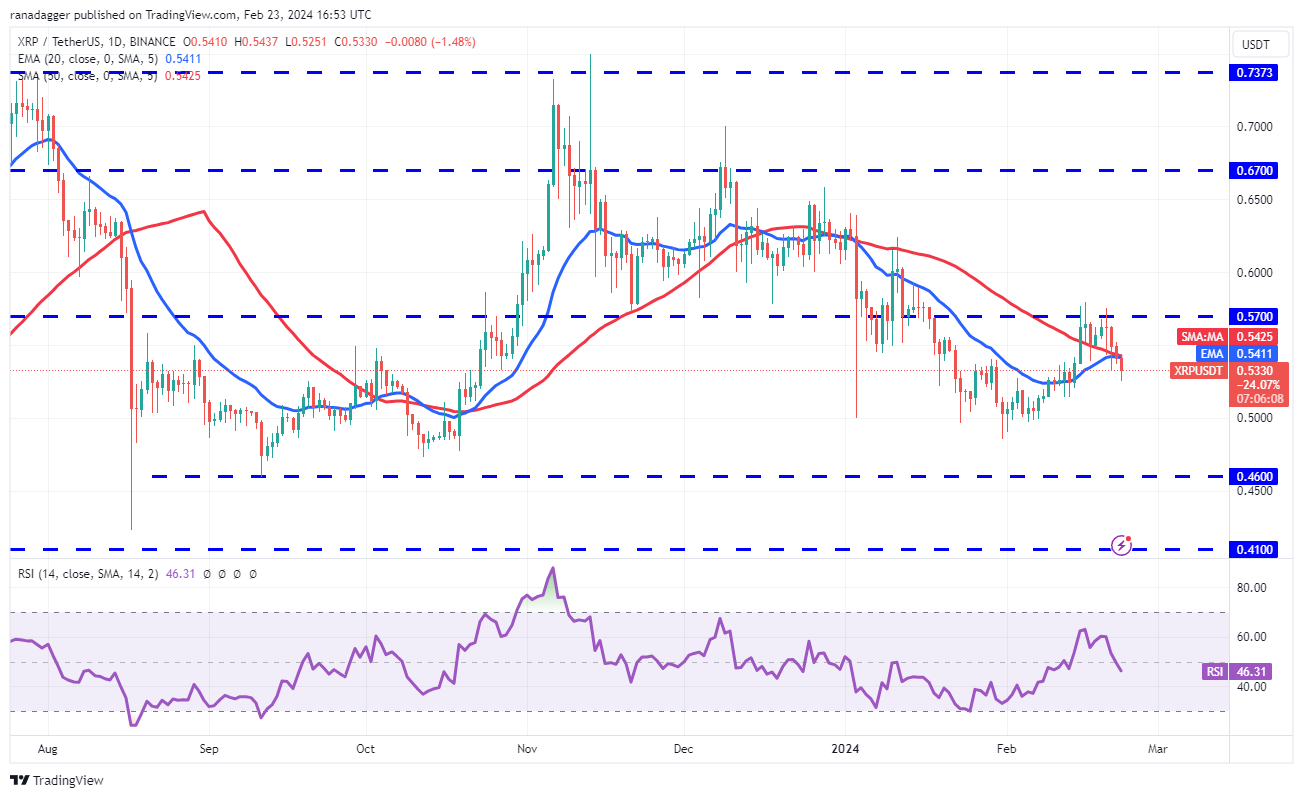
The bears will try to sink the pair to the strong support zone between $0.48 and $0.46. A strong rebound of this zone suggests that the XRP/USDT pair remains range-bound between $0.46 and $0.57 for a few days.
弱気派はペアを0.48ドルから0.46ドルの間の強いサポートゾーンに沈めようとするだろう。このゾーンの力強い反発は、XRP/USDTペアが数日間、0.46ドルから0.57ドルの範囲内で推移することを示唆しています。
The bulls will have to shove the price above $0.57 to indicate the start of a new up move. The pair will then attempt a rally to $0.67 and subsequently to the formidable resistance at $0.74.
強気派は新たな上昇の開始を示すために価格を0.57ドル以上に押し上げる必要があるだろう。その後、ペアは0.67ドルへの上昇を試み、その後0.74ドルの強力な抵抗線への上昇を試みるだろう。
Cardano price analysis
カルダノの価格分析
Cardano (ADA) is trying to take support at the 20-day EMA ($0.57), but the bears have not given up and are maintaining the selling pressure.
カルダノ(ADA)は20日間EMA(0.57ドル)でサポートを獲得しようとしているが、弱気派は諦めておらず、売り圧力を維持している。
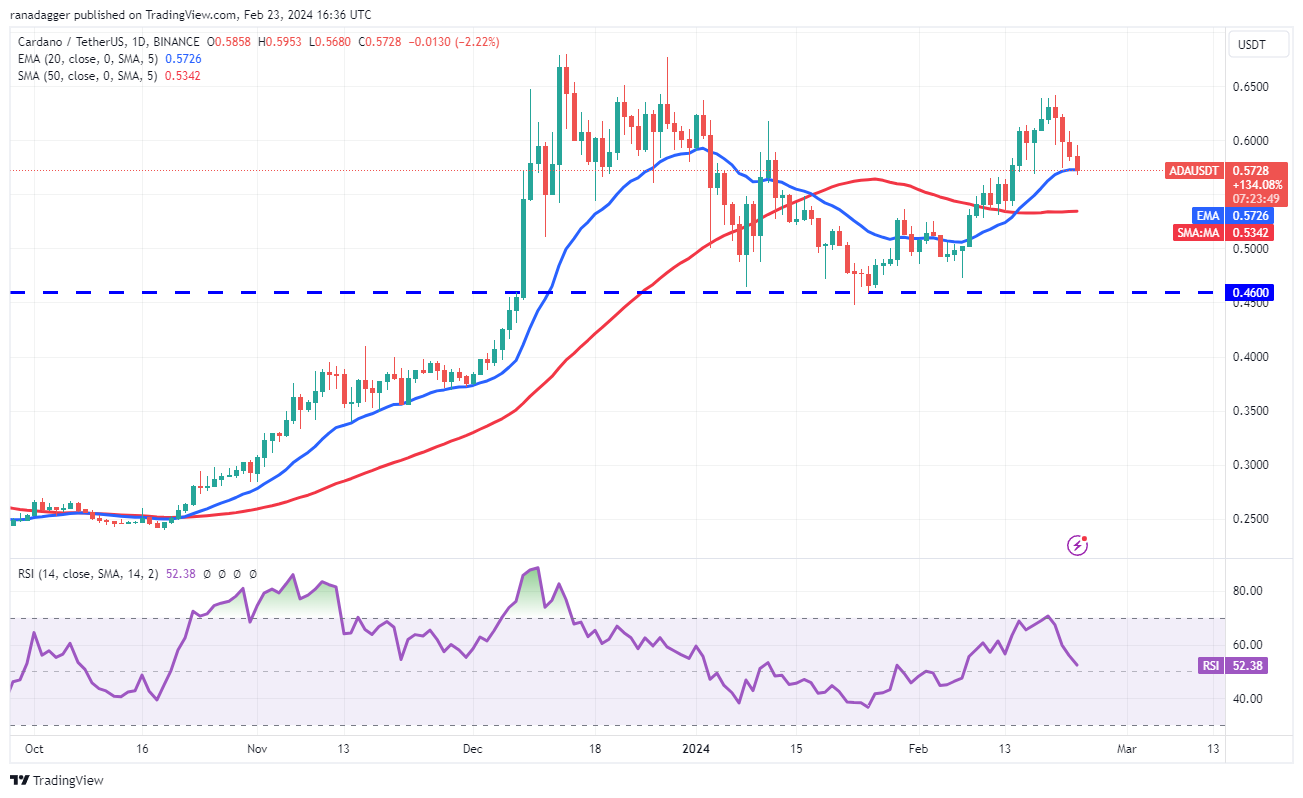
If the bears prevail, the ADA/USDT pair could skid to the 50-day SMA ($0.53). This is an important level for the bulls to defend because if this level gives way, the pair could plummet to the vital support at $0.46.
弱気派が優勢であれば、ADA/USDTペアは50日間SMA(0.53ドル)まで下落する可能性がある。このレベルが崩れると、通貨ペアは重要なサポートである0.46ドルまで急落する可能性があるため、これは強気派にとって守るべき重要なレベルである。
On the contrary, if the price rebounds off the 20-day EMA with strength, it will suggest that the sentiment remains positive and traders are buying on dips. The bulls will then try to overcome the resistance zone between $0.64 and $0.68.
逆に、価格が20日間EMAから力強く反発した場合、センチメントは引き続きポジティブであり、トレーダーが押し目買いをしていることを示唆するでしょう。その後、強気派は0.64ドルから0.68ドルの間の抵抗ゾーンを乗り越えようとするだろう。
Avalanche price analysis
雪崩価格分析
Avalanche (AVAX) tried to start a recovery on Feb. 22, but the bears fiercely defended the 20-day EMA ($37.90). This suggests that recoveries are being sold into.
アバランチ(AVAX)は2月22日に回復を始めようとしたが、弱気派は20日間EMA(37.90ドル)を激しく守った。これは回収が売り込まれていることを示唆している。
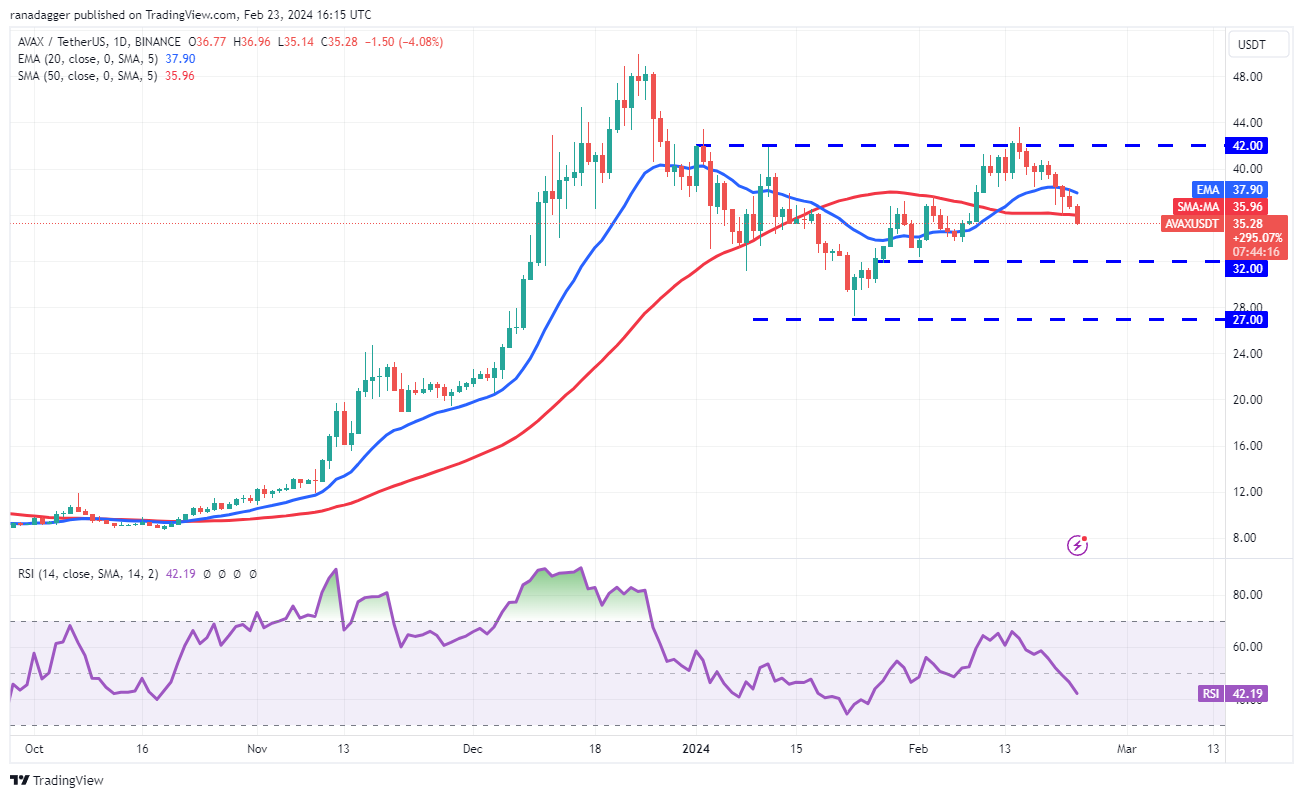
The bears continued selling on Feb. 23 and pulled the price below the 50-day SMA ($35.96). The AVAX/USDT pair could drop to the solid support at $32. A solid bounce off this level will suggest that the pair may oscillate between $32 and $42 for a while.
弱気派は2月23日も売りを続け、価格を50日間SMA(35.96ドル)以下に引き下げた。 AVAX/USDTペアは32ドルの堅調なサポートまで下落する可能性がある。このレベルからの堅調な反発は、ペアがしばらくの間32ドルから42ドルの間で変動する可能性があることを示唆しています。
Contrarily, if the price turns up from the current level and rises above the 20-day EMA, it will suggest strong buying at lower levels. The bulls will then attempt to drive the price above $42 and complete the inverse head-and-shoulders pattern.
逆に、価格が現在のレベルから上昇し、20日間EMAを上回った場合は、より低いレベルでの強い買いが示唆されるでしょう。その後、強気派は価格を42ドル以上に引き上げようとし、逆ヘッドアンドショルダーパターンを完成させるだろう。
Related: Here’s what happened in crypto today
関連:今日暗号通貨で何が起こったか
Dogecoin price analysis
ドージコインの価格分析
The bulls are trying to maintain Dogecoin (DOGE) above the symmetrical triangle, while the bears are trying to pull the price back below it.
強気派はドージコイン(DOGE)を対称三角形よりも上に維持しようとしていますが、弱気派は価格をそれより下に戻そうとしています。
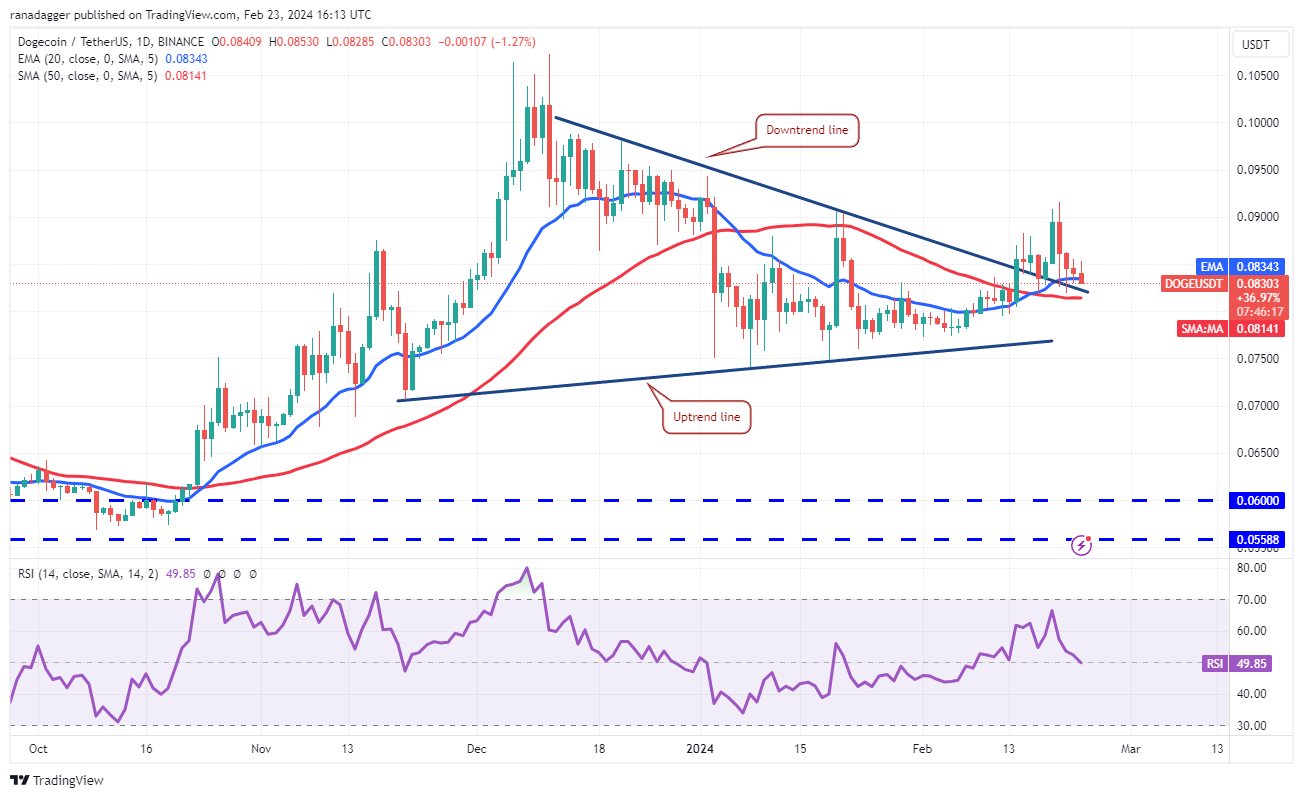
If the price rebounds off the current level, the bulls will try to propel the DOGE/USDT pair above the $0.09 resistance. If they succeed, the pair could start an uptrend toward the $0.10 to $0.11 resistance zone.
価格が現在の水準から反発した場合、強気派はDOGE/USDTペアを0.09ドルの抵抗線を超えて押し上げようとするだろう。それが成功すれば、ペアは0.10ドルから0.11ドルのレジスタンスゾーンに向けて上昇トレンドを開始する可能性があります。
This positive view will be invalidated in the near term if the price turns down and plummets below the 50-day SMA ($0.08). The pair could then slump to the uptrend line. A break below this level will tilt the advantage in favor of the bears.
価格が下落に転じ、50日間SMA(0.08ドル)を下回ると、この前向きな見方は短期的には無効になるだろう。その後、ペアは上昇トレンドラインまで下落する可能性があります。このレベルを下回ると、優位性は弱気派に有利に傾くでしょう。
Chainlink price analysis
チェーンリンクの価格分析
Chainlink (LINK) has pulled back in an uptrend. The bears are trying to drag the price to the breakout level of $17.32.
チェーンリンク(LINK)は上昇トレンドを引き戻しました。弱気派は価格を17.32ドルのブレイクアウトレベルまで引きずり込もうとしている。
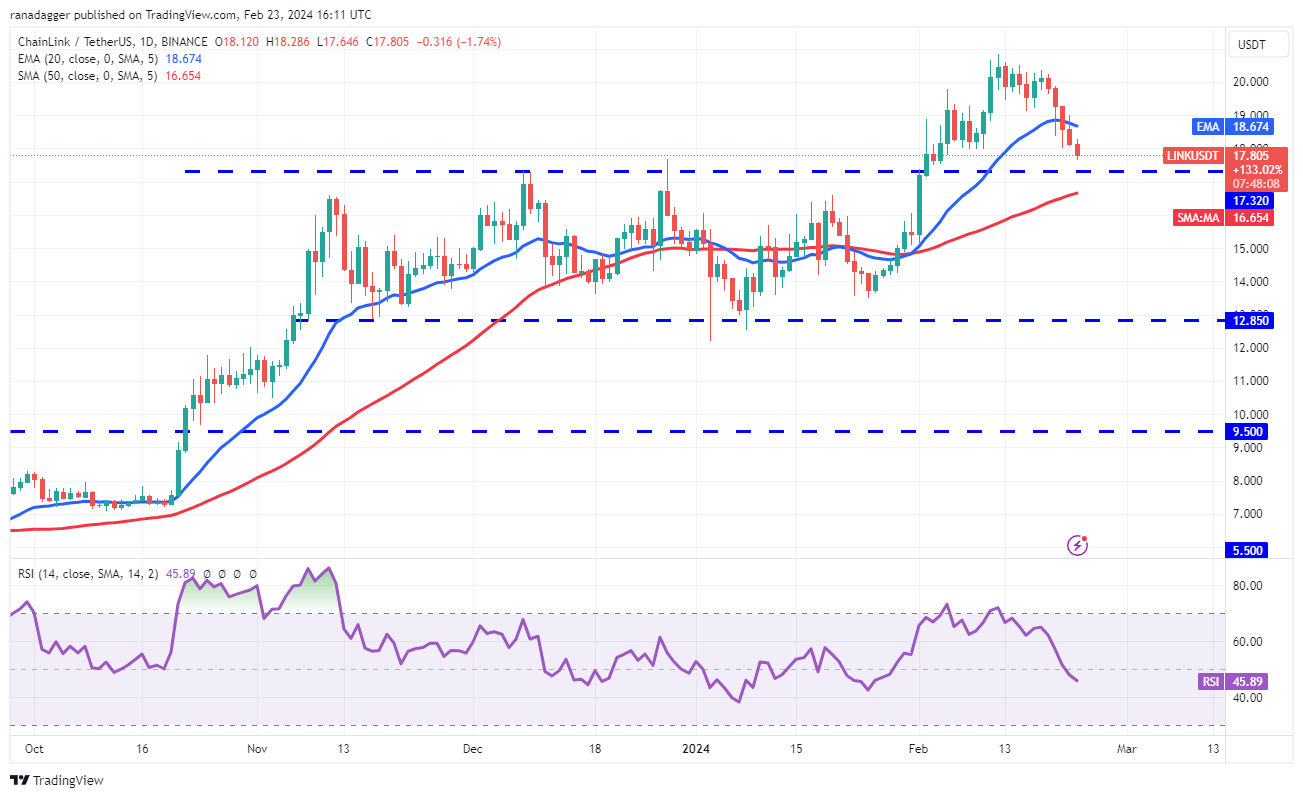
If the price rebounds off $17.32 with strength and rises above the 20-day EMA ($18.67), it will suggest that the bulls have flipped the level into support. That will increase the likelihood of a retest of $20.85.
価格が17.32ドルから勢いよく反発し、20日間EMA(18.67ドル)を上回った場合、強気派がその水準をサポートに反転させたことを示唆するだろう。そうなると20.85ドルの再テストの可能性が高まる。
The critical support to watch on the downside is the 50-day SMA ($16.65). If this level cracks, it will indicate that the bulls have given up. That may start a deeper correction to $15 and later to $12.85.
下値で注目すべき重要なサポートは、50 日間 SMA (16.65 ドル) です。このレベルが割れた場合、それは強気派が諦めたことを示すでしょう。これにより、15ドルへのさらなる調整が始まり、その後は12.85ドルへの調整が始まる可能性がある。
Polkadot price analysis
水玉価格分析
The bulls are trying to keep Polkadot (DOT) inside the ascending channel pattern, while the bears are striving to pull the price below it.
強気派はポルカドット(DOT)を上昇チャネルパターン内に留めようとしているが、弱気派は価格をそれ以下に引き下げようと努めている。
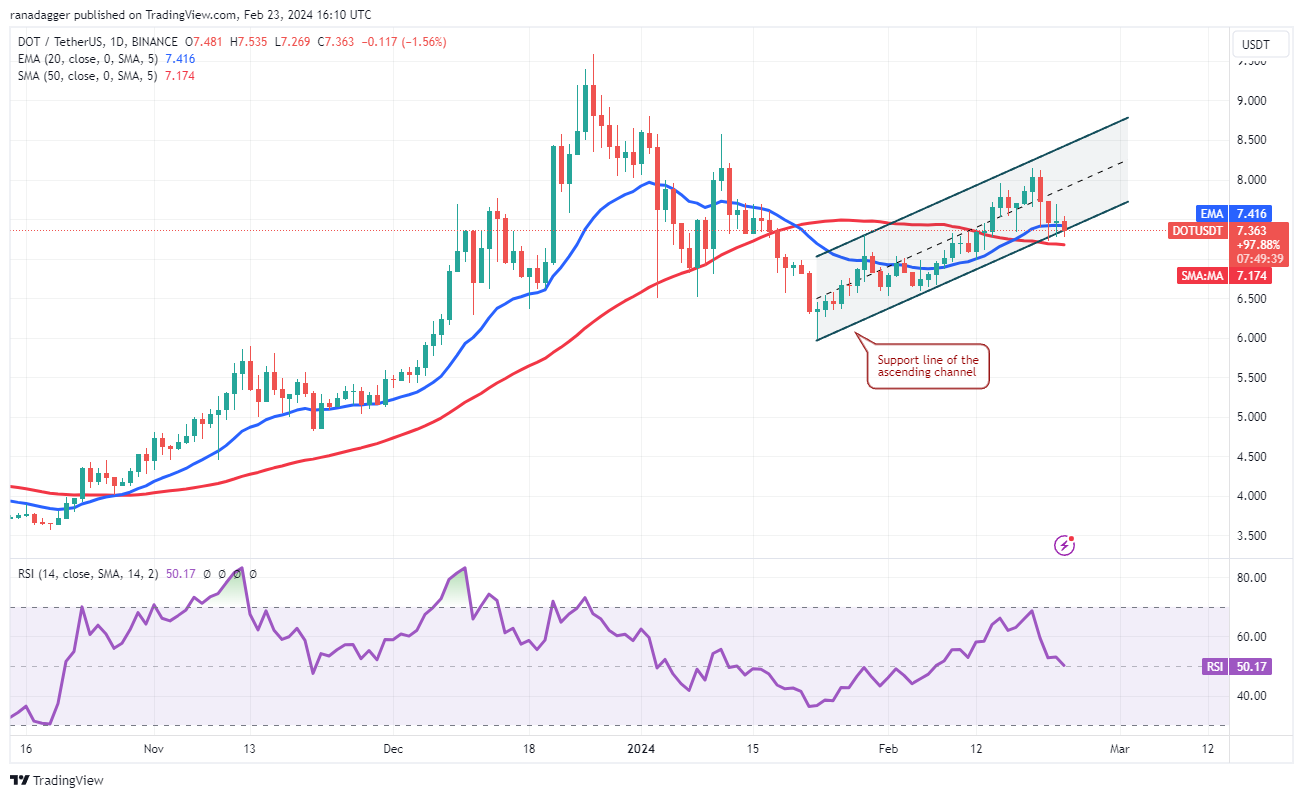
The flattish 20-day EMA ($7.41) and the RSI near the midpoint do not give a clear advantage either to the bulls or the bears. If the price breaks below the 50-day SMA ($7.17), the DOT/USDT pair could slide to $6.50.
平坦な20日間EMA(7.41ドル)と中間点付近のRSIは、強気派にも弱気派にも明らかな優位性を与えていない。価格が50日SMA(7.17ドル)を下回った場合、DOT/USDTペアは6.50ドルまで下落する可能性がある。
On the other hand, a strong bounce off the current level will indicate that the bulls are fiercely defending the support line. That may keep the price inside the channel for some more time. The bulls will try to push the pair to the channel’s resistance line.
一方、現在のレベルから大きく反発した場合は、強気派がサポートラインを激しく守っていることを示します。そうすれば、価格はしばらくチャネル内にとどまる可能性がある。強気派はペアをチャネルのレジスタンスラインまで押し上げようとするだろう。
This article does not contain investment advice or recommendations. Every investment and trading move involves risk, and readers should conduct their own research when making a decision.
この記事には投資に関するアドバイスや推奨事項は含まれません。あらゆる投資や取引の動きにはリスクが伴うため、読者は決定を下す際に独自の調査を行う必要があります。


 Bitop Exchange
 Crypto News Land
 DogeHome
 TheCoinrise Media
 Coin Edition
 BlockchainReporter
 TheNewsCrypto
 Optimisus
 Coin Edition


