

Bitcoin (BTC) has been facing stiff resistance near $52,000, increasing the possibility of a short-term correction. The sideways action resulted in net outflows of roughly $36 million from the spot Bitcoin exchange-traded funds (ETFs) on Feb. 21, according to various sources, including BitMEX Research. However, the bleeding stalled on Feb. 22, and the day saw net inflows of about $251 million into the ETFs.
比特幣(BTC)一直面臨52,000美元附近的強勁阻力,增加了短期回檔的可能性。據包括 BitMEX Research 在內的多個消息來源稱,2 月 21 日,橫向走勢導致現貨比特幣交易所交易基金 (ETF) 淨流出約 3,600 萬美元。然而,出血在 2 月 22 日停止,當天 ETF 淨流入約 2.51 億美元。
Some analysts believe the markets are ready for a pullback before the halving in April. Popular trader and analyst Rekt Capital said Bitcoin’s current bull phase is similar to the 2016 and 2020 bull runs. If history repeats itself, “a pre-halving retrace” followed by “a post halving reaccumulation period” is possible.
一些分析師認為,市場已做好在四月減半前回檔的準備。知名交易員兼分析師 Rekt Capital 表示,比特幣目前的牛市階段與 2016 年和 2020 年的多頭階段類似。如果歷史重演,「減半前的回撤」和「減半後的重新累積期」是可能的。
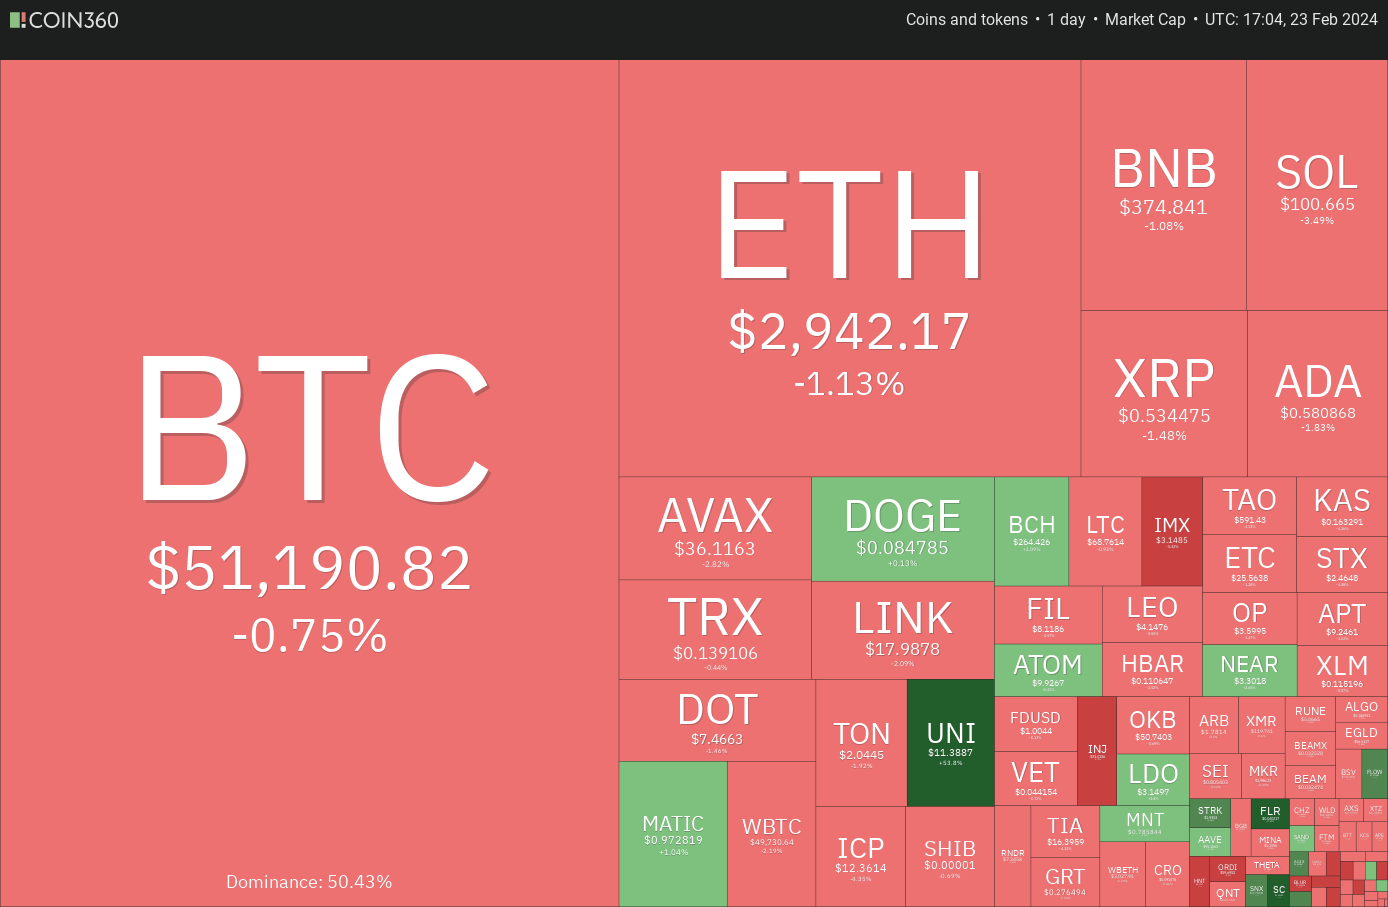
Bitcoin’s hesitation to continue its rally has triggered profit-booking in select altcoins. A corrective phase is positive for the long-term health of the markets as it shakes out the weak hands and allows the stronger hands to add at lower levels.
比特幣對持續上漲的猶豫引發了部分山寨幣的獲利盤。修正階段對於市場的長期健康是積極的,因為它可以擺脫弱勢者,並允許強勢者在較低水平上加倉。
What are the crucial support levels to watch out for on the downside in Bitcoin and altcoins? Let’s analyze the charts of the top 10 cryptocurrencies to find out.
比特幣和山寨幣下跌時需要注意的關鍵支撐位是什麼?讓我們分析一下前 10 名加密貨幣的圖表來找出答案。
Bitcoin price analysis
比特幣價格分析
The long tail on Bitcoin’s Nov. 21 candlestick shows that the bulls purchased the dip to the immediate support of $50,625, but could not overcome the barrier at $52,000.
比特幣 11 月 21 日燭台上的長尾表明,多頭在 50,625 美元的直接支撐位逢低買入,但無法突破 52,000 美元的障礙。
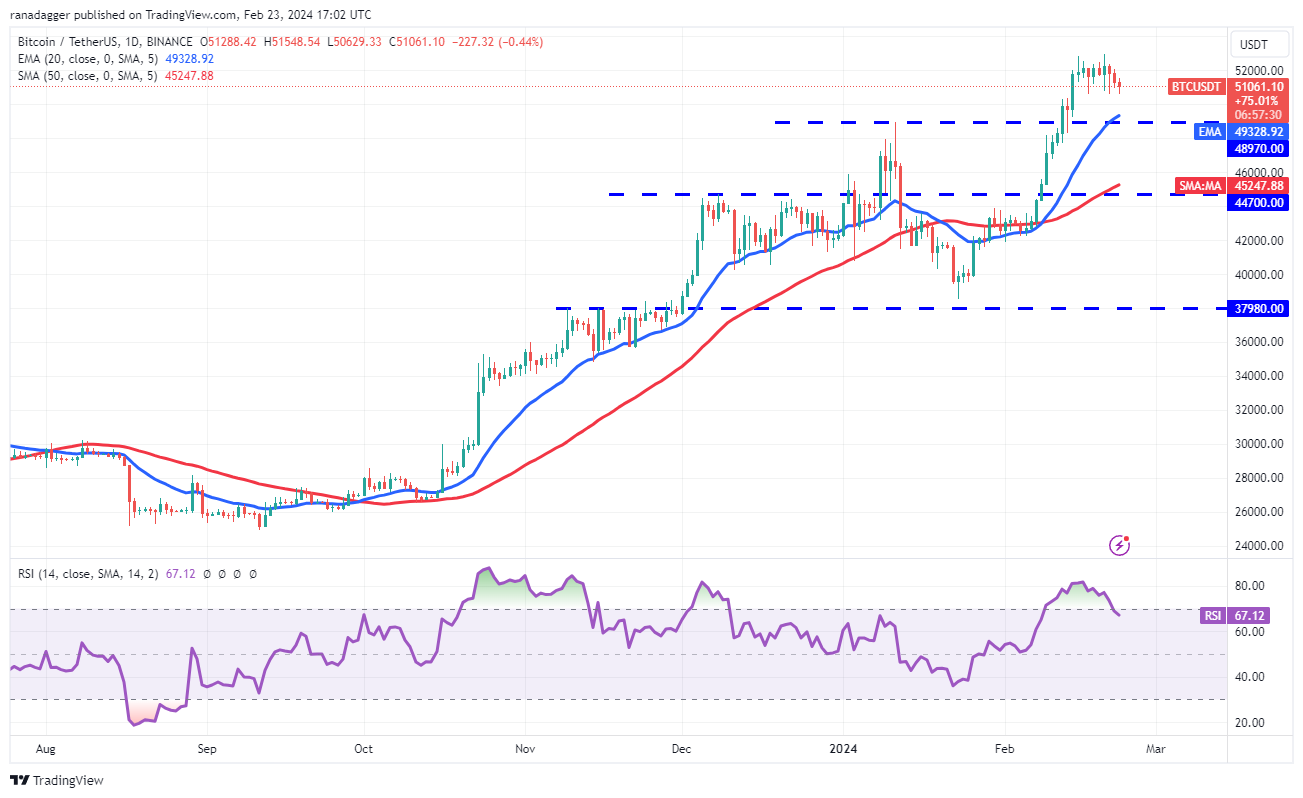
The bears will again try to yank the price below $50,625. If they can pull it off, the BTC/USDT pair could plunge to the strong support at $48,970. A bounce off this level will indicate that the sentiment remains bullish and traders are buying on dips. The uptrend will resume on a break above $52,000. The pair could then reach $60,000.
空頭將再次試圖將價格拉至 50,625 美元以下。如果他們能夠成功,BTC/USDT 貨幣對可能會跌至 48,970 美元的強勁支撐位。從該水平反彈將表明市場情緒仍然看漲,交易者正在逢低買入。突破 52,000 美元後,上漲趨勢將恢復。然後兩人的價格可能會達到 6 萬美元。
However, the bears are likely to have other plans. They will try to pull the price below $48,970. If they do that, the selling could intensify, and the pair may nosedive to the 50-day SMA ($45,247).
然而,空頭可能還有其他計劃。他們將努力將價格拉低至 48,970 美元以下。如果他們這樣做,拋售可能會加劇,貨幣對可能會暴跌至 50 日移動平均線(45,247 美元)。
Ether price analysis
以太幣價格分析
Ether (ETH) tried to jump above the psychological resistance of $3,000 on Feb. 22, but the bears held their ground.
2 月 22 日,以太幣 (ETH) 試圖突破 3,000 美元的心理阻力位,但空頭堅守陣地。
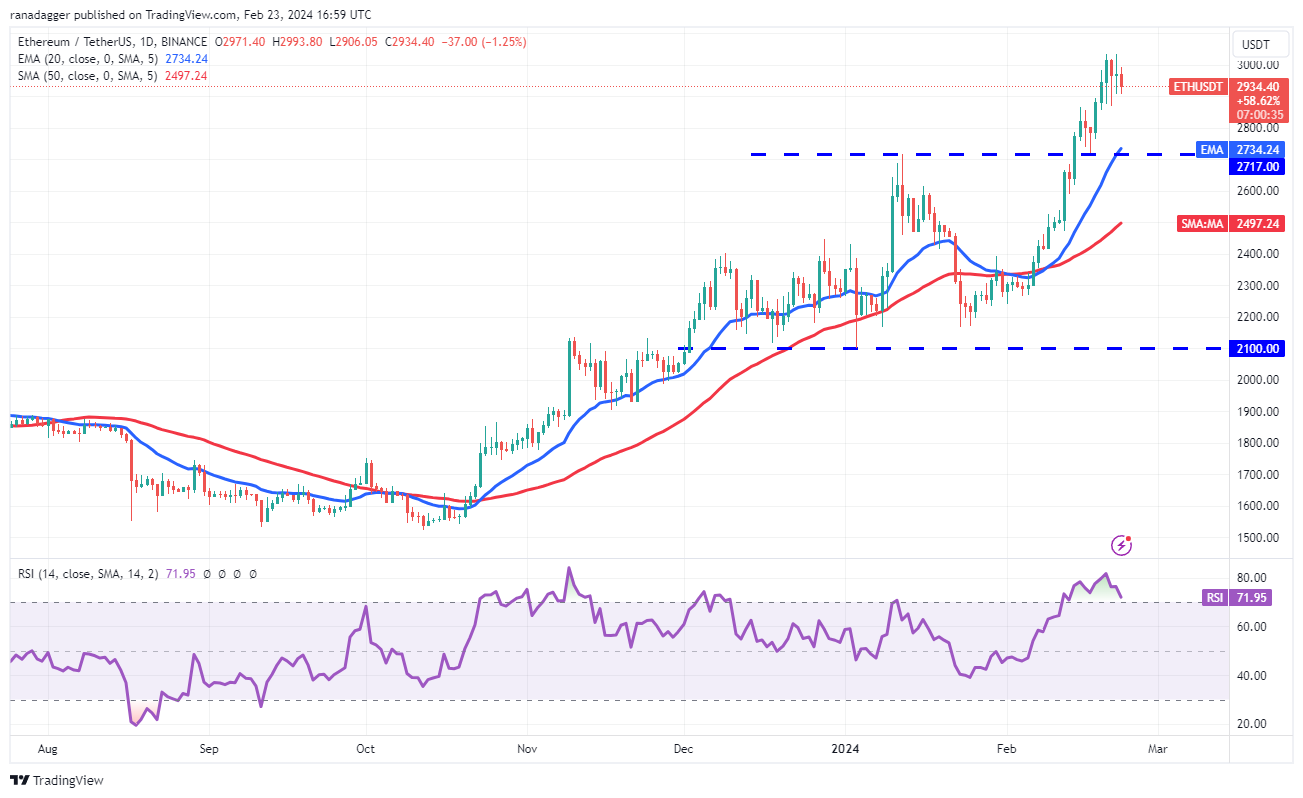
Sellers are trying to start a correction toward the breakout level of $2,717. This is an important level to watch out for because the 20-day EMA ($2,734) is nearby. If the price rebounds off $2,717 with force, it will indicate that the bulls have flipped the level into support. The bulls will then again attempt to clear the hurdle at $3,000. If they succeed, the ETH/USDT pair may reach $3,300.
賣家正試圖開始向 2,717 美元的突破水準進行修正。這是一個值得關注的重要水平,因為 20 日均線(2,734 美元)就在附近。如果價格從 2,717 美元強力反彈,則表示多頭已將該水平轉變為支撐位。隨後多頭將再次嘗試突破 3,000 美元的關卡。如果他們成功,ETH/USDT 貨幣對可能會達到 3,300 美元。
The bears will have to tug and maintain the price below $2,717 to weaken the bulls. The pair may then tumble to the 50-day SMA ($2,497). Such a deeper fall could delay the start of the next leg of the uptrend.
空頭必須將價格拉低並維持在 2,717 美元以下,以削弱多頭的力量。隨後該貨幣對可能會跌至 50 日移動平均線(2,497 美元)。如此深度的下跌可能會推遲下一階段上升趨勢的開始。
BNB price analysis
BNB價格分析
BNB (BNB) resumed its uptrend after breaking above the $367 resistance on Feb. 21. The next target objective on the upside is $400.
BNB(BNB)在2月21日突破367美元阻力位後恢復上漲趨勢。下一個上行目標是400美元。
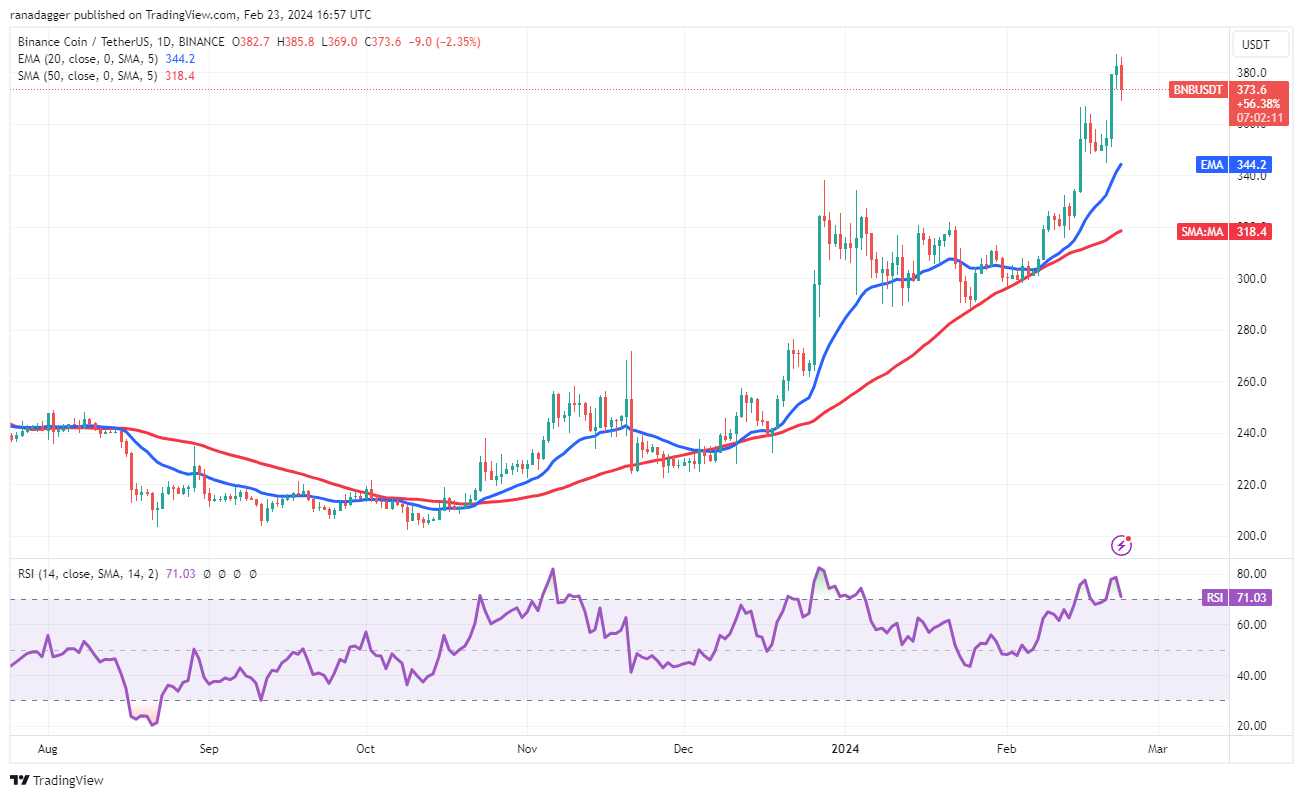
The bears will try to stall the up move at $400, but if the bulls do not give up much ground from the level, it will indicate that every minor dip is being bought. That will improve the prospects of a rally to $460.
空頭將試圖阻止 400 美元的上漲,但如果多頭沒有從該水平放棄太多地面,則表明每次小幅下跌都被買入。這將改善反彈至 460 美元的前景。
The first support on the downside is $368, and then the 20-day EMA ($344). If the supports fail to hold, the correction could reach the 50-day SMA ($318). This is an essential level for the bulls to defend because a break below it will signal a trend change.
下行的第一個支撐位是 368 美元,然後是 20 日均線(344 美元)。如果支撐位未能守住,調整可能會觸及 50 日移動平均線(318 美元)。這是多頭捍衛的重要水平,因為跌破該水平將標誌著趨勢變化。
Solana price analysis
Solana 價格分析
Solana (SOL) bounced off the 50-day SMA ($99) on Feb. 21, but the bulls could not push the price above the 20-day EMA ($105).
Solana (SOL) 於 2 月 21 日從 50 日均線(99 美元)反彈,但多頭無法將價格推至 20 日均線(105 美元)上方。
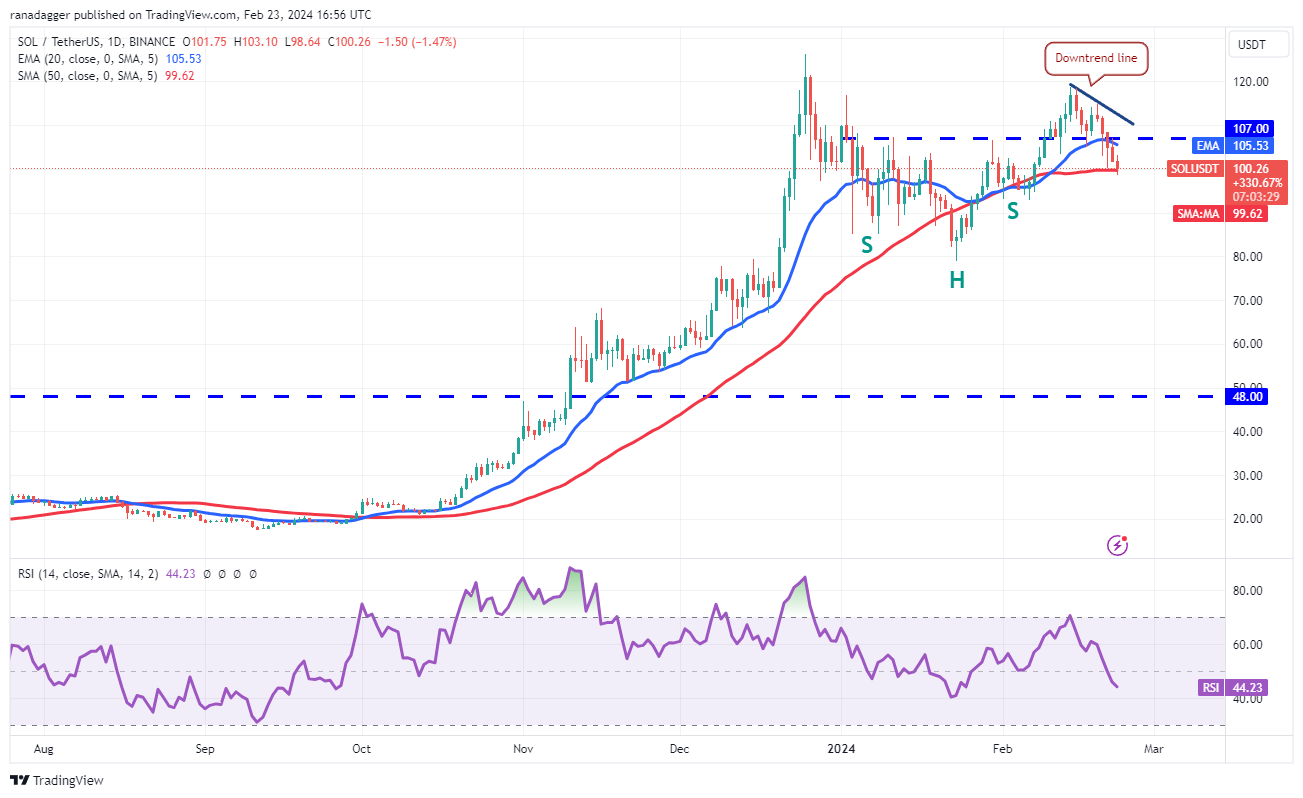
The bears will try to strengthen their position by pulling the price below the 50-day SMA. If they do that, the SOL/USDT pair could descend to $93 and then to $80. This level is likely to attract aggressive buying by the bulls.
空頭將試圖透過將價格拉至 50 日移動平均線下方來鞏固自己的頭寸。如果他們這樣做,SOL/USDT 貨幣對可能會跌至 93 美元,然後跌至 80 美元。這一水平可能會吸引多頭的積極買盤。
On the upside, the bulls will have to overcome the barrier at the downtrend line to signal that the correction may be over. The pair could then attempt a rally to $126, where the bears are likely to mount a strong defense.
從好的方面來看,多頭必須克服下降趨勢線的障礙,才能發出修正可能結束的訊號。隨後,該貨幣對可能會嘗試反彈至 126 美元,空頭可能會在此進行強有力的防禦。
XRP price analysis
瑞波幣價格分析
XRP (XRP) formed an inside-day candlestick pattern on Feb. 22, indicating indecision between the buyers and sellers. This uncertainty resolved to the downside on Feb. 23, suggesting that the bears had overpowered the bulls.
XRP (XRP) 在 2 月 22 日形成了日內燭台形態,顯示買家和賣家之間猶豫不決。這種不確定性在 2 月 23 日轉為下行,表明空頭壓倒了多頭。
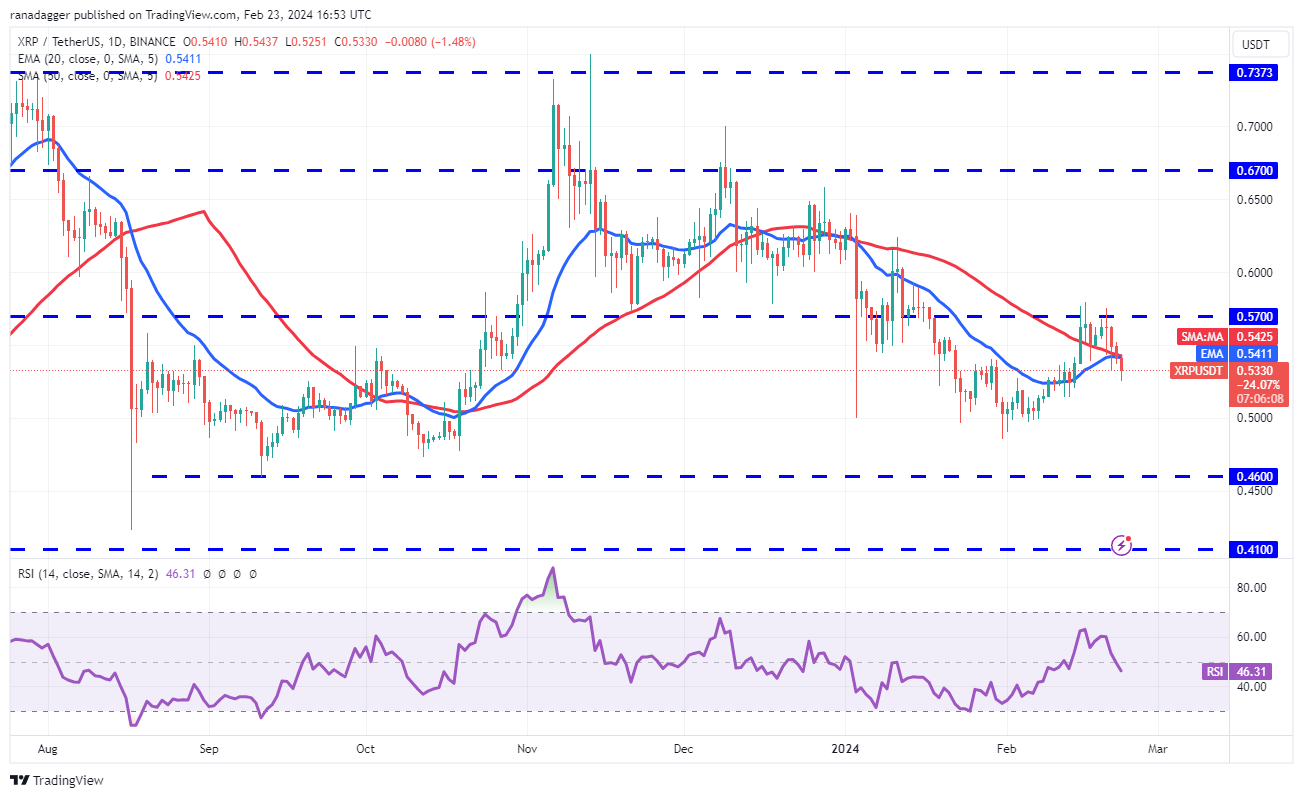
The bears will try to sink the pair to the strong support zone between $0.48 and $0.46. A strong rebound of this zone suggests that the XRP/USDT pair remains range-bound between $0.46 and $0.57 for a few days.
空頭將試圖將該貨幣對壓低至 0.48 美元至 0.46 美元之間的強支撐區域。該區域的強勁反彈表明 XRP/USDT 貨幣對在幾天內仍將在 0.46 美元至 0.57 美元之間波動。
The bulls will have to shove the price above $0.57 to indicate the start of a new up move. The pair will then attempt a rally to $0.67 and subsequently to the formidable resistance at $0.74.
多頭必須將價格推至 0.57 美元以上,才能表明新一輪上漲的開始。隨後該貨幣對將嘗試反彈至 0.67 美元,隨後升至 0.74 美元的強大阻力位。
Cardano price analysis
卡爾達諾價格分析
Cardano (ADA) is trying to take support at the 20-day EMA ($0.57), but the bears have not given up and are maintaining the selling pressure.
卡爾達諾(ADA)試圖在 20 日均線(0.57 美元)處獲得支撐,但空頭並未放棄並維持拋售壓力。
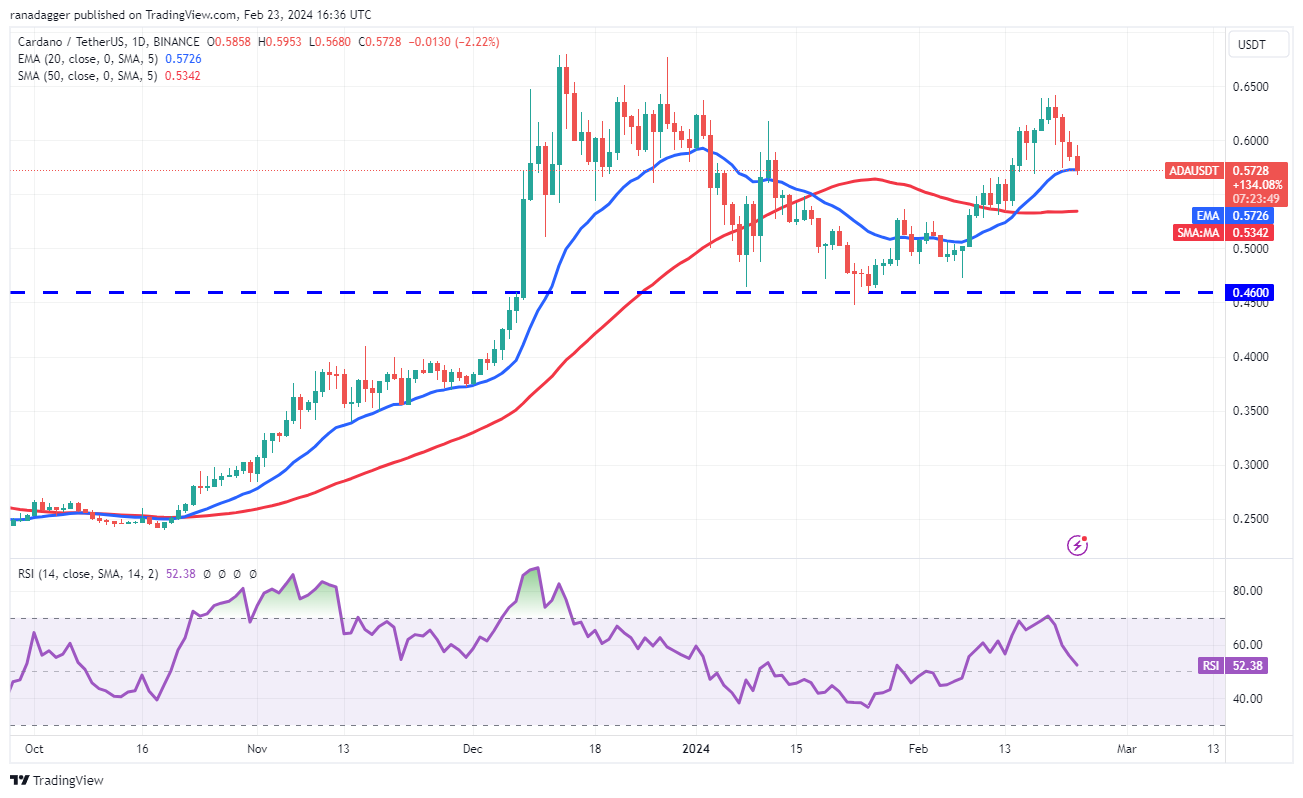
If the bears prevail, the ADA/USDT pair could skid to the 50-day SMA ($0.53). This is an important level for the bulls to defend because if this level gives way, the pair could plummet to the vital support at $0.46.
如果空頭佔上風,ADA/USDT 貨幣對可能會滑向 50 日移動平均線(0.53 美元)。對於多頭來說,這是一個重要的防守水平,因為如果該水平失守,該貨幣對可能會暴跌至 0.46 美元的重要支撐位。
On the contrary, if the price rebounds off the 20-day EMA with strength, it will suggest that the sentiment remains positive and traders are buying on dips. The bulls will then try to overcome the resistance zone between $0.64 and $0.68.
相反,如果價格從 20 日均線強勢反彈,則表示市場情緒依然樂觀,交易者逢低買進。然後多頭將嘗試克服 0.64 美元至 0.68 美元之間的阻力區。
Avalanche price analysis
雪崩價格分析
Avalanche (AVAX) tried to start a recovery on Feb. 22, but the bears fiercely defended the 20-day EMA ($37.90). This suggests that recoveries are being sold into.
Avalanche (AVAX) 試圖在 2 月 22 日開始復甦,但空頭猛烈捍衛 20 日均線(37.90 美元)。這表明回收品正在出售。
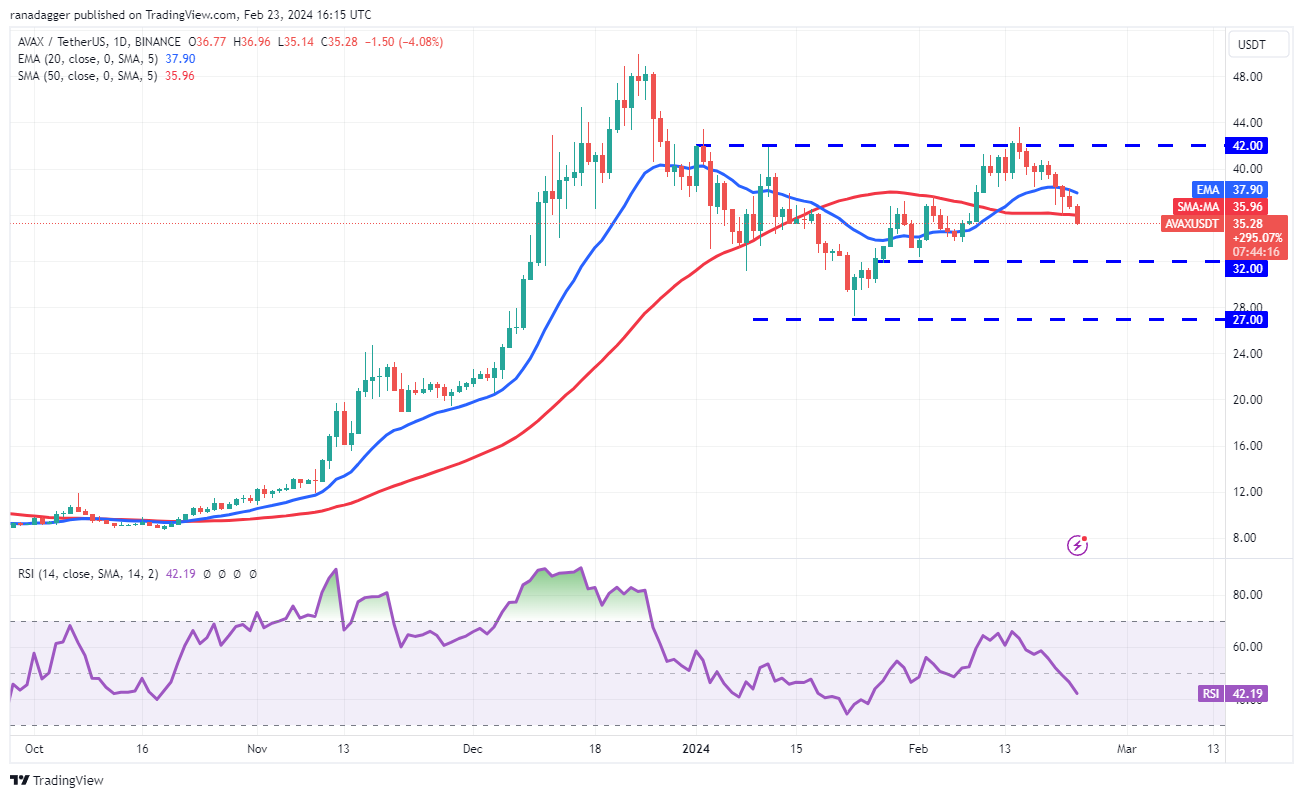
The bears continued selling on Feb. 23 and pulled the price below the 50-day SMA ($35.96). The AVAX/USDT pair could drop to the solid support at $32. A solid bounce off this level will suggest that the pair may oscillate between $32 and $42 for a while.
2 月 23 日,空頭繼續拋售,並將價格拉至 50 日移動平均線(35.96 美元)以下。 AVAX/USDT 貨幣對可能會跌至 32 美元的堅實支撐位。從該水平強勁反彈將表明該貨幣對可能會在 32 美元至 42 美元之間波動一段時間。
Contrarily, if the price turns up from the current level and rises above the 20-day EMA, it will suggest strong buying at lower levels. The bulls will then attempt to drive the price above $42 and complete the inverse head-and-shoulders pattern.
相反,如果價格從當前水準回升併升至20日均線上方,則表示在較低水準上有強勁買盤。然後,多頭將嘗試將價格推高至 42 美元以上,並完成反向頭肩形態。
Related: Here’s what happened in crypto today
相關:這是今天加密貨幣領域發生的事情
Dogecoin price analysis
狗狗幣價格分析
The bulls are trying to maintain Dogecoin (DOGE) above the symmetrical triangle, while the bears are trying to pull the price back below it.
多頭試圖將狗狗幣(DOGE)維持在對稱三角形上方,而空頭則試圖將價格拉回對稱三角形下方。
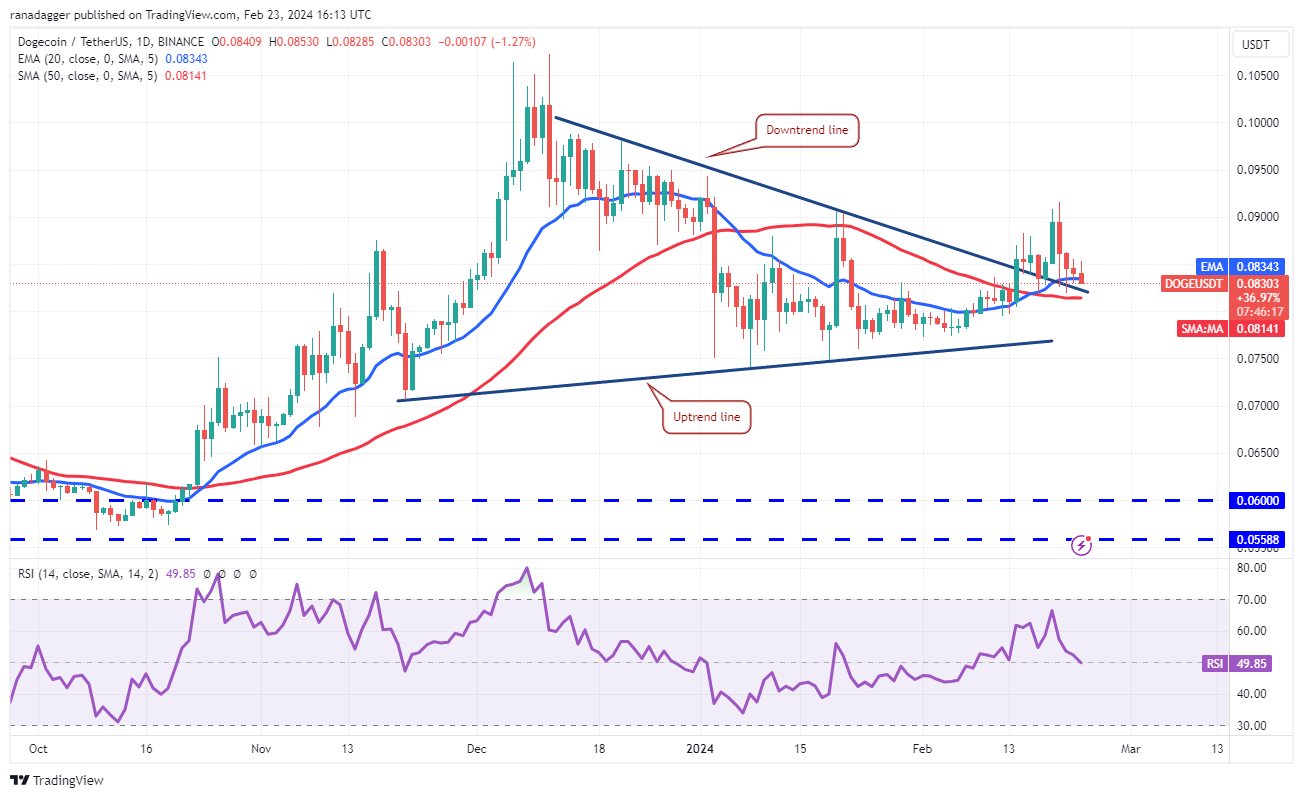
If the price rebounds off the current level, the bulls will try to propel the DOGE/USDT pair above the $0.09 resistance. If they succeed, the pair could start an uptrend toward the $0.10 to $0.11 resistance zone.
如果價格從當前水準反彈,多頭將嘗試推動 DOGE/USDT 貨幣對突破 0.09 美元阻力位。如果成功,該貨幣對可能會開始向 0.10 美元至 0.11 美元阻力區上漲。
This positive view will be invalidated in the near term if the price turns down and plummets below the 50-day SMA ($0.08). The pair could then slump to the uptrend line. A break below this level will tilt the advantage in favor of the bears.
如果價格下跌並跌破 50 日移動平均線(0.08 美元),這種正面觀點將在短期內失效。然後該貨幣對可能會跌至上升趨勢線。跌破該水準將使優勢向空頭傾斜。
Chainlink price analysis
Chainlink價格分析
Chainlink (LINK) has pulled back in an uptrend. The bears are trying to drag the price to the breakout level of $17.32.
Chainlink (LINK) 在上升趨勢中回調。空頭正試圖將價格拖至 17.32 美元的突破水平。
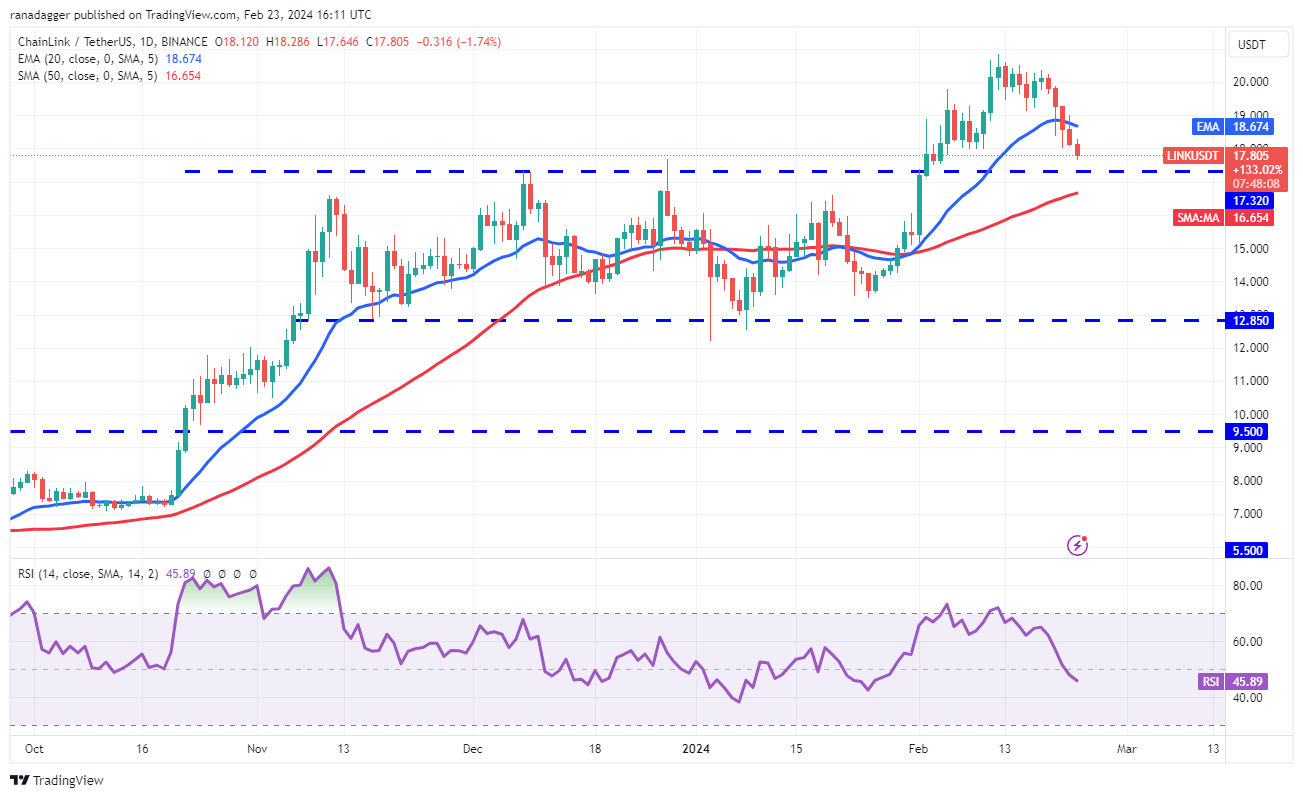
If the price rebounds off $17.32 with strength and rises above the 20-day EMA ($18.67), it will suggest that the bulls have flipped the level into support. That will increase the likelihood of a retest of $20.85.
如果價格從 17.32 美元強勁反彈併升至 20 日均線(18.67 美元)上方,則表明多頭已將該水平轉變為支撐位。這將增加重新測試 20.85 美元的可能性。
The critical support to watch on the downside is the 50-day SMA ($16.65). If this level cracks, it will indicate that the bulls have given up. That may start a deeper correction to $15 and later to $12.85.
下檔方面值得關注的關鍵支撐是 50 日移動平均線(16.65 美元)。如果該水平破裂,則表示多頭已經放棄。這可能會開始更深的回調至 15 美元,然後至 12.85 美元。
Polkadot price analysis
波卡價格分析
The bulls are trying to keep Polkadot (DOT) inside the ascending channel pattern, while the bears are striving to pull the price below it.
多頭試圖將 Polkadot (DOT) 保持在上升通道模式內,而空頭則努力將價格拉至下方。
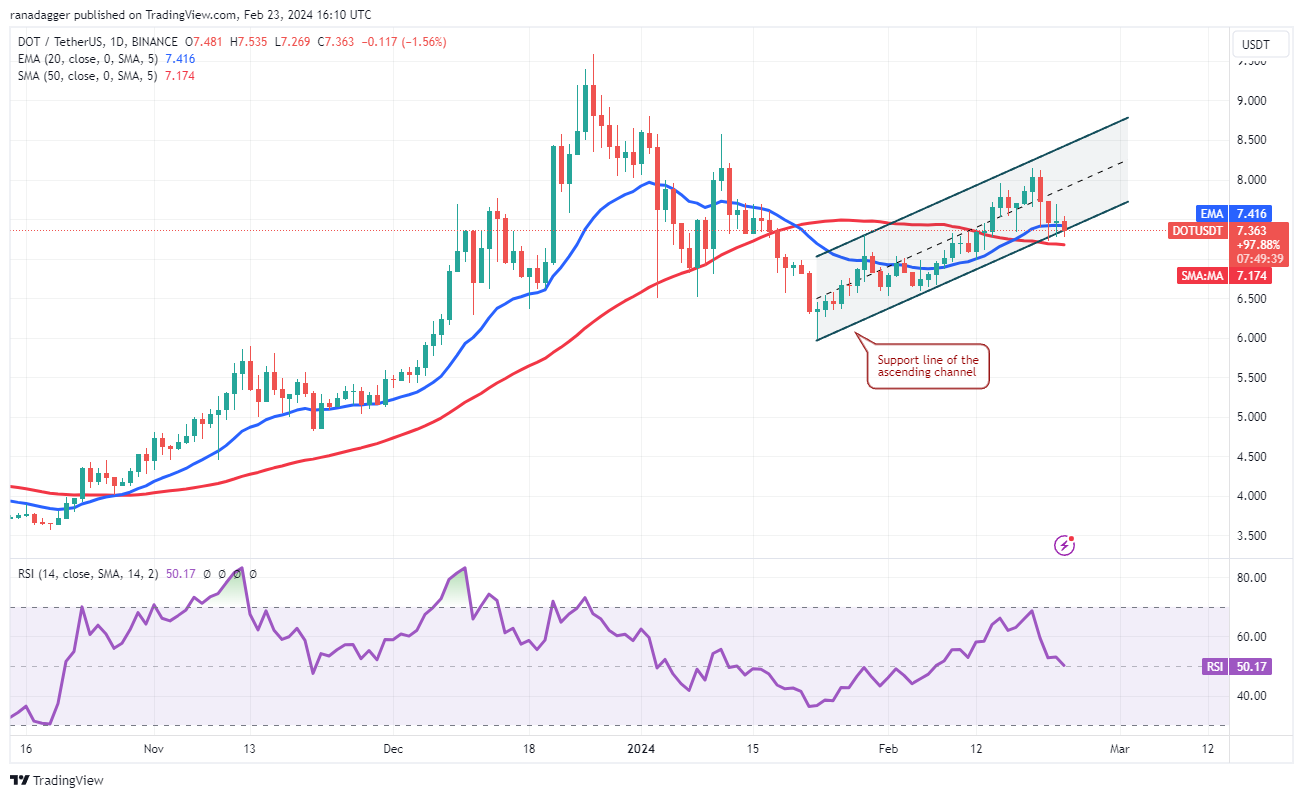
The flattish 20-day EMA ($7.41) and the RSI near the midpoint do not give a clear advantage either to the bulls or the bears. If the price breaks below the 50-day SMA ($7.17), the DOT/USDT pair could slide to $6.50.
持平的 20 日均線(7.41 美元)和中點附近的 RSI 並沒有為多頭或空頭帶來明顯的優勢。如果價格跌破 50 日移動平均線(7.17 美元),DOT/USDT 貨幣對可能會滑至 6.50 美元。
On the other hand, a strong bounce off the current level will indicate that the bulls are fiercely defending the support line. That may keep the price inside the channel for some more time. The bulls will try to push the pair to the channel’s resistance line.
另一方面,從當前水平的強勁反彈將表明多頭正在激烈捍衛支撐線。這可能會使價格在通道內停留更長時間。多頭將試圖將該貨幣對推至通道阻力線。
This article does not contain investment advice or recommendations. Every investment and trading move involves risk, and readers should conduct their own research when making a decision.
本文不包含投資建議或建議。每一項投資和交易行為都涉及風險,讀者在做決定時應自行研究。
 Optimisus
 Crypto Intelligence
 DogeHome
 Coincu
 Times Tabloid
 CFN
CFN Crypto News Land
 Optimisus
 Optimisus


