

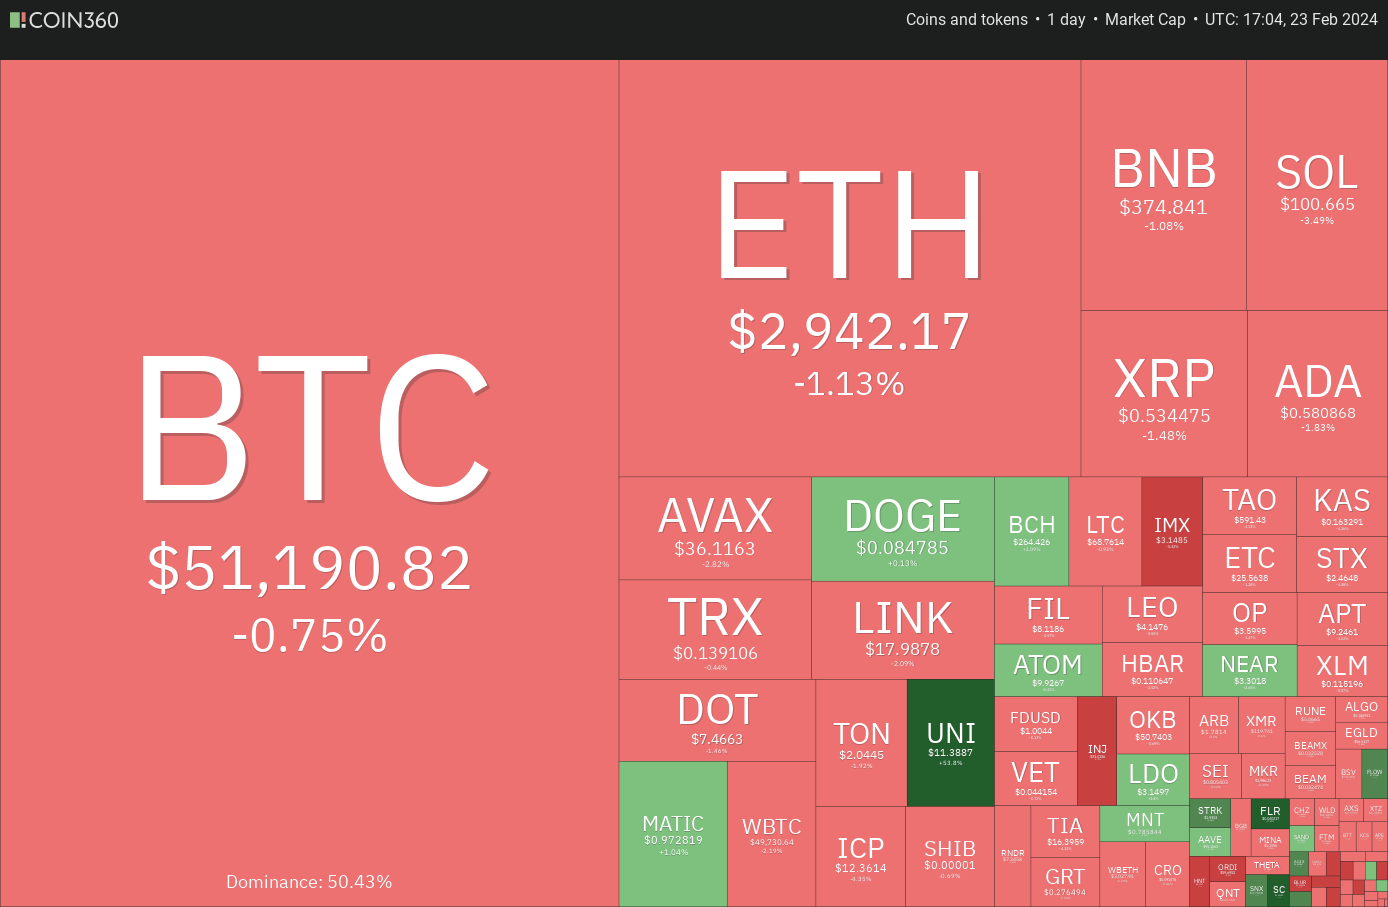
Bitcoin (BTC) has been facing stiff resistance near $52,000, increasing the possibility of a short-term correction. The sideways action resulted in net outflows of roughly $36 million from the spot Bitcoin exchange-traded funds (ETFs) on Feb. 21, according to various sources, including BitMEX Research. However, the bleeding stalled on Feb. 22, and the day saw net inflows of about $251 million into the ETFs.
비트코인(BTC)이 52,000달러 부근에서 거센 저항에 직면해 단기 조정 가능성이 높아지고 있다. BitMEX Research를 포함한 다양한 소식통에 따르면 2월 21일 비트코인 현물 상장지수펀드(ETF)에서 이러한 횡보 조치로 인해 약 3,600만 달러의 순유출이 발생했습니다. 그러나 출혈은 2월 22일에 멈췄고 그날 ETF에 약 2억 5100만 달러의 순유입이 발생했습니다.
Some analysts believe the markets are ready for a pullback before the halving in April. Popular trader and analyst Rekt Capital said Bitcoin’s current bull phase is similar to the 2016 and 2020 bull runs. If history repeats itself, “a pre-halving retrace” followed by “a post halving reaccumulation period” is possible.
일부 분석가들은 시장이 4월 반감기 이전에 하락세를 보일 준비가 되어 있다고 믿고 있습니다. 유명 트레이더이자 분석가인 Rekt Capital은 비트코인의 현재 상승 단계가 2016년 및 2020년 상승세와 유사하다고 말했습니다. 역사가 반복된다면 '반감 전 재추적'에 이어 '반감 후 재축적 기간'이 이어질 수 있습니다.
Bitcoin’s hesitation to continue its rally has triggered profit-booking in select altcoins. A corrective phase is positive for the long-term health of the markets as it shakes out the weak hands and allows the stronger hands to add at lower levels.
비트코인이 랠리를 계속하기를 주저하면서 일부 알트코인에서 이익 장부가 촉발되었습니다. 조정 단계는 약한 핸드를 떨쳐내고 더 강한 핸드가 더 낮은 수준에 추가될 수 있도록 하므로 시장의 장기적인 건전성에 긍정적입니다.
What are the crucial support levels to watch out for on the downside in Bitcoin and altcoins? Let’s analyze the charts of the top 10 cryptocurrencies to find out.
비트코인과 알트코인의 단점에 대해 주의해야 할 중요한 지원 수준은 무엇입니까? 알아보기 위해 상위 10개 암호화폐의 차트를 분석해 보겠습니다.
Bitcoin price analysis
비트코인 가격 분석
The long tail on Bitcoin’s Nov. 21 candlestick shows that the bulls purchased the dip to the immediate support of $50,625, but could not overcome the barrier at $52,000.
11월 21일 비트코인 캔들스틱의 긴 꼬리는 상승세가 $50,625의 즉각적인 지지선까지 하락했지만 $52,000의 장벽을 극복하지 못했다는 것을 보여줍니다.
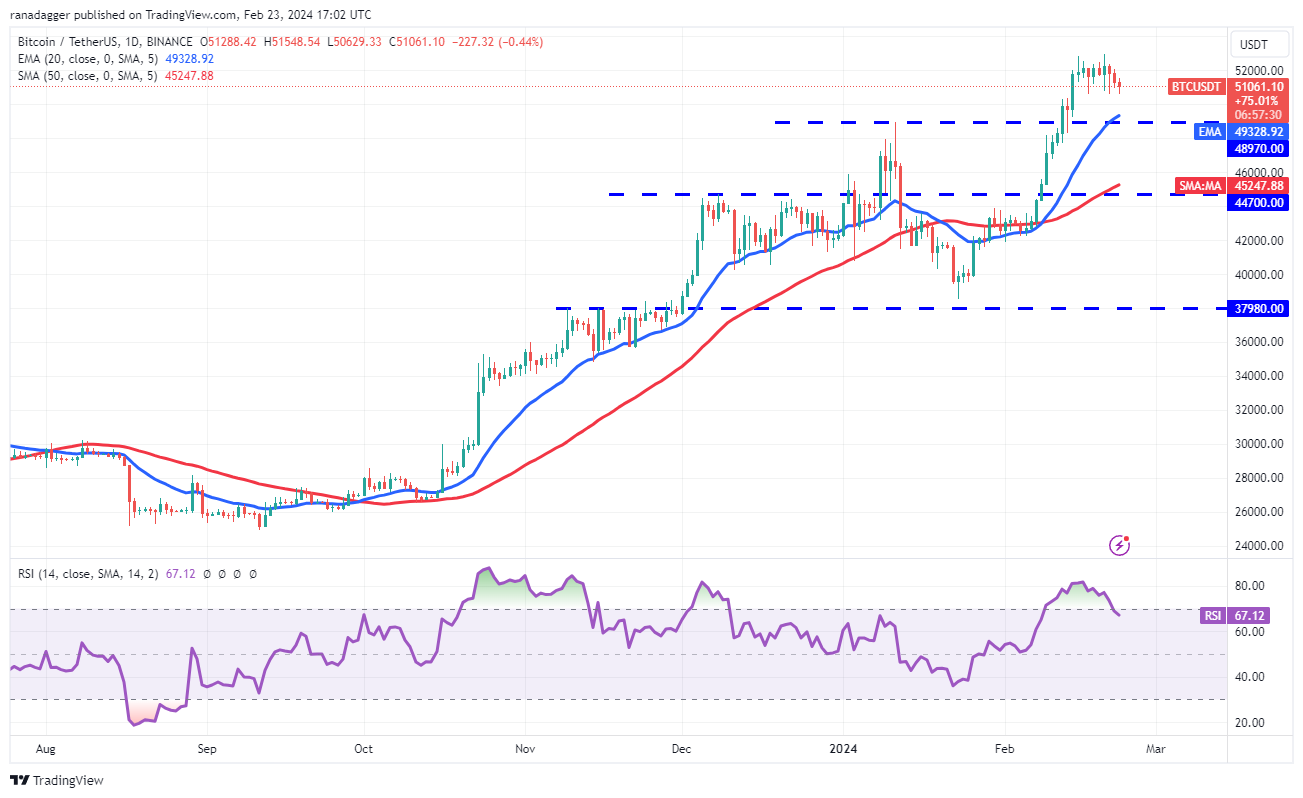
The bears will again try to yank the price below $50,625. If they can pull it off, the BTC/USDT pair could plunge to the strong support at $48,970. A bounce off this level will indicate that the sentiment remains bullish and traders are buying on dips. The uptrend will resume on a break above $52,000. The pair could then reach $60,000.
하락세는 다시 가격을 $50,625 아래로 낮추려고 시도할 것입니다. 성공할 수 있다면 BTC/USDT 쌍은 48,970달러의 강력한 지지선으로 급락할 수 있습니다. 이 수준에서 반등하는 것은 정서가 여전히 낙관적이며 거래자들이 하락세에 매수하고 있음을 나타냅니다. 상승 추세는 $52,000를 넘어설 때 다시 시작됩니다. 그러면 그 쌍은 $60,000에 도달할 수 있습니다.
However, the bears are likely to have other plans. They will try to pull the price below $48,970. If they do that, the selling could intensify, and the pair may nosedive to the 50-day SMA ($45,247).
그러나 곰들은 다른 계획을 가지고 있을 가능성이 높습니다. 그들은 가격을 48,970달러 이하로 낮추려고 노력할 것입니다. 그렇게 할 경우 매도가 더욱 심화될 수 있으며 50일 SMA($45,247)까지 급락할 수 있습니다.
Ether price analysis
이더 가격 분석
Ether (ETH) tried to jump above the psychological resistance of $3,000 on Feb. 22, but the bears held their ground.
이더리움(ETH)은 2월 22일 3,000달러의 심리적 저항선을 뛰어넘으려고 시도했지만 하락세는 버텼습니다.
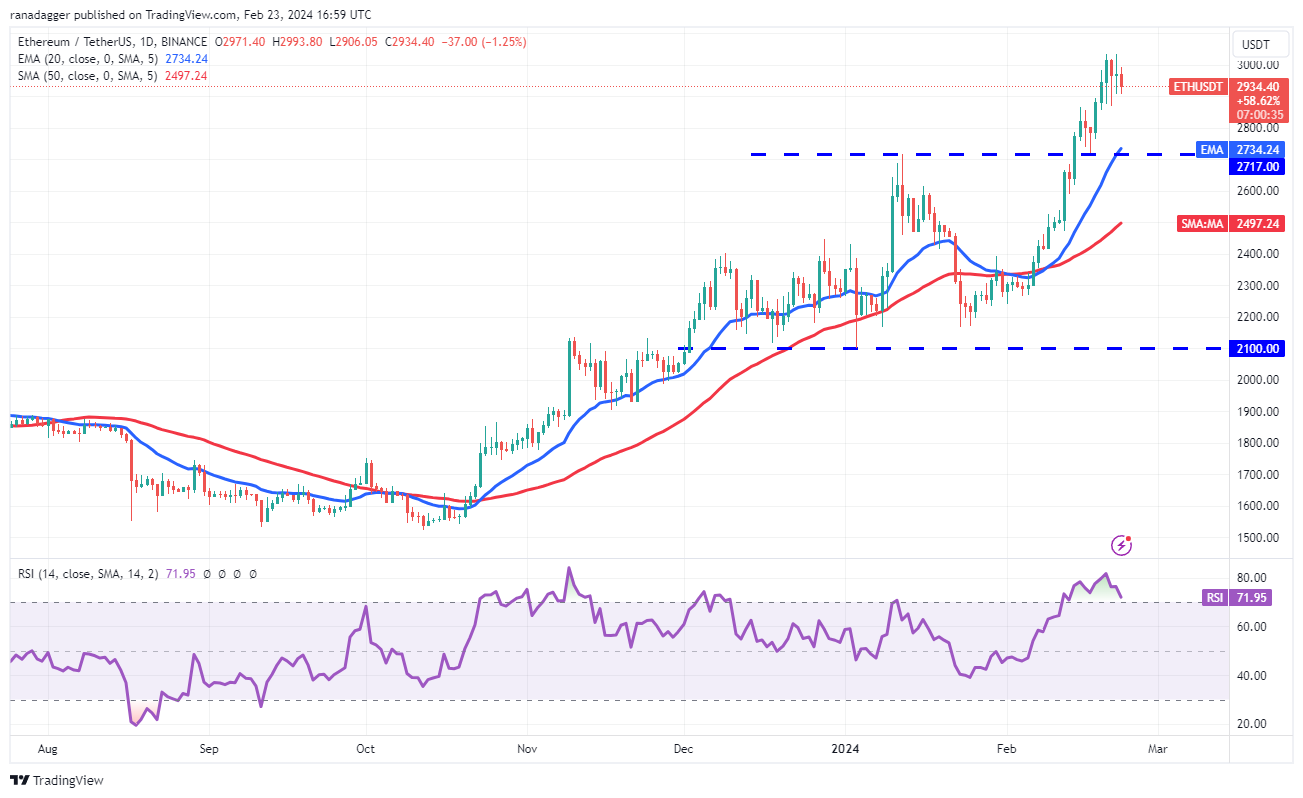
Sellers are trying to start a correction toward the breakout level of $2,717. This is an important level to watch out for because the 20-day EMA ($2,734) is nearby. If the price rebounds off $2,717 with force, it will indicate that the bulls have flipped the level into support. The bulls will then again attempt to clear the hurdle at $3,000. If they succeed, the ETH/USDT pair may reach $3,300.
판매자는 돌파 수준인 $2,717를 향해 조정을 시작하려고 합니다. 20일 EMA($2,734)가 가까이 있기 때문에 주의해야 할 중요한 수준입니다. 가격이 강제로 2,717달러에서 반등하면 황소가 지지 수준으로 전환했음을 나타냅니다. 그런 다음 상승세는 다시 $3,000의 장애물을 극복하려고 시도할 것입니다. 성공하면 ETH/USDT 쌍이 $3,300에 도달할 수 있습니다.
The bears will have to tug and maintain the price below $2,717 to weaken the bulls. The pair may then tumble to the 50-day SMA ($2,497). Such a deeper fall could delay the start of the next leg of the uptrend.
하락세는 상승세를 약화시키기 위해 가격을 2,717달러 미만으로 유지해야 합니다. 그러면 해당 쌍은 50일 SMA($2,497)까지 하락할 수 있습니다. 이러한 깊은 하락은 다음 상승 추세의 시작을 지연시킬 수 있습니다.
BNB price analysis
BNB 가격 분석
BNB (BNB) resumed its uptrend after breaking above the $367 resistance on Feb. 21. The next target objective on the upside is $400.
BNB(BNB)는 2월 21일 367달러 저항선을 돌파한 후 상승세를 재개했습니다. 다음 상승 목표는 400달러입니다.
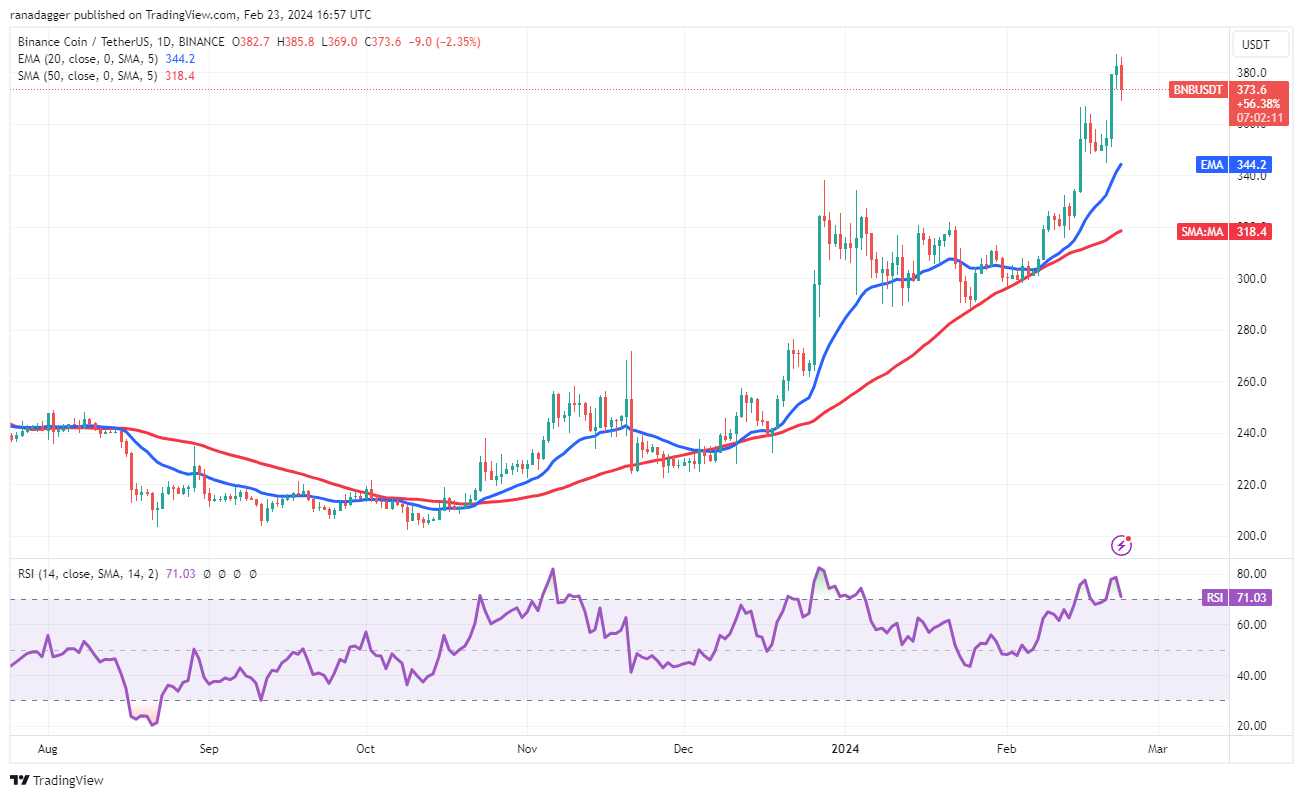
The bears will try to stall the up move at $400, but if the bulls do not give up much ground from the level, it will indicate that every minor dip is being bought. That will improve the prospects of a rally to $460.
하락세는 400달러에서 상승세를 멈추려고 노력할 것이지만, 상승세가 수준에서 많은 하락을 포기하지 않는다면 이는 모든 소폭 하락이 매수되고 있음을 나타냅니다. 이는 랠리 전망을 460달러로 향상시킬 것입니다.
The first support on the downside is $368, and then the 20-day EMA ($344). If the supports fail to hold, the correction could reach the 50-day SMA ($318). This is an essential level for the bulls to defend because a break below it will signal a trend change.
아래쪽의 첫 번째 지지선은 $368이고 그 다음은 20일 EMA($344)입니다. 지지가 유지되지 않으면 수정은 50일 SMA($318)에 도달할 수 있습니다. 이 수준을 밑돌면 추세 변화를 알리는 신호이기 때문에 이는 황소가 방어해야 하는 필수 수준입니다.
Solana price analysis
솔라나 가격 분석
Solana (SOL) bounced off the 50-day SMA ($99) on Feb. 21, but the bulls could not push the price above the 20-day EMA ($105).
솔라나(SOL)는 2월 21일 50일 SMA($99)에서 반등했지만 상승세는 20일 EMA($105) 이상으로 가격을 끌어올리지 못했습니다.
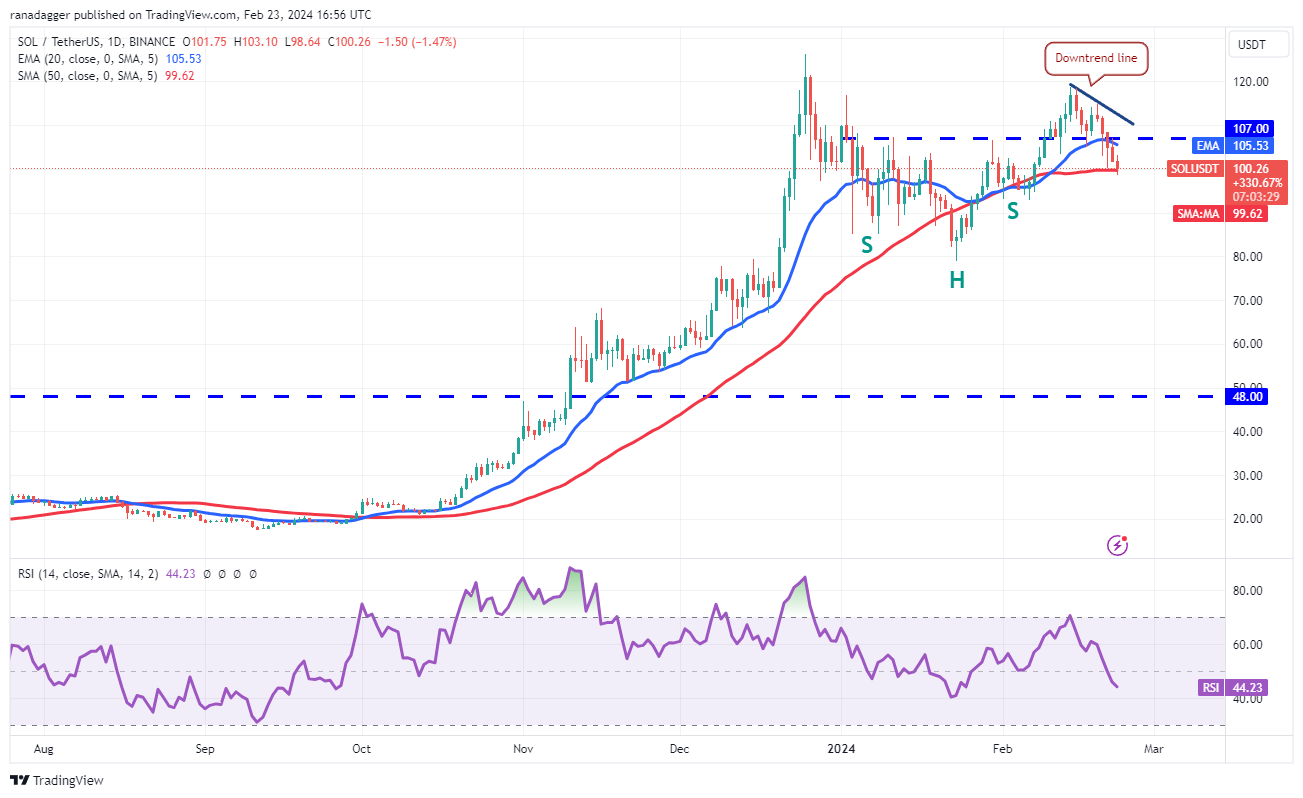
The bears will try to strengthen their position by pulling the price below the 50-day SMA. If they do that, the SOL/USDT pair could descend to $93 and then to $80. This level is likely to attract aggressive buying by the bulls.
하락세는 가격을 50일 SMA 아래로 끌어내려 포지션을 강화하려고 노력할 것입니다. 그렇게 하면 SOL/USDT 쌍은 $93까지 하락한 다음 $80까지 하락할 수 있습니다. 이 수준은 황소의 공격적인 매수를 유도할 가능성이 높습니다.
On the upside, the bulls will have to overcome the barrier at the downtrend line to signal that the correction may be over. The pair could then attempt a rally to $126, where the bears are likely to mount a strong defense.
긍정적인 측면에서는 상승세가 조정이 끝났다는 신호를 보내기 위해 하락 추세선의 장벽을 극복해야 한다는 것입니다. 그런 다음 쌍은 $126까지 반등을 시도할 수 있으며, 여기서 약세는 강력한 방어력을 발휘할 가능성이 높습니다.
XRP price analysis
XRP 가격 분석
XRP (XRP) formed an inside-day candlestick pattern on Feb. 22, indicating indecision between the buyers and sellers. This uncertainty resolved to the downside on Feb. 23, suggesting that the bears had overpowered the bulls.
XRP(XRP)는 2월 22일 장내 캔들스틱 패턴을 형성해 구매자와 판매자 사이의 우유부단함을 나타냈습니다. 이러한 불확실성은 2월 23일 하락세로 해소되었으며, 이는 하락세가 상승세를 압도했음을 시사합니다.
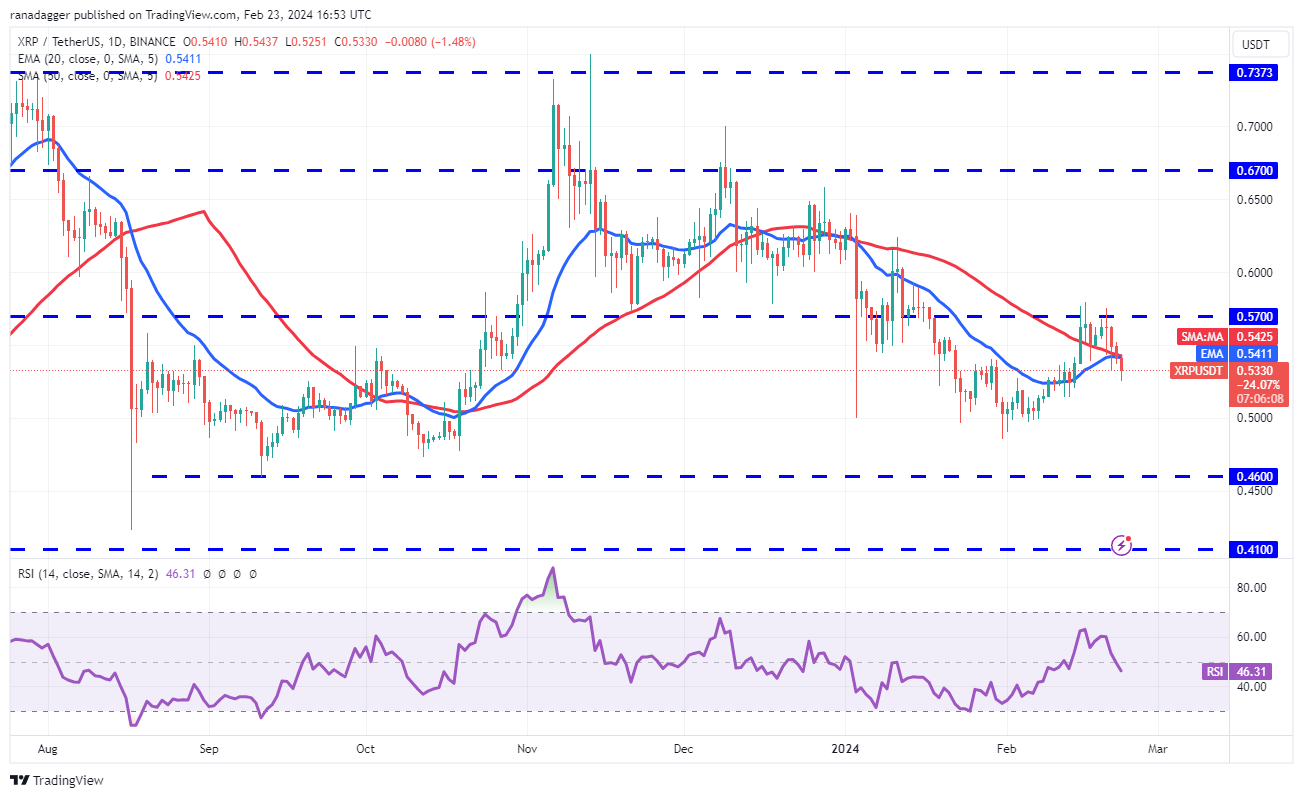
The bears will try to sink the pair to the strong support zone between $0.48 and $0.46. A strong rebound of this zone suggests that the XRP/USDT pair remains range-bound between $0.46 and $0.57 for a few days.
하락세는 $0.48에서 $0.46 사이의 강력한 지지대까지 하락시키려고 노력할 것입니다. 이 영역의 강한 반등은 XRP/USDT 쌍이 며칠 동안 0.46달러에서 0.57달러 사이의 범위에 머물고 있음을 시사합니다.
The bulls will have to shove the price above $0.57 to indicate the start of a new up move. The pair will then attempt a rally to $0.67 and subsequently to the formidable resistance at $0.74.
황소는 새로운 상승 움직임의 시작을 나타내기 위해 가격을 $0.57 이상으로 올려야 합니다. 그런 다음 쌍은 $0.67까지 상승을 시도하고 이어서 $0.74의 강력한 저항을 시도합니다.
Cardano price analysis
카르다노 가격 분석
Cardano (ADA) is trying to take support at the 20-day EMA ($0.57), but the bears have not given up and are maintaining the selling pressure.
카르다노(ADA)는 20일 EMA($0.57)에서 지지를 얻으려고 노력하고 있지만 하락세는 포기하지 않고 매도 압력을 유지하고 있습니다.
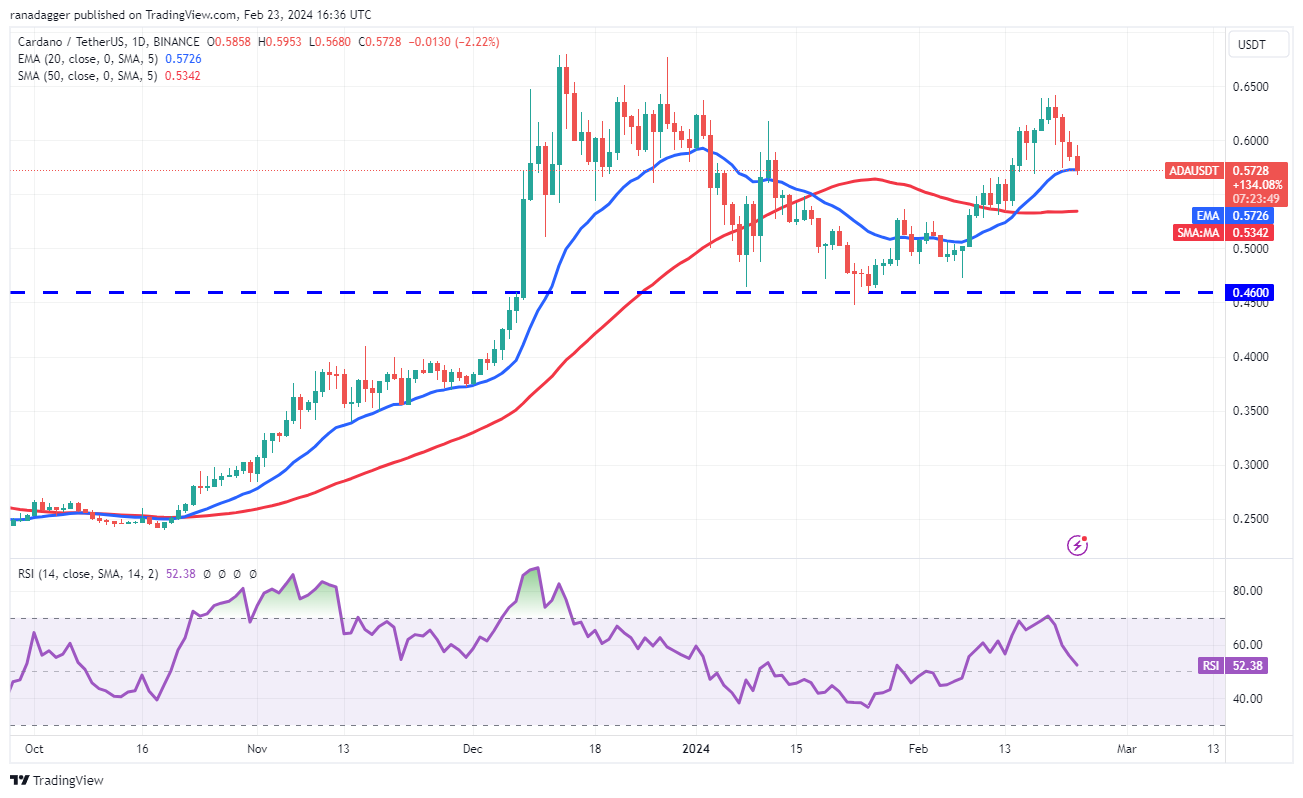
If the bears prevail, the ADA/USDT pair could skid to the 50-day SMA ($0.53). This is an important level for the bulls to defend because if this level gives way, the pair could plummet to the vital support at $0.46.
하락세가 승리할 경우 ADA/USDT 쌍은 50일 SMA(0.53달러)까지 하락할 수 있습니다. 이 수준이 무너지면 쌍이 $0.46의 중요한 지지선까지 급락할 수 있기 때문에 이것은 황소가 방어해야 할 중요한 수준입니다.
On the contrary, if the price rebounds off the 20-day EMA with strength, it will suggest that the sentiment remains positive and traders are buying on dips. The bulls will then try to overcome the resistance zone between $0.64 and $0.68.
반대로, 가격이 20일 EMA에서 강하게 반등한다면 이는 정서가 여전히 긍정적이고 거래자들이 하락세에 매수하고 있음을 의미합니다. 그런 다음 황소는 $0.64에서 $0.68 사이의 저항 영역을 극복하려고 노력할 것입니다.
Avalanche price analysis
눈사태 가격 분석
Avalanche (AVAX) tried to start a recovery on Feb. 22, but the bears fiercely defended the 20-day EMA ($37.90). This suggests that recoveries are being sold into.
Avalanche(AVAX)는 2월 22일에 회복을 시작하려 했으나 하락세는 20일 EMA($37.90)를 맹렬히 방어했습니다. 이는 회수권이 매각되고 있음을 의미합니다.
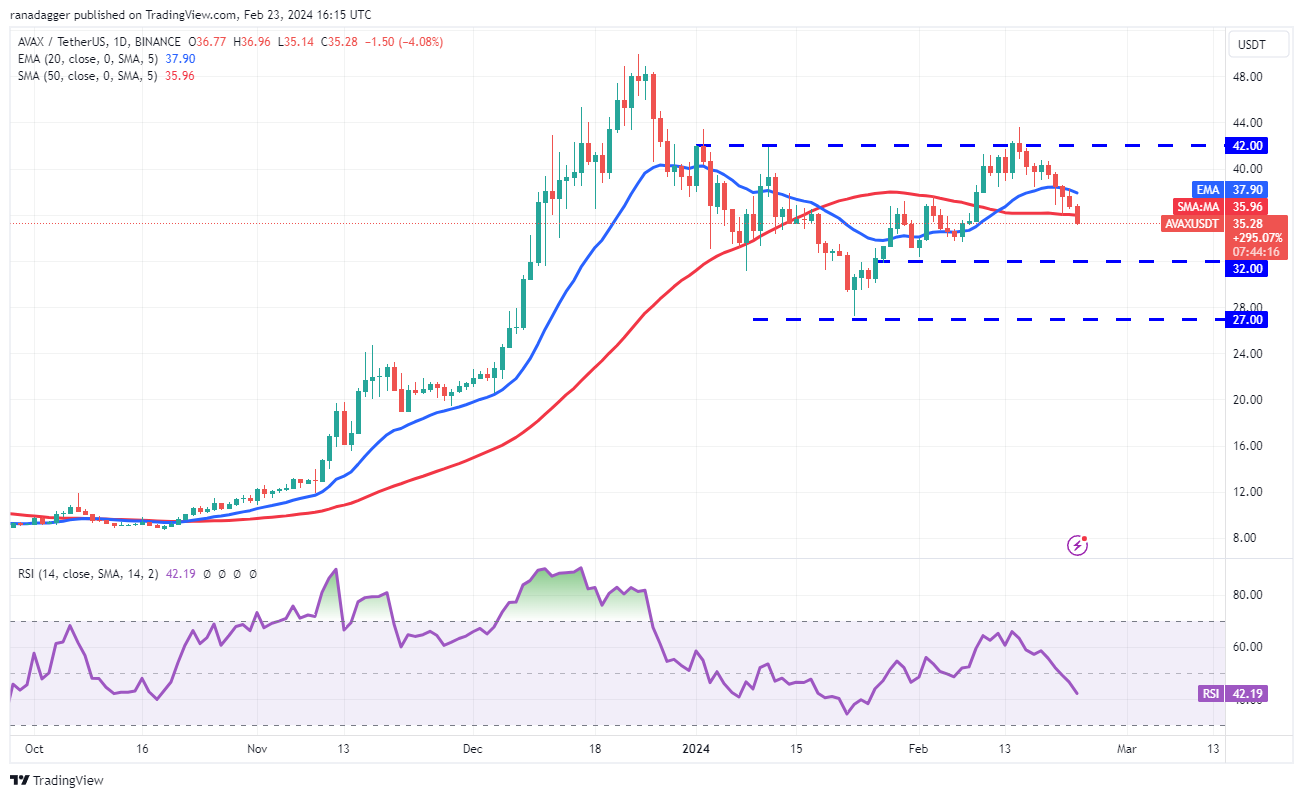
The bears continued selling on Feb. 23 and pulled the price below the 50-day SMA ($35.96). The AVAX/USDT pair could drop to the solid support at $32. A solid bounce off this level will suggest that the pair may oscillate between $32 and $42 for a while.
하락세는 2월 23일에도 계속 매도했고 가격은 50일 SMA(35.96달러) 아래로 떨어졌습니다. AVAX/USDT 쌍은 32달러의 견고한 지지선으로 떨어질 수 있습니다. 이 수준에서 확고한 반등은 쌍이 한동안 $32에서 $42 사이에서 진동할 수 있음을 시사합니다.
Contrarily, if the price turns up from the current level and rises above the 20-day EMA, it will suggest strong buying at lower levels. The bulls will then attempt to drive the price above $42 and complete the inverse head-and-shoulders pattern.
반대로, 가격이 현 수준에서 상승하여 20일 EMA를 넘어선다면 낮은 수준에서 강력한 매수를 제안할 것입니다. 그런 다음 상승세는 가격을 42달러 이상으로 끌어올리고 역헤드앤숄더 패턴을 완성하려고 시도할 것입니다.
Related: Here’s what happened in crypto today
관련 항목: 오늘 암호화폐 업계에서 일어난 일은 다음과 같습니다.
Dogecoin price analysis
도지코인 가격 분석
The bulls are trying to maintain Dogecoin (DOGE) above the symmetrical triangle, while the bears are trying to pull the price back below it.
강세론자들은 Dogecoin(DOGE)을 대칭 삼각형 위로 유지하려고 노력하는 반면, 약세론자들은 가격을 대칭 삼각형 아래로 되돌리려고 노력하고 있습니다.
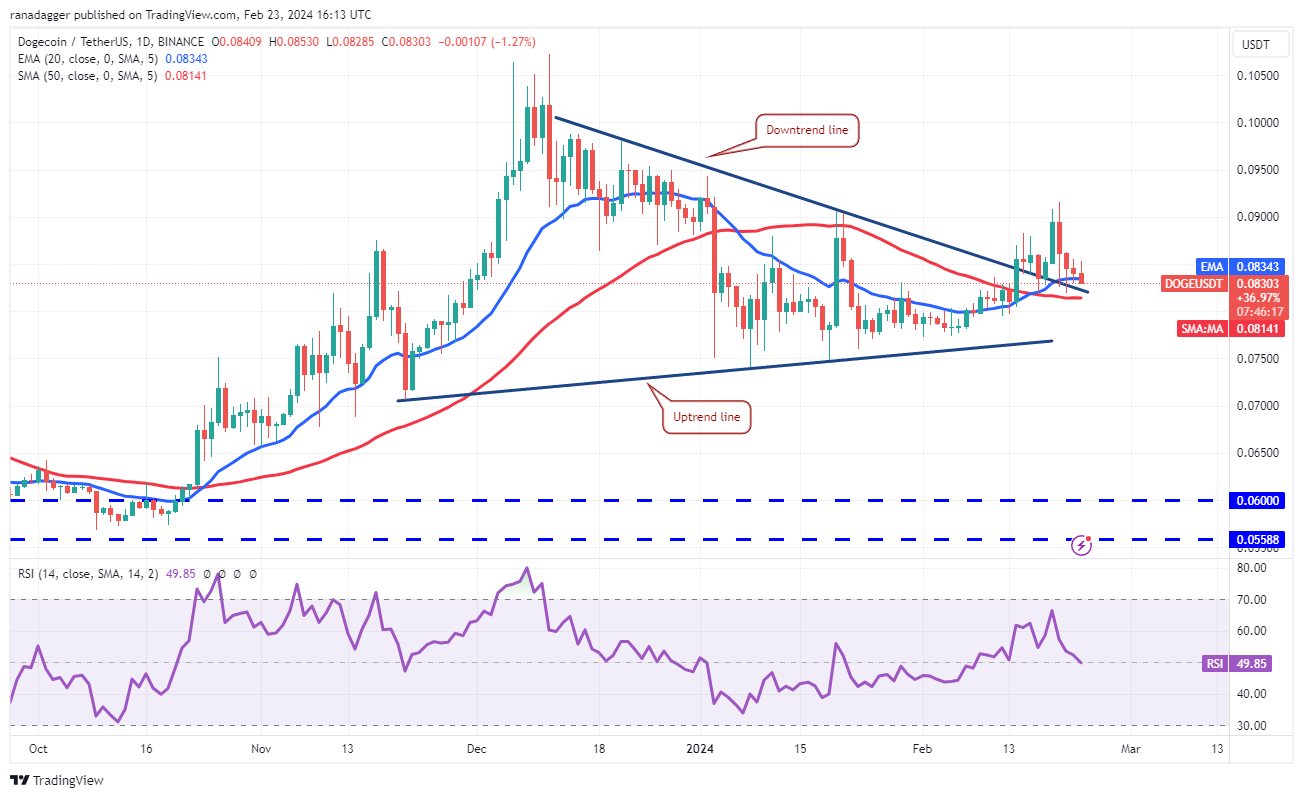
If the price rebounds off the current level, the bulls will try to propel the DOGE/USDT pair above the $0.09 resistance. If they succeed, the pair could start an uptrend toward the $0.10 to $0.11 resistance zone.
가격이 현재 수준에서 반등하면 강세론자들은 DOGE/USDT 쌍을 $0.09 저항선 위로 끌어올리려고 시도할 것입니다. 성공하면 $0.10~$0.11 저항 영역을 향해 상승 추세를 시작할 수 있습니다.
This positive view will be invalidated in the near term if the price turns down and plummets below the 50-day SMA ($0.08). The pair could then slump to the uptrend line. A break below this level will tilt the advantage in favor of the bears.
가격이 하락하고 50일 SMA(0.08달러) 아래로 급락하면 이러한 긍정적인 견해는 단기적으로 무효화됩니다. 그러면 통화쌍은 상승 추세선으로 하락할 수 있습니다. 이 수준 이하로 하락하면 하락세에게 유리한 방향으로 유리하게 기울어질 것입니다.
Chainlink price analysis
체인링크 가격 분석
Chainlink (LINK) has pulled back in an uptrend. The bears are trying to drag the price to the breakout level of $17.32.
체인링크(LINK)가 상승세로 돌아섰습니다. 하락세는 가격을 돌파 수준인 $17.32까지 끌어내려고 노력하고 있습니다.
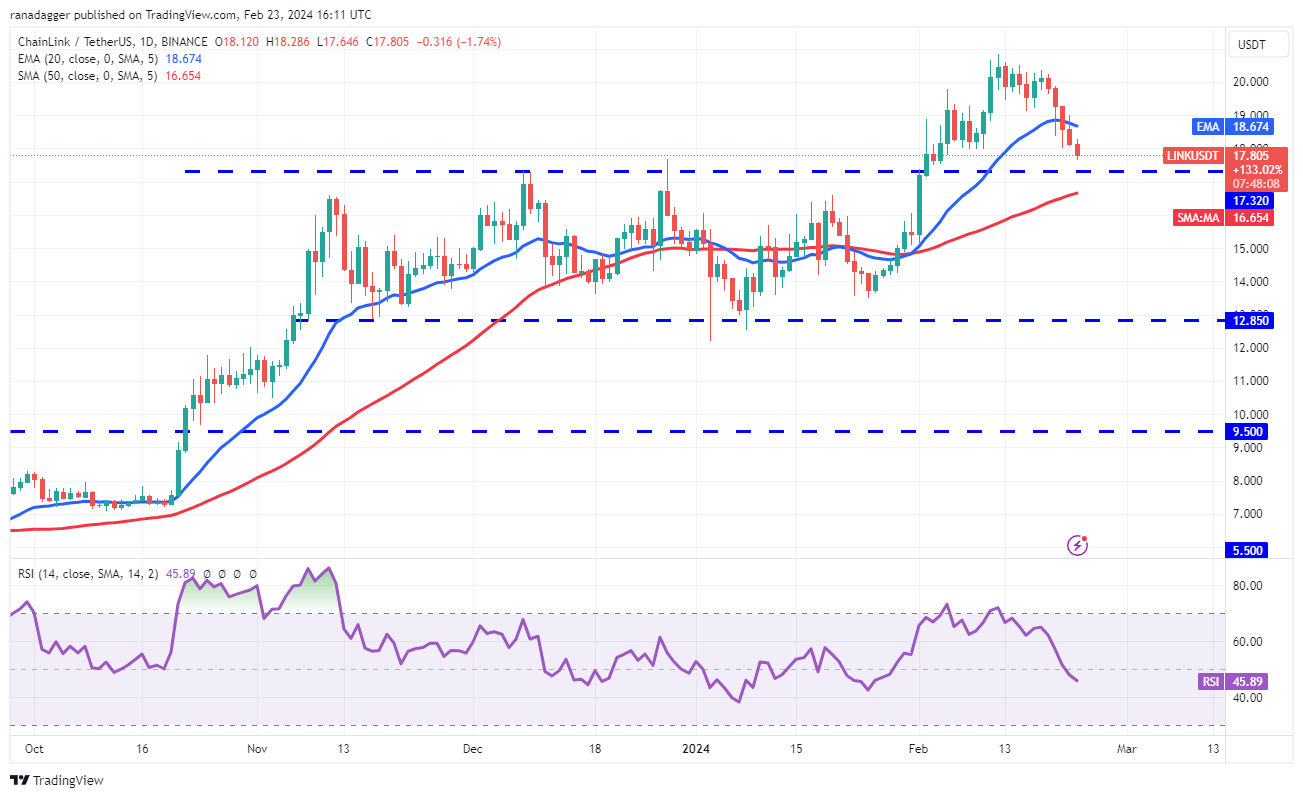
If the price rebounds off $17.32 with strength and rises above the 20-day EMA ($18.67), it will suggest that the bulls have flipped the level into support. That will increase the likelihood of a retest of $20.85.
가격이 17.32달러에서 강세를 보이며 반등하고 20일 EMA(18.67달러)를 넘어 상승한다면 상승세가 지지 수준으로 반전했음을 의미합니다. 그러면 $20.85의 재시험 가능성이 높아집니다.
The critical support to watch on the downside is the 50-day SMA ($16.65). If this level cracks, it will indicate that the bulls have given up. That may start a deeper correction to $15 and later to $12.85.
하락세에서 주목해야 할 중요한 지지선은 50일 SMA($16.65)입니다. 이 수준에 균열이 생기면 황소가 포기했음을 나타냅니다. 그러면 $15로 더 깊은 조정이 시작되고 나중에는 $12.85로 조정될 수 있습니다.
Polkadot price analysis
폴카닷 가격 분석
The bulls are trying to keep Polkadot (DOT) inside the ascending channel pattern, while the bears are striving to pull the price below it.
강세론자들은 Polkadot(DOT)을 상승 채널 패턴 내에 유지하려고 노력하는 반면, 약세론자들은 가격을 그 아래로 끌어내리려고 노력하고 있습니다.
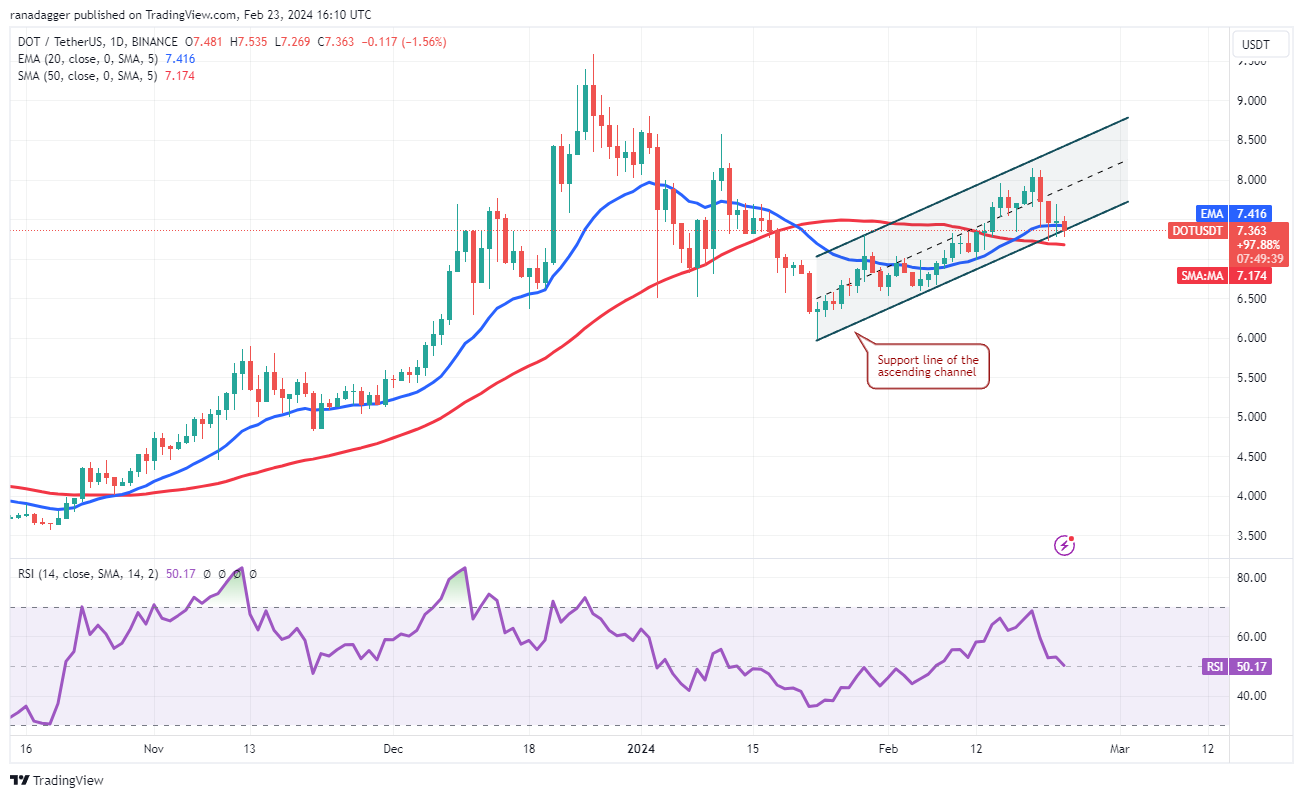
The flattish 20-day EMA ($7.41) and the RSI near the midpoint do not give a clear advantage either to the bulls or the bears. If the price breaks below the 50-day SMA ($7.17), the DOT/USDT pair could slide to $6.50.
평탄한 20일 EMA($7.41)와 중간 지점 근처의 RSI는 상승세나 하락세 모두에 뚜렷한 이점을 주지 않습니다. 가격이 50일 SMA(7.17달러) 아래로 떨어지면 DOT/USDT 쌍은 6.50달러로 하락할 수 있습니다.
On the other hand, a strong bounce off the current level will indicate that the bulls are fiercely defending the support line. That may keep the price inside the channel for some more time. The bulls will try to push the pair to the channel’s resistance line.
반면, 현재 수준에서 강한 반등이 일어난다면 상승세가 지지선을 맹렬하게 방어하고 있음을 나타냅니다. 그러면 가격이 한동안 채널 내부에 유지될 수 있습니다. 황소는 해당 쌍을 채널의 저항선으로 밀어 넣으려고 할 것입니다.
This article does not contain investment advice or recommendations. Every investment and trading move involves risk, and readers should conduct their own research when making a decision.
이 글에는 투자 조언이나 추천이 포함되어 있지 않습니다. 모든 투자 및 거래 활동에는 위험이 수반되므로 독자는 결정을 내릴 때 스스로 조사해야 합니다.
 BH NEWS
 Crypto News Flash
 Bitop Exchange
 Crypto News Land
 DogeHome
 TheCoinrise Media
 Coin Edition
 BlockchainReporter
 TheNewsCrypto


