Bitcoin’s (BTC) sharp rally is showing signs of a short-term pullback, which could be one of the reasons for the mere $132 million in inflows into the spot Bitcoin exchange-traded funds on March 14. A marked slowdown in inflows could start a corrective phase as Bitcoin’s most recent leg of the rally has largely been driven by solid inflows into the Bitcoin ETFs.
El fuerte repunte de Bitcoin (BTC) está mostrando signos de un retroceso a corto plazo, lo que podría ser una de las razones de los apenas 132 millones de dólares en entradas a los fondos cotizados en bolsa de Bitcoin el 14 de marzo. Una marcada desaceleración de las entradas podría iniciar una fase correctiva, ya que la etapa más reciente del repunte de Bitcoin ha sido impulsada en gran medida por sólidas entradas de capital en los ETF de Bitcoin.
If a correction starts in Bitcoin, how deep could that be? During previous halving cycles, Bitcoin has seen a drop close to 40%, according to a X (formerly Twitter) post by the pseudonymous trader known as Bags. If history were to repeat, then Bitcoin could plummet to about $45,500.
Si comienza una corrección en Bitcoin, ¿qué profundidad podría tener? Durante ciclos de reducción a la mitad anteriores, Bitcoin ha experimentado una caída cercana al 40%, según una publicación en X (anteriormente Twitter) del comerciante seudónimo conocido como Bags. Si la historia se repitiera, entonces Bitcoin podría caer en picado a unos 45.500 dólares.
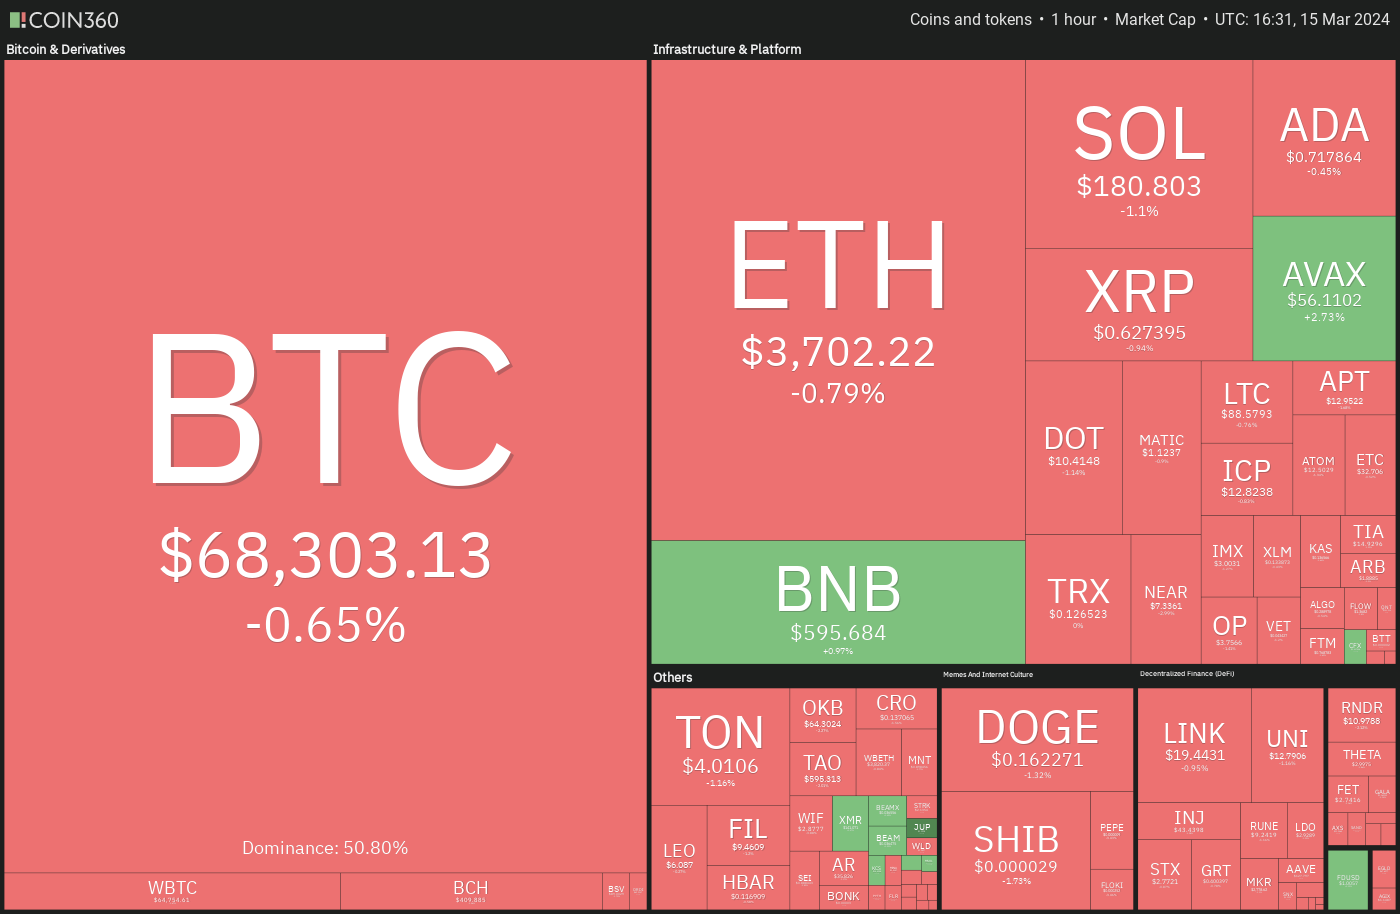
Corrections are a part of every bull market. A positive sign during the current pullback is that it is largely due to profit-booking on hedges and has not led to “panic shorting yet,” according to popular trader Skew.
Las correcciones son parte de todo mercado alcista. Una señal positiva durante el retroceso actual es que se debe en gran medida a la contabilización de beneficios en las coberturas y no ha provocado "aún una venta corta de pánico", según el popular comerciante Skew.
Could the correction in Bitcoin and altcoins deepen, or will the price rebound from the current levels? Let’s analyze the charts of the top 10 cryptocurrencies to find out.
¿Podría profundizarse la corrección en Bitcoin y altcoins, o el precio se recuperará de los niveles actuales? Analicemos los gráficos de las 10 principales criptomonedas para descubrirlo.
Bitcoin price analysis
Análisis de precios de Bitcoin
Bitcoin witnessed profit booking at $73,777 on March 14, but the bulls purchased the dip, as seen from the long tail on the candlestick.
Bitcoin fue testigo de una reserva de ganancias de $ 73,777 el 14 de marzo, pero los alcistas compraron la caída, como se ve desde la larga cola de la vela.
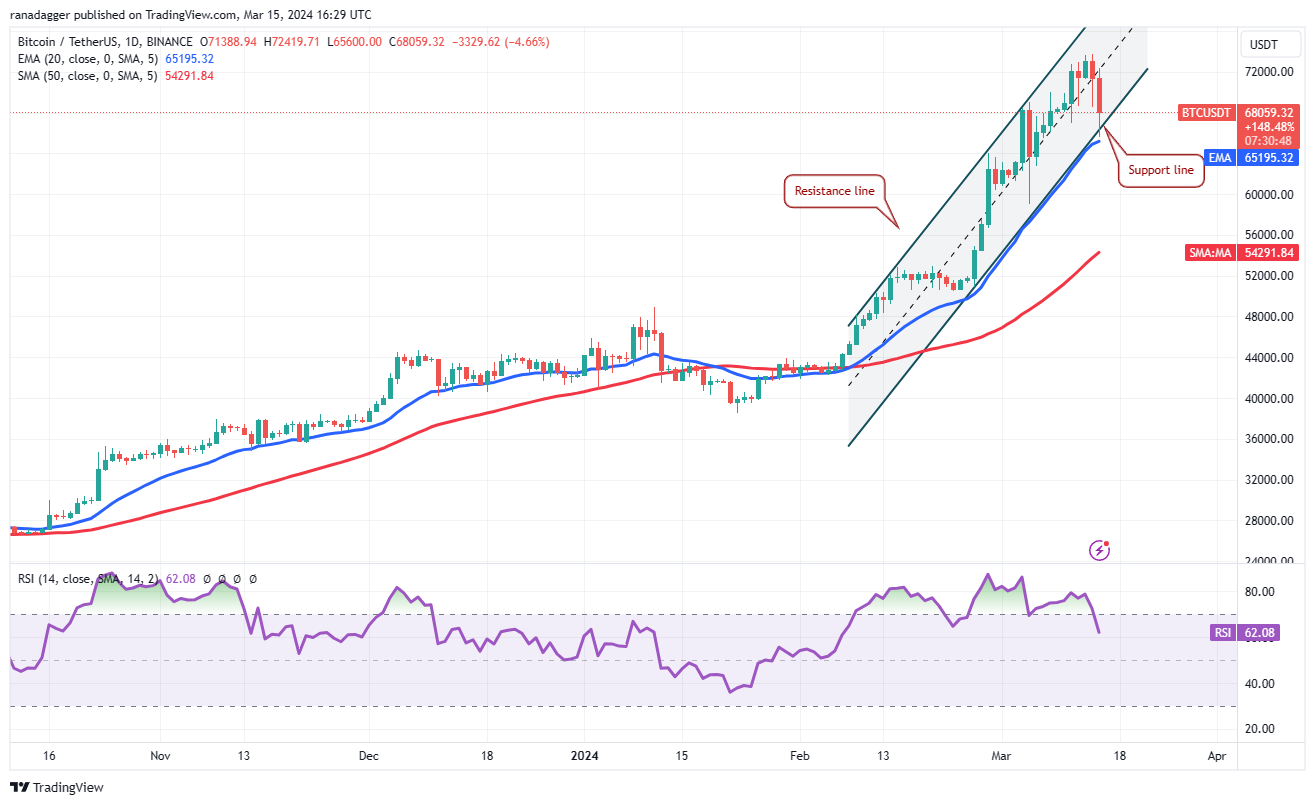
However, the failure to build upon the momentum on March 15 attracted strong selling by the short-term traders. The price has reached the support line of the ascending channel pattern, which is an important level to watch out for.
Sin embargo, la imposibilidad de aprovechar el impulso del 15 de marzo atrajo fuertes ventas por parte de los operadores a corto plazo. El precio ha alcanzado la línea de soporte del patrón del canal ascendente, que es un nivel importante al que hay que prestar atención.
If the price plummets below the channel and the 20-day exponential moving average ($65,195), it will indicate the start of a corrective phase. The BTC/USDT pair could slide to $59,000 and thereafter to the 50-day simple moving average ($54,291).
Si el precio cae por debajo del canal y la media móvil exponencial de 20 días ($65,195), indicará el inicio de una fase correctiva. El par BTC/USDT podría caer a $59,000 y luego al promedio móvil simple de 50 días ($54,291).
Contrarily, if the price bounces off the support line, it will suggest that the pair may remain inside the channel for some more time. The bulls will again try to push the price above the overhead resistance at $73,777.
Por el contrario, si el precio rebota en la línea de soporte, sugerirá que el par puede permanecer dentro del canal por más tiempo. Los alcistas volverán a intentar llevar el precio por encima de la resistencia superior de 73.777 dólares.
Ether price analysis
Análisis de precios de éter
Ether’s (ETH) up move stalled near $4,000, tempting short-term traders to book profits. The long tail on the March 14 candlestick shows the bulls tried to flip the $3,600 level into support, but the fall on March 15 shows that the bears have kept up the pressure.
El movimiento alcista de Ether (ETH) se estancó cerca de los $4,000, tentando a los operadores a corto plazo a registrar ganancias. La cola larga de la vela del 14 de marzo muestra que los alcistas intentaron convertir el nivel de $ 3,600 en soporte, pero la caída del 15 de marzo muestra que los bajistas han mantenido la presión.
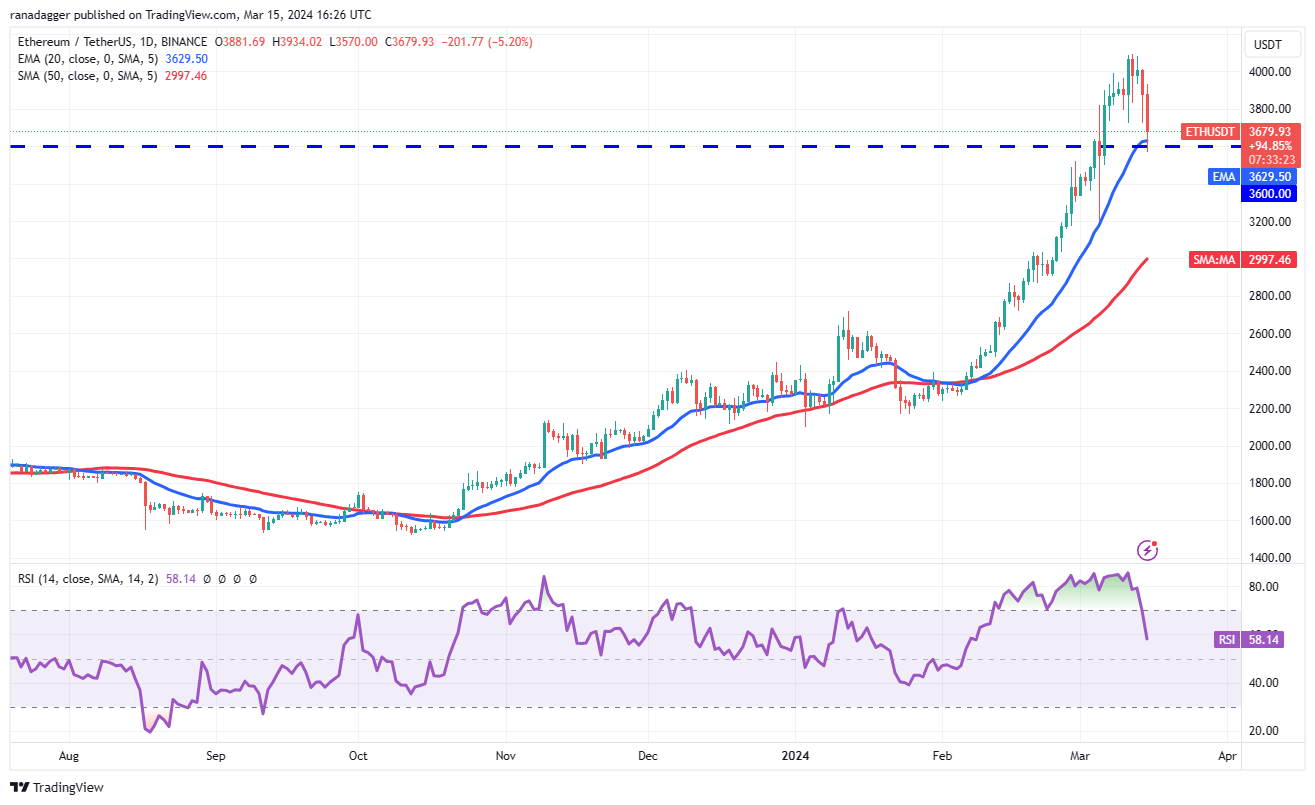
The bulls and the bears are likely to witness a tough battle near $3,600. If the price rebounds off this support, the bulls will again try to push the ETH/USDT pair to $4,000. The bears are expected to vigorously defend this level.
Es probable que los alcistas y los bajistas sean testigos de una dura batalla cerca de los 3.600 dólares. Si el precio rebota en este soporte, los alcistas intentarán nuevamente llevar el par ETH/USDT a $4,000. Se espera que los bajistas defiendan vigorosamente este nivel.
On the downside, the bears will try to yank the price below $3,600. If they do that, the selling could accelerate, and the ETH/USDT pair could slump to $3,200 and later to the 50-day SMA ($2,997). The greater the fall, the longer it will take for the pair to resume the uptrend.
En el lado negativo, los bajistas intentarán bajar el precio por debajo de $ 3,600. Si hacen eso, las ventas podrían acelerarse y el par ETH/USDT podría caer a $3200 y luego a la SMA de 50 días ($2997). Cuanto mayor sea la caída, más tiempo tardará el par en reanudar la tendencia alcista.
BNB price analysis
Análisis de precios de BNB
BNB (BNB) has pulled back in a strong uptrend, indicating that the traders are booking profits after a sharp rally.
BNB (BNB) ha retrocedido en una fuerte tendencia alcista, lo que indica que los comerciantes están obteniendo ganancias después de un fuerte repunte.
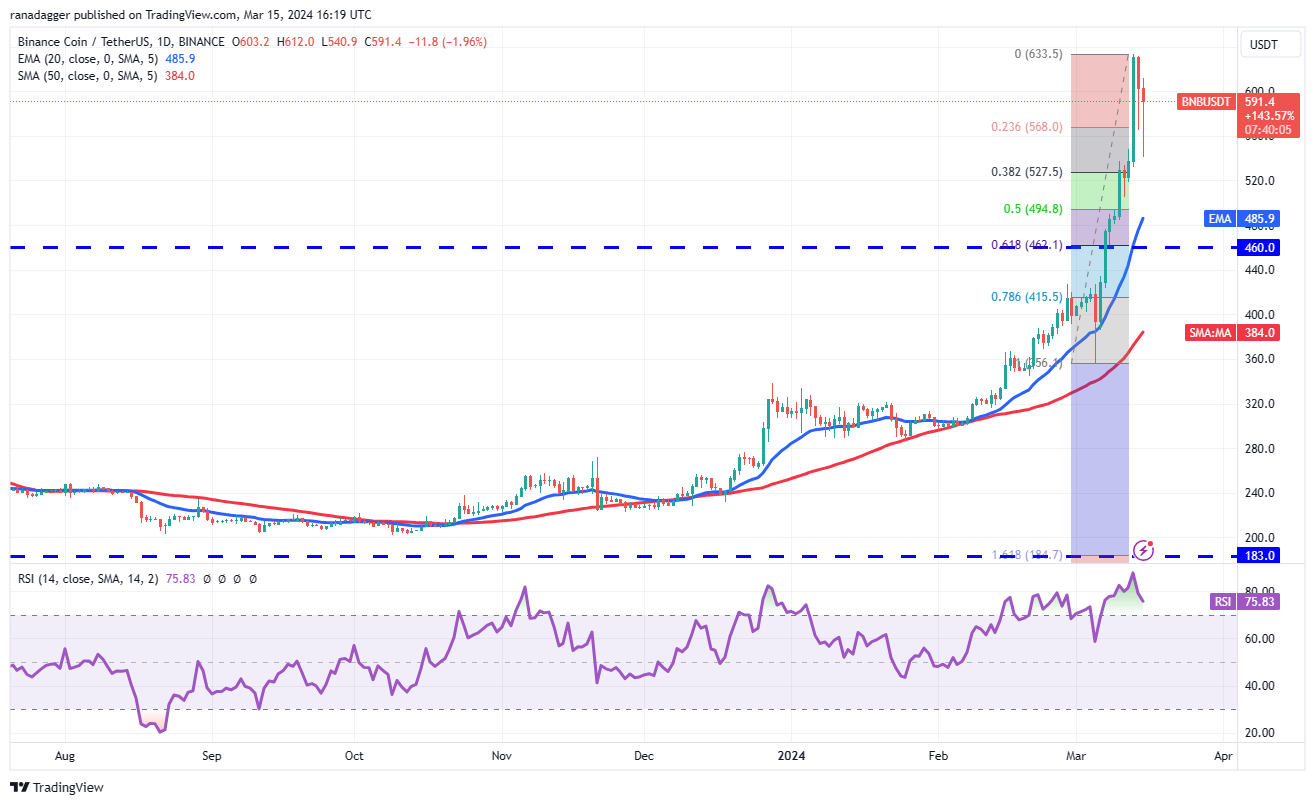
However, the long tail on the March 15 candlestick shows that the bulls are not ready to give up and are buying at the 38.2% Fibonacci retracement level of $527.50.
Sin embargo, la cola larga de la vela del 15 de marzo muestra que los alcistas no están dispuestos a darse por vencidos y están comprando en el nivel de retroceso de Fibonacci del 38,2% de 527,50 dólares.
A shallow pullback is a positive sign as it shows the bulls are not waiting for a deeper correction to enter. That increases the possibility of a break above $633. The pair may then climb to the $670 to $692 resistance zone.
Un retroceso superficial es una señal positiva, ya que muestra que los alcistas no están esperando a que entre una corrección más profunda. Eso aumenta la posibilidad de una ruptura por encima de 633 dólares. Luego, el par puede subir a la zona de resistencia de $670 a $692.
Contrary to this assumption, if the price turns down from the current level and breaks below $527, it will signal that every rally is being sold into. The BNB/USDT pair may then tumble to the 20-day EMA ($485).
Contrariamente a esta suposición, si el precio baja del nivel actual y cae por debajo de $ 527, indicará que se están vendiendo todos los repuntes. El par BNB/USDT podría caer hasta la EMA de 20 días ($485).
Solana price analysis
Análisis de precios de Solana
Solana (SOL) has been in a strong uptrend for the past few days, indicating solid demand at higher levels.
Solana (SOL) ha estado en una fuerte tendencia alcista durante los últimos días, lo que indica una demanda sólida en niveles más altos.
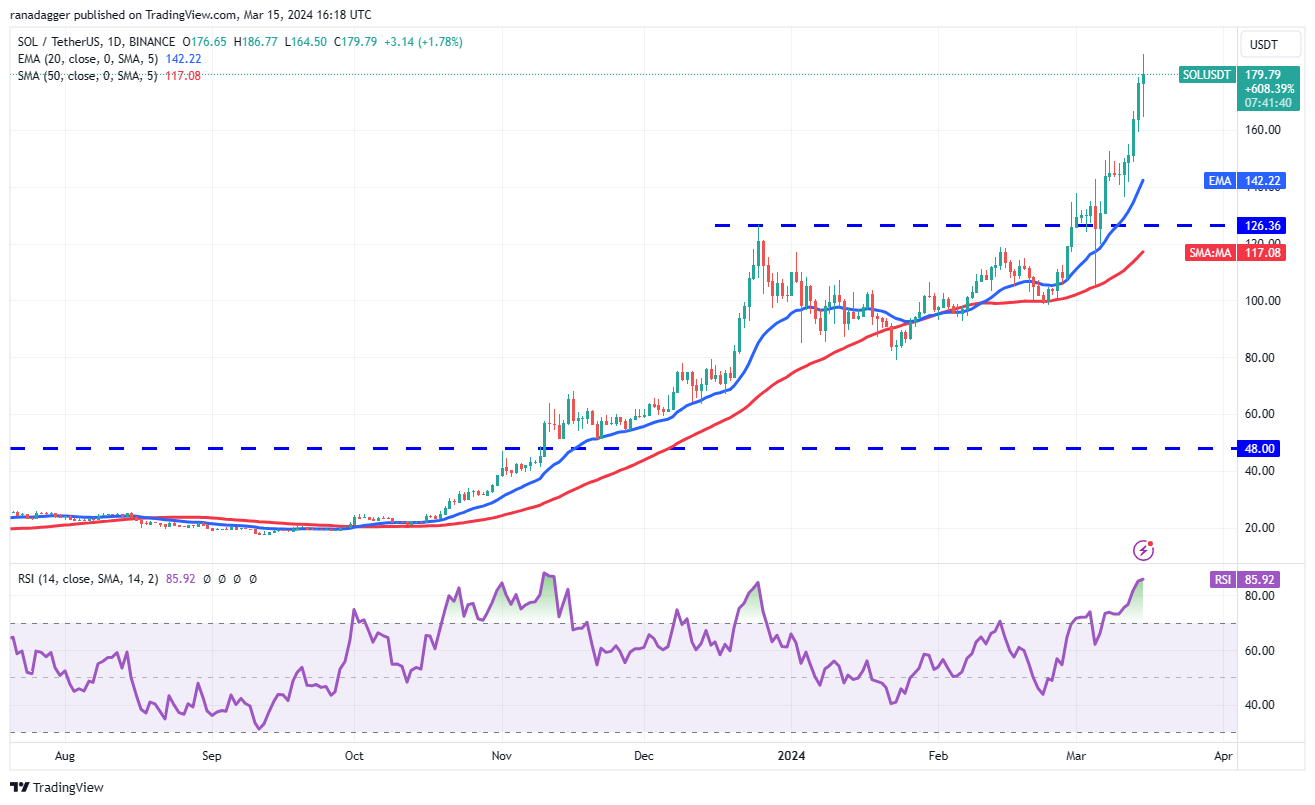
The up move has pushed the RSI deep into the overbought territory, suggesting that the SOL/USDT pair may have run up too fast in a short time. That could start a correction, which could pull the pair to the 20-day EMA ($142).
El movimiento ascendente ha empujado al RSI profundamente hacia el territorio de sobrecompra, lo que sugiere que el par SOL/USDT puede haber subido demasiado rápido en poco tiempo. Eso podría iniciar una corrección, que podría llevar al par a la EMA de 20 días ($142).
If the price rebounds off the 20-day EMA, it will suggest that the sentiment remains positive and traders are buying on dips. That may enhance the prospects of a rally to $205. This optimistic view will be negated on a break below the 20-day EMA. The pair may then slump to the breakout level at $126.
Si el precio rebota en la EMA de 20 días, sugerirá que el sentimiento sigue siendo positivo y que los operadores están comprando en las caídas. Eso puede mejorar las perspectivas de un repunte hasta los 205 dólares. Esta visión optimista se verá anulada en caso de una ruptura por debajo de la EMA de 20 días. Luego, el par podría caer hasta el nivel de ruptura de 126 dólares.
XRP price analysis
Análisis de precios XRP
XRP (XRP) turned down from $0.74 on March 12, indicating that the bears are fiercely defending the level.
XRP (XRP) bajó desde $0,74 el 12 de marzo, lo que indica que los bajistas están defendiendo ferozmente el nivel.
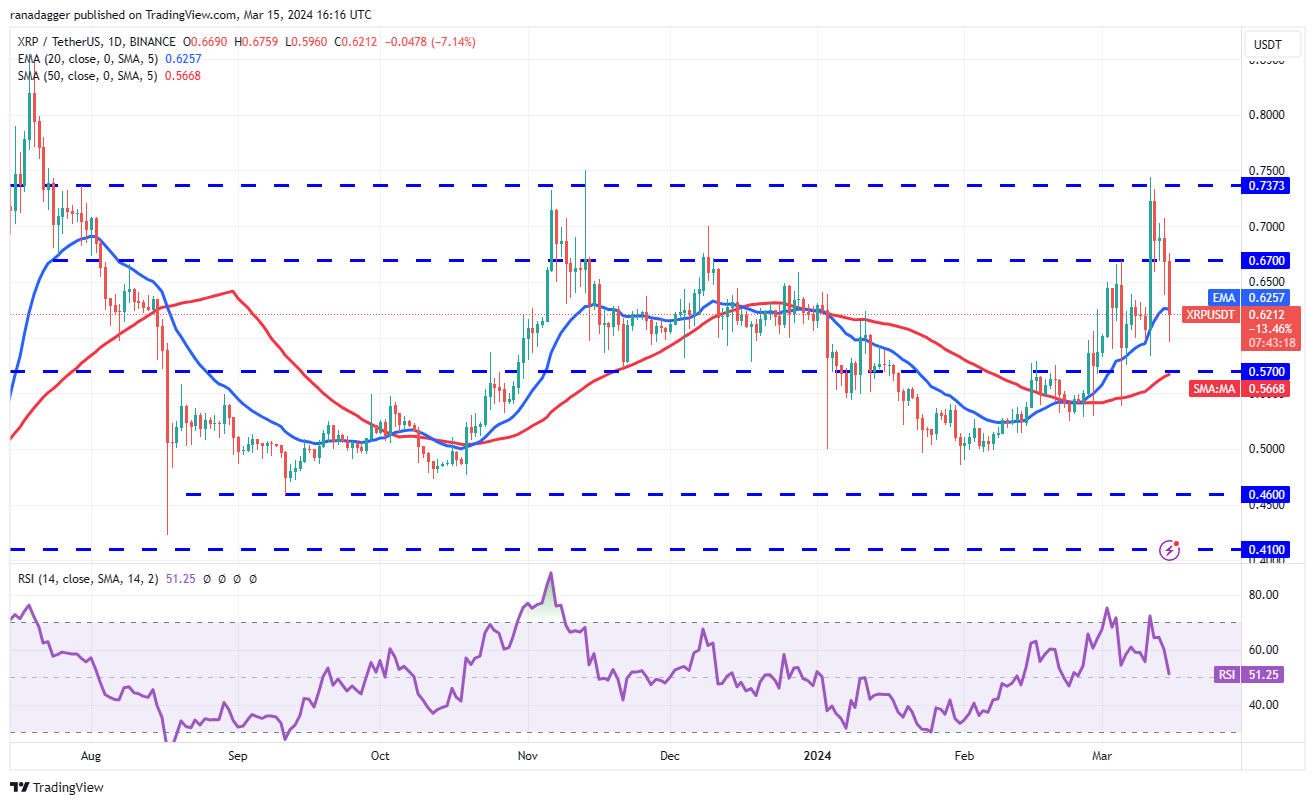
The bulls tried to flip $0.67 into support on March 13, but the bears had other plans. They continued their selling and pulled the price back below the $0.67 level on March 14.
Los alcistas intentaron convertir 0,67 dólares en soporte el 13 de marzo, pero los bajistas tenían otros planes. Continuaron vendiendo y bajaron el precio por debajo del nivel de 0,67 dólares el 14 de marzo.
The selling increased further on March 15, and the XRP/USDT pair broke below the 20-day EMA ($0.62). This suggests that the pair may consolidate inside a large range between $0.50 and $0.74 for some time. A break and close above $0.74 will signal the start of a new uptrend toward $1.02.
Las ventas aumentaron aún más el 15 de marzo y el par XRP/USDT rompió por debajo de la EMA de 20 días ($0,62). Esto sugiere que el par puede consolidarse dentro de un amplio rango entre $0,50 y $0,74 durante algún tiempo. Una ruptura y un cierre por encima de 0,74 dólares señalarán el inicio de una nueva tendencia alcista hacia 1,02 dólares.
Cardano price analysis
Análisis de precios de Cardano
The bulls tried to kick Cardano (ADA) above the overhead resistance of $0.80 on March 14, but the long wick on the candlestick shows selling at higher levels.
Los alcistas intentaron impulsar a Cardano (ADA) por encima de la resistencia superior de 0,80 dólares el 14 de marzo, pero la mecha larga de la vela muestra ventas en niveles más altos.
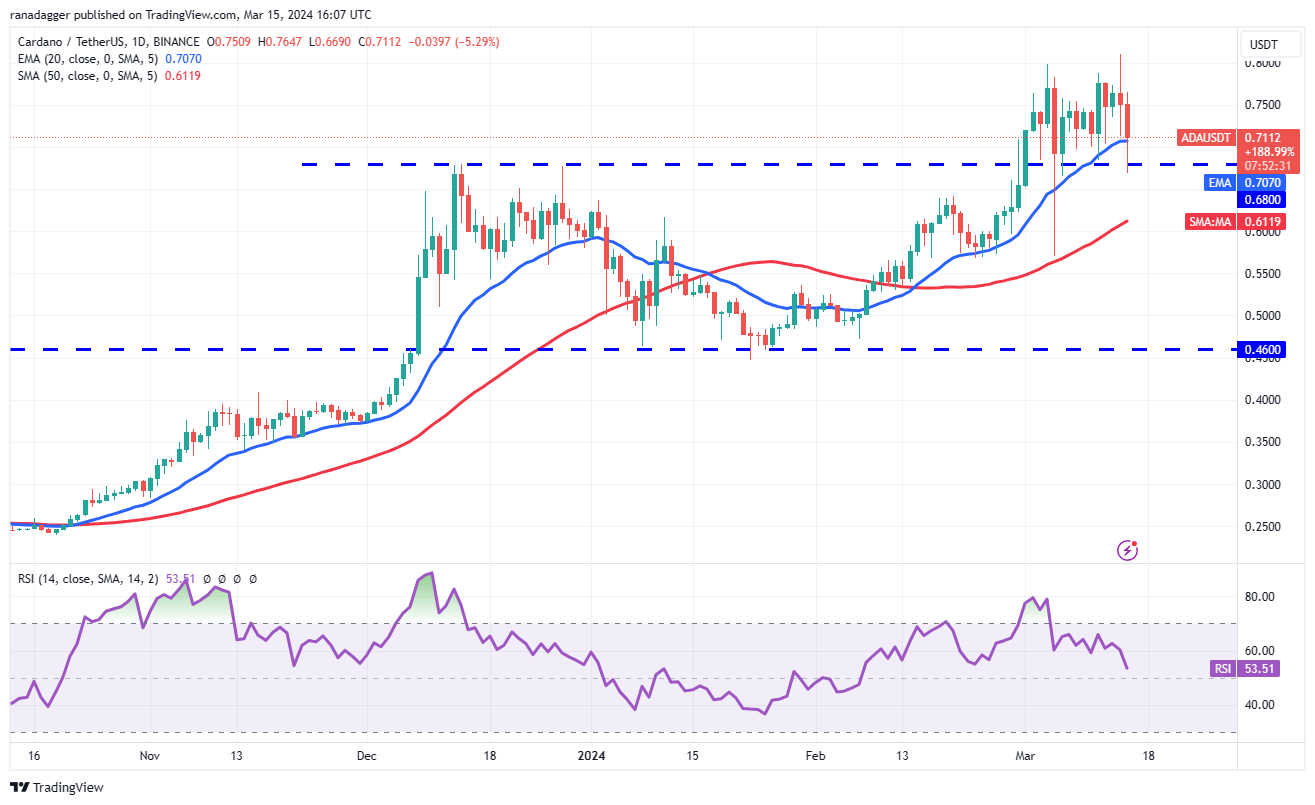
The price turned down sharply, and the price dipped to the breakout level of $0.68 on March 15. If bears sink the price below $0.68, it will signal the start of a deeper correction toward the 50-day SMA ($0.61).
El precio bajó bruscamente y cayó al nivel de ruptura de $ 0,68 el 15 de marzo. Si los bajistas hunden el precio por debajo de $ 0,68, señalará el comienzo de una corrección más profunda hacia la SMA de 50 días ($ 0,61).
Alternatively, if the price rebounds off $0.68, it will suggest that the bulls continue to buy near strong support levels. The ADA/USDT pair could then swing between $0.68 and $0.80 for a while. A break above $0.80 could launch the pair to $0.92.
Alternativamente, si el precio rebota en 0,68 dólares, sugerirá que los alcistas continúan comprando cerca de niveles de soporte fuertes. El par ADA/USDT podría oscilar entre $0,68 y $0,80 por un tiempo. Una ruptura por encima de USD 0,80 podría lanzar el par a USD 0,92.
Dogecoin price analysis
Análisis de precios de Dogecoin
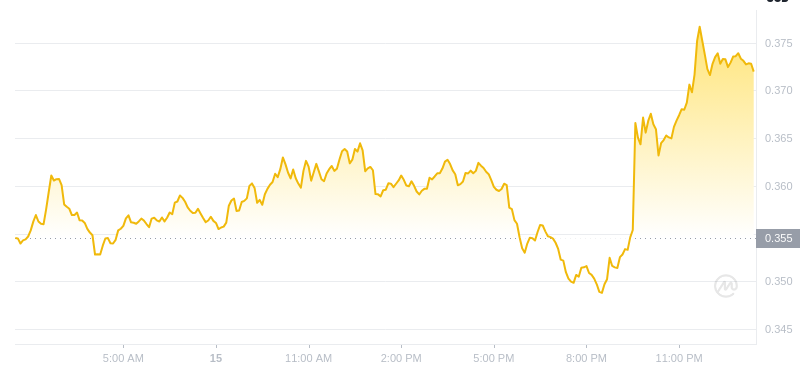
Dogecoin (DOGE) rose above the $0.18 resistance on March 14, but the long wick on the candlestick shows selling at higher levels.
Dogecoin (DOGE) superó la resistencia de 0,18 dólares el 14 de marzo, pero la mecha larga de la vela muestra ventas en niveles más altos.
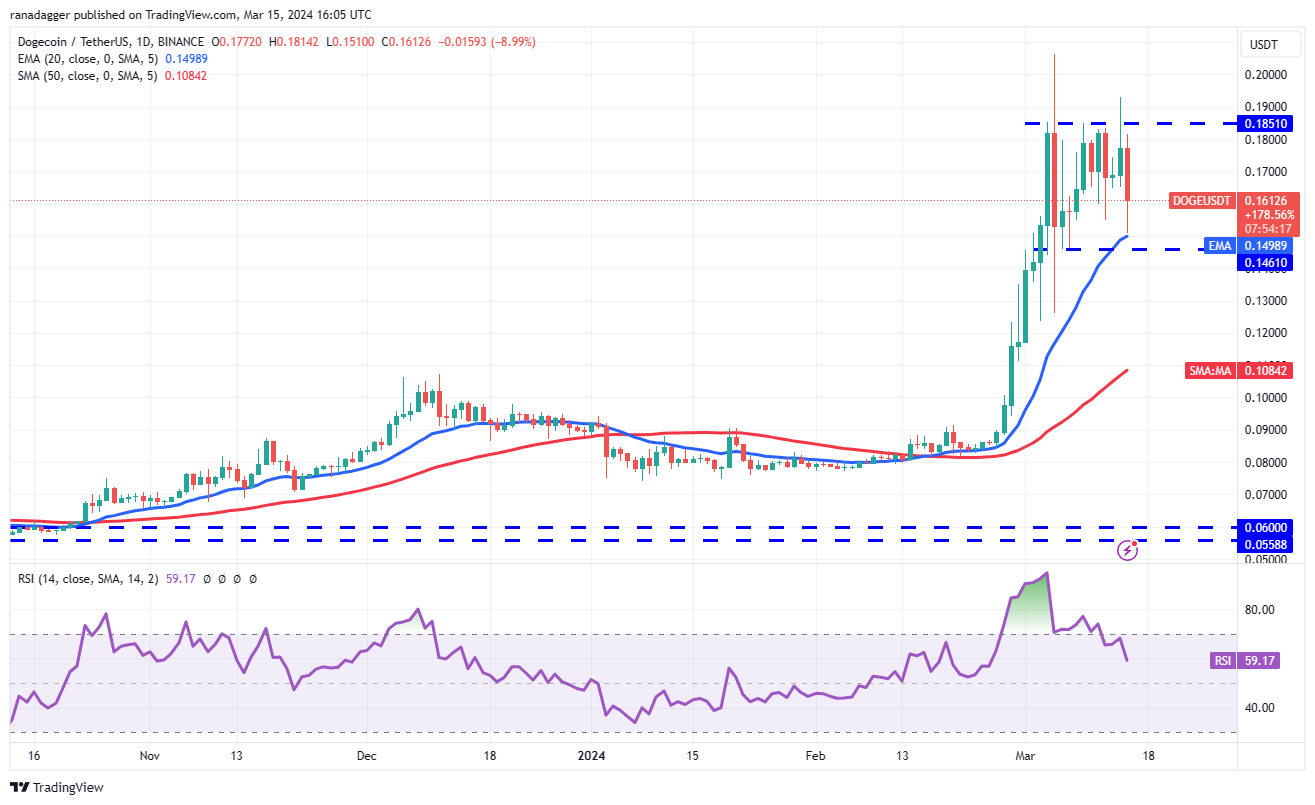
The price turned down sharply and reached the 20-day EMA ($0.15) on March 15. This suggests that the DOGE/USDT pair may remain stuck inside the range for a few more days. A break and close below $0.15 will tilt the advantage in favor of the bears. The pair could then tumble toward $0.12.
El precio bajó bruscamente y alcanzó la EMA de 20 días ($0,15) el 15 de marzo. Esto sugiere que el par DOGE/USDT puede permanecer estancado dentro del rango durante unos días más. Una ruptura y un cierre por debajo de USD 0,15 inclinarán la ventaja a favor de los bajistas. El par podría entonces caer hacia los 0,12 dólares.
Contrarily, a rally above $0.18 will suggest that the bulls have absorbed the supply. That will open the doors for a rally to $0.24 and then $0.30.
Por el contrario, un repunte por encima de 0,18 dólares sugerirá que los alcistas han absorbido la oferta. Eso abrirá las puertas para un repunte a 0,24 dólares y luego a 0,30 dólares.
Related: Bitcoin overtakes gold in investor portfolio allocation — JPMorgan
Relacionado: Bitcoin supera al oro en la asignación de carteras de inversores – JPMorgan
Avalanche price analysis
Análisis de precios de avalancha
Avalanche (AVAX) witnessed a large range day with a long wick and a long tail on March 14, indicating indecision between the bulls and the bears.
Avalanche (AVAX) fue testigo de un día de gran rango con una mecha larga y una cola larga el 14 de marzo, lo que indica indecisión entre los alcistas y los bajistas.
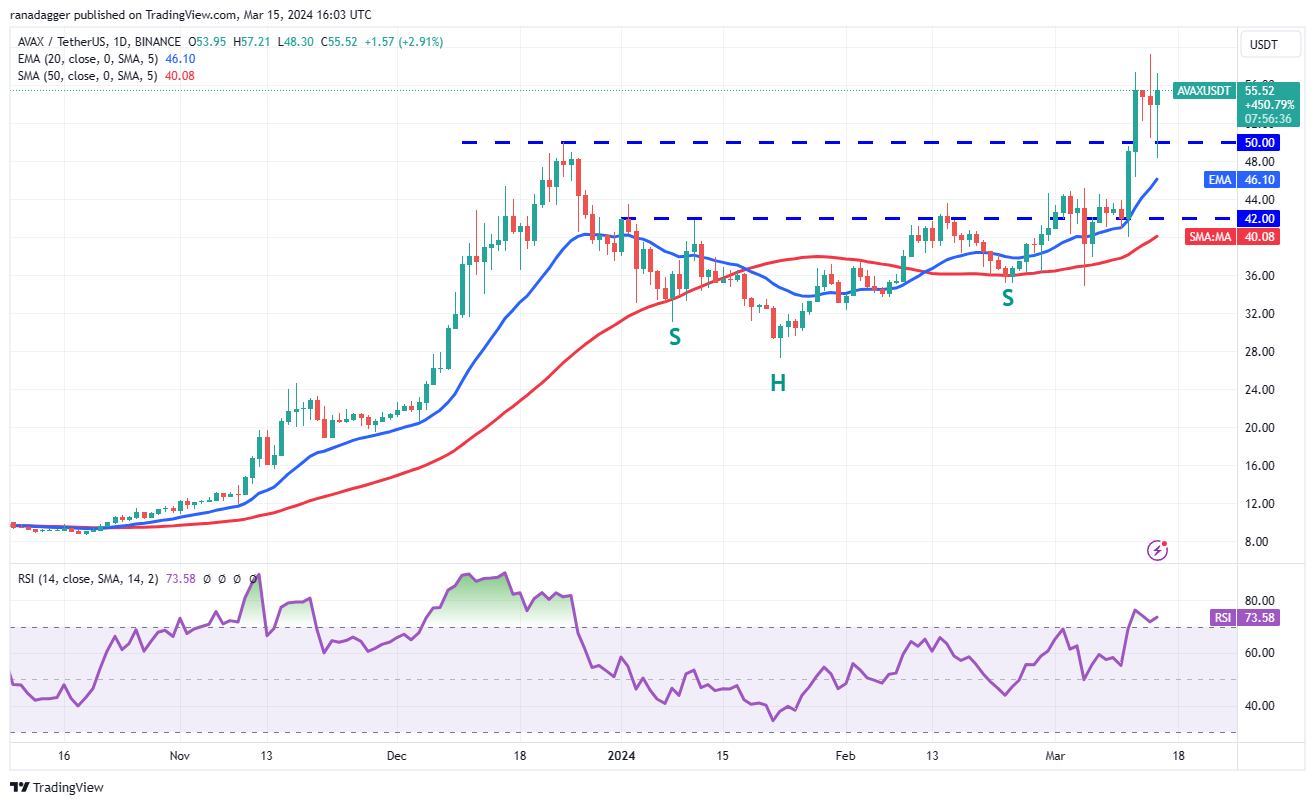
The bears tried to strengthen their position on March 15, but the long tail on the candlestick shows solid buying near the breakout level of $50. This suggests that the bulls are trying to flip $50 into support. If buyers shove the price above $59, the AVAX/USDT pair could resume its uptrend to $87.
Los bajistas intentaron fortalecer su posición el 15 de marzo, pero la cola larga de la vela muestra compras sólidas cerca del nivel de ruptura de 50 dólares. Esto sugiere que los alcistas están tratando de convertir los 50 dólares en soporte. Si los compradores elevan el precio por encima de $59, el par AVAX/USDT podría reanudar su tendencia alcista a $87.
If bears want to prevent the upside, they will have to maintain the price below the 20-day EMA. That could sink the pair to the 50-day SMA ($40).
Si los bajistas quieren evitar la subida, tendrán que mantener el precio por debajo de la EMA de 20 días. Eso podría hundir el par hasta la SMA de 50 días ($40).
Shiba Inu price analysis
Análisis de precios de Shiba Inu
Shiba Inu (SHIB) tumbled below the $0.000029 support on March 15, indicating that the bears are trying to establish their supremacy.
Shiba Inu (SHIB) cayó por debajo del soporte de $0,000029 el 15 de marzo, lo que indica que los bajistas están tratando de establecer su supremacía.
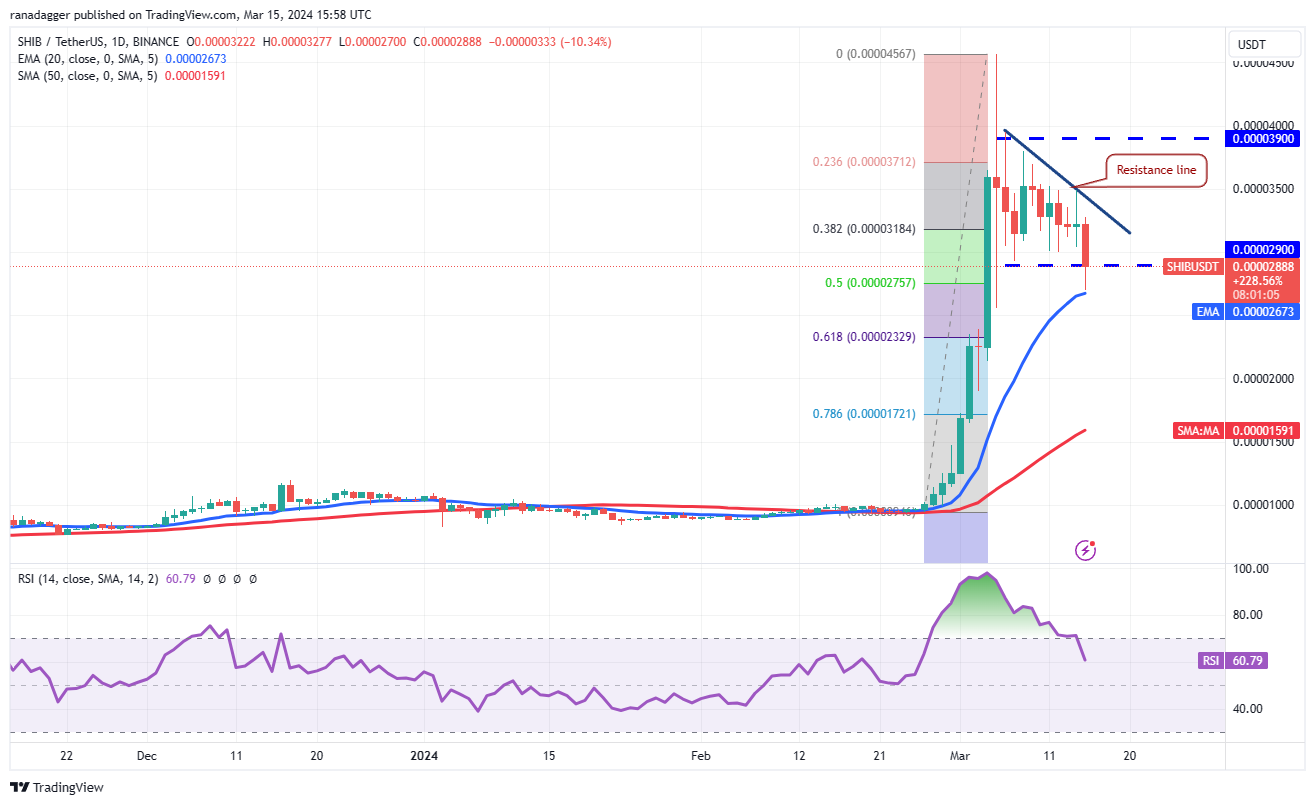
The bulls are trying to defend the 20-day EMA ($0.000027), but the recovery is expected to face selling at the downtrend line. If the price turns lower from the downtrend line, it will increase the likelihood of a slide to the 61.8% Fibonacci retracement level of $0.000023 and then $0.000019.
Los alcistas están tratando de defender la EMA de 20 días ($0,000027), pero se espera que la recuperación enfrente ventas en la línea de tendencia bajista. Si el precio baja desde la línea de tendencia bajista, aumentará la probabilidad de una caída al nivel de retroceso de Fibonacci del 61,8% de USD 0,000023 y luego de USD 0,000019.
Conversely, if the price turns up and breaks above the downtrend line, it will suggest that the markets have rejected the lower levels. The SHIB/USDT pair could rally to the overhead resistance of $0.000039.
Por el contrario, si el precio sube y supera la línea de tendencia bajista, sugerirá que los mercados han rechazado los niveles más bajos. El par SHIB/USDT podría recuperarse hasta la resistencia superior de USD 0,000039.
Polkadot price analysis
Análisis de precios de lunares
Polkadot (DOT) turned down from $11.88 on March 14, and the selling picked up momentum on March 15.
Polkadot (DOT) bajó de 11,88 dólares el 14 de marzo y las ventas cobraron impulso el 15 de marzo.
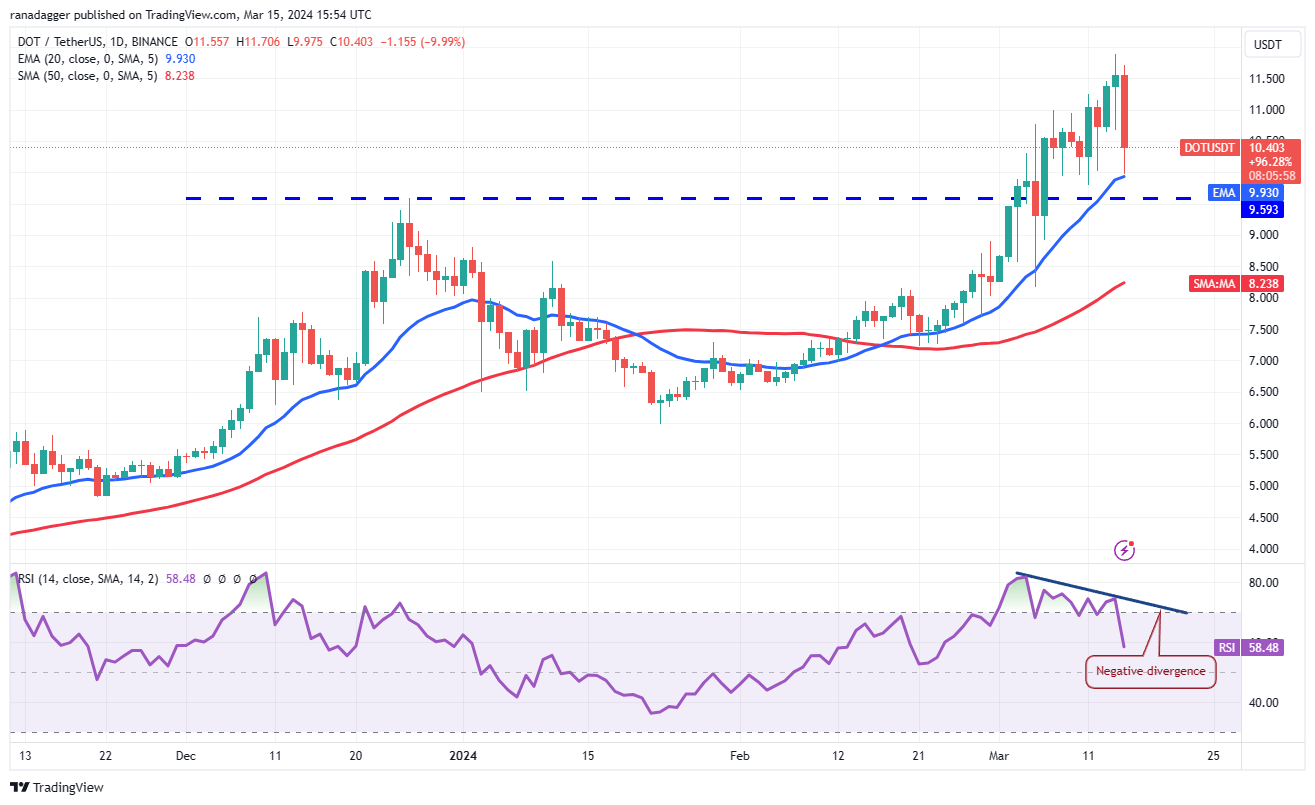
The negative divergence on the RSI suggests that the bullish momentum is waning. That increases the risk of a drop below the 20-day EMA ($9.93) and the breakout level of $9.59. If that happens, the DOT/USDT pair may start a deeper pullback. The pair could then decline to the 50-day SMA ($8.23).
La divergencia negativa del RSI sugiere que el impulso alcista está disminuyendo. Eso aumenta el riesgo de una caída por debajo de la EMA de 20 días (9,93 dólares) y el nivel de ruptura de 9,59 dólares. Si eso sucede, el par DOT/USDT puede iniciar un retroceso más profundo. Luego, el par podría caer hasta la SMA de 50 días ($8,23).
On the other hand, if the price rebounds off the 20-day EMA with strength, the bulls will again try to push the price to $11.88.
Por otro lado, si el precio rebota con fuerza en la EMA de 20 días, los alcistas volverán a intentar llevar el precio a 11,88 dólares.
This article does not contain investment advice or recommendations. Every investment and trading move involves risk, and readers should conduct their own research when making a decision.
Este artículo no contiene consejos ni recomendaciones de inversión. Cada movimiento de inversión y comercio implica riesgos, y los lectores deben realizar su propia investigación al tomar una decisión.


 Cointelegraph
 Crypto Intelligence
 DogeHome
 Crypto News Land
 Crypto Daily™
 Crypto Intelligence
 Crypto Daily™
 CaptainAltcoin
 Thecryptoupdates


