

Bitcoin’s (BTC) sharp rally is showing signs of a short-term pullback, which could be one of the reasons for the mere $132 million in inflows into the spot Bitcoin exchange-traded funds on March 14. A marked slowdown in inflows could start a corrective phase as Bitcoin’s most recent leg of the rally has largely been driven by solid inflows into the Bitcoin ETFs.
比特幣 (BTC) 的大幅上漲正顯示出短期回調的跡象,這可能是 3 月 14 日僅有 1.32 億美元流入現貨比特幣交易所交易基金的原因之一。比特幣最近的上漲很大程度上是由比特幣ETF 的大量資金流入所推動的。
If a correction starts in Bitcoin, how deep could that be? During previous halving cycles, Bitcoin has seen a drop close to 40%, according to a X (formerly Twitter) post by the pseudonymous trader known as Bags. If history were to repeat, then Bitcoin could plummet to about $45,500.
如果比特幣開始調整,調整的深度會有多深?根據化名為 Bags 的 X(前 Twitter)帖子,在先前的減半週期中,比特幣下跌了近 40%。如果歷史重演,那麼比特幣可能會暴跌至 45,500 美元左右。
Corrections are a part of every bull market. A positive sign during the current pullback is that it is largely due to profit-booking on hedges and has not led to “panic shorting yet,” according to popular trader Skew.
調整是每個牛市的一部分。受歡迎的交易商 Skew 表示,目前回檔期間的一個積極跡像是,這主要是由於對沖獲利預訂,並且尚未導致「恐慌性做空」。
Could the correction in Bitcoin and altcoins deepen, or will the price rebound from the current levels? Let’s analyze the charts of the top 10 cryptocurrencies to find out.
比特幣和山寨幣的調整是否會加深,或者價格會從當前水平反彈?讓我們分析一下前 10 名加密貨幣的圖表來找出答案。
Bitcoin price analysis
比特幣價格分析
Bitcoin witnessed profit booking at $73,777 on March 14, but the bulls purchased the dip, as seen from the long tail on the candlestick.
3 月 14 日,比特幣利潤錄得 73,777 美元,但多頭逢低買入,從燭台上的長尾可以看出。
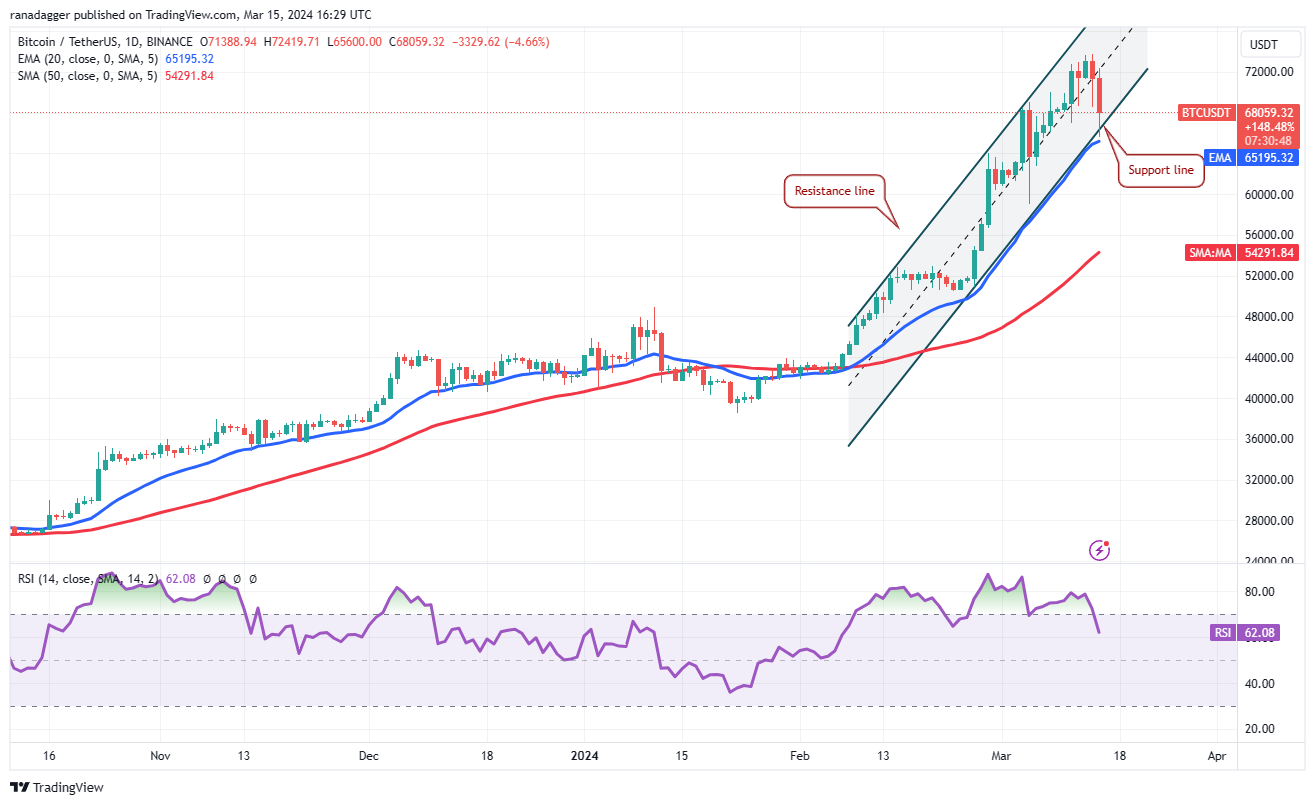
However, the failure to build upon the momentum on March 15 attracted strong selling by the short-term traders. The price has reached the support line of the ascending channel pattern, which is an important level to watch out for.
然而,3 月 15 日的勢頭未能延續,吸引了短期交易者的大力拋售。價格已達到上升通道形態的支撐線,這是一個值得關注的重要水準。
If the price plummets below the channel and the 20-day exponential moving average ($65,195), it will indicate the start of a corrective phase. The BTC/USDT pair could slide to $59,000 and thereafter to the 50-day simple moving average ($54,291).
如果價格跌破通道和 20 天指數移動平均線(65,195 美元),則表示修正階段的開始。 BTC/USDT 貨幣對可能會下滑至 59,000 美元,然後跌至 50 天簡單移動平均線(54,291 美元)。
Contrarily, if the price bounces off the support line, it will suggest that the pair may remain inside the channel for some more time. The bulls will again try to push the price above the overhead resistance at $73,777.
相反,如果價格從支撐線反彈,則表示該貨幣對可能會在通道內停留一段時間。多頭將再次嘗試將價格推高至上方阻力位 73,777 美元。
Ether price analysis
以太幣價格分析
Ether’s (ETH) up move stalled near $4,000, tempting short-term traders to book profits. The long tail on the March 14 candlestick shows the bulls tried to flip the $3,600 level into support, but the fall on March 15 shows that the bears have kept up the pressure.
以太坊 (ETH) 的漲勢在 4,000 美元附近停滯,吸引短期交易者獲利了結。 3 月 14 日燭台上的長尾顯示多頭試圖將 3,600 美元的水平轉變為支撐位,但 3 月 15 日的下跌表明空頭一直在承受壓力。
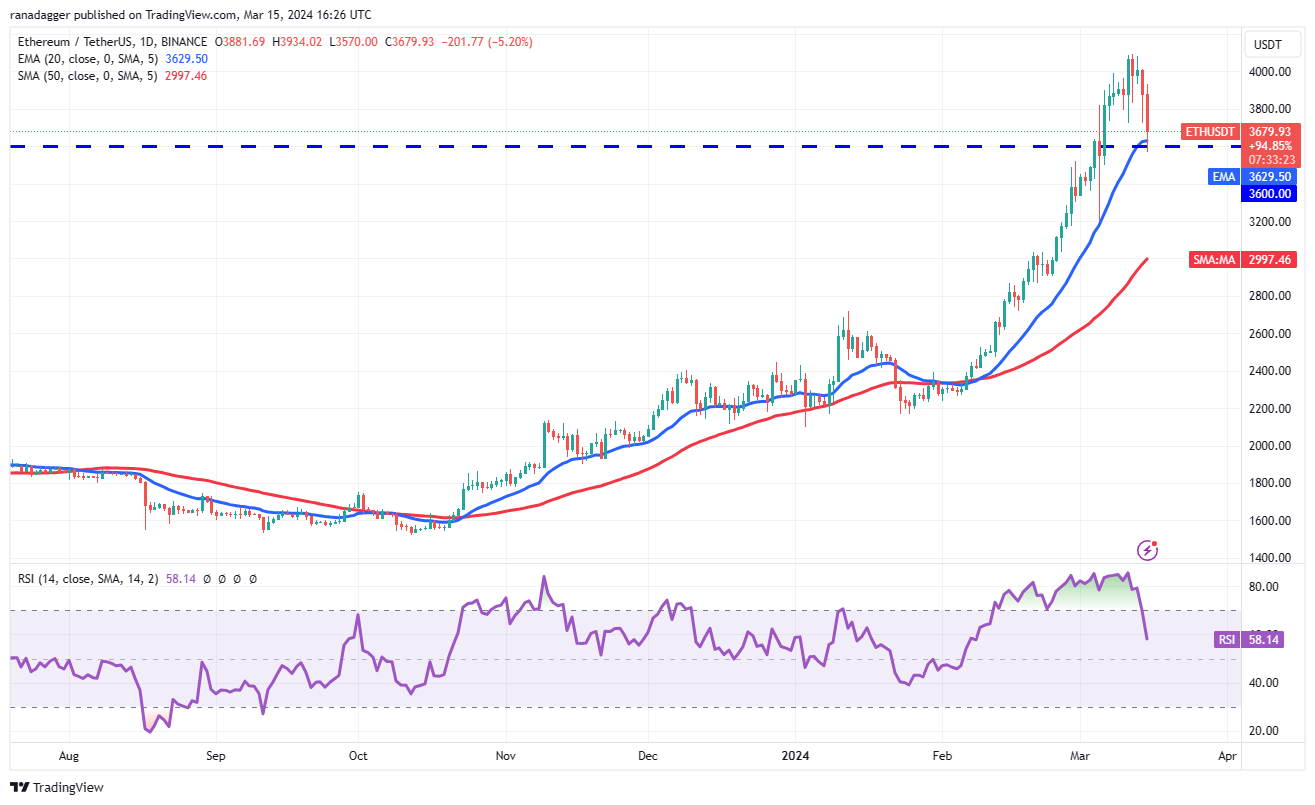
The bulls and the bears are likely to witness a tough battle near $3,600. If the price rebounds off this support, the bulls will again try to push the ETH/USDT pair to $4,000. The bears are expected to vigorously defend this level.
多頭和空頭可能會在 3,600 美元附近見證一場硬仗。如果價格從該支撐位反彈,多頭將再次嘗試將 ETH/USDT 貨幣對推至 4,000 美元。預計空頭將大力捍衛這一水平。
On the downside, the bears will try to yank the price below $3,600. If they do that, the selling could accelerate, and the ETH/USDT pair could slump to $3,200 and later to the 50-day SMA ($2,997). The greater the fall, the longer it will take for the pair to resume the uptrend.
不利的一面是,空頭將試圖將價格拉至 3,600 美元以下。如果他們這樣做,拋售可能會加速,ETH/USDT 貨幣對可能會跌至 3,200 美元,然後跌至 50 日移動平均線(2,997 美元)。跌幅越大,貨幣對恢復上升趨勢所需的時間就越長。
BNB price analysis
BNB價格分析
BNB (BNB) has pulled back in a strong uptrend, indicating that the traders are booking profits after a sharp rally.
BNB(BNB)在強勁的上漲趨勢中出現回調,顯示交易者在大幅上漲後正在獲利了結。
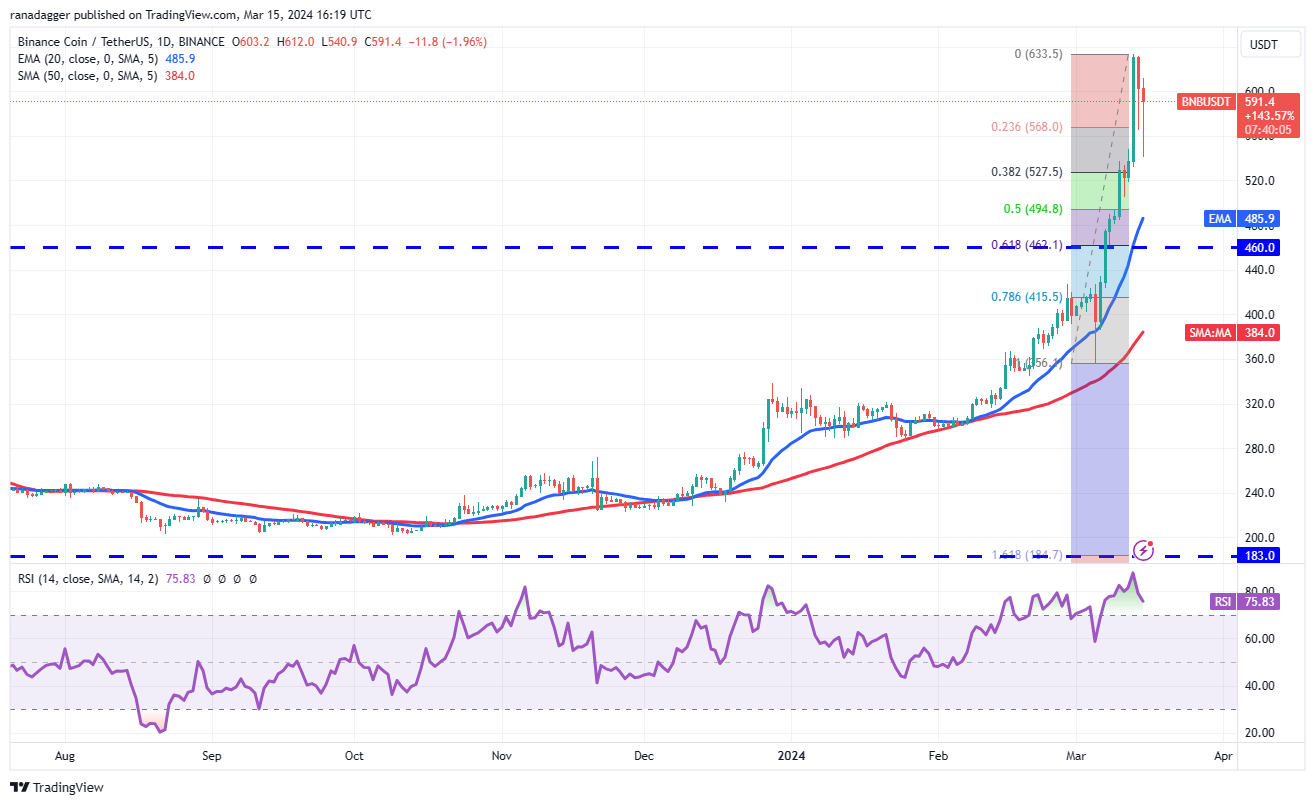
However, the long tail on the March 15 candlestick shows that the bulls are not ready to give up and are buying at the 38.2% Fibonacci retracement level of $527.50.
然而,3 月 15 日燭台上的長尾表明多頭尚未準備好放棄,並在 527.50 美元的 38.2% 斐波那契回撤位買入。
A shallow pullback is a positive sign as it shows the bulls are not waiting for a deeper correction to enter. That increases the possibility of a break above $633. The pair may then climb to the $670 to $692 resistance zone.
小幅回調是一個積極信號,因為它表明多頭並沒有等待更深的回調進入。這增加了突破 633 美元的可能性。隨後該貨幣對可能會攀升至 670 美元至 692 美元的阻力區。
Contrary to this assumption, if the price turns down from the current level and breaks below $527, it will signal that every rally is being sold into. The BNB/USDT pair may then tumble to the 20-day EMA ($485).
與這一假設相反,如果價格從當前水平下跌並跌破 527 美元,則表明每次反彈都被拋售。隨後,BNB/USDT 貨幣對可能會跌至 20 日均線(485 美元)。
Solana price analysis
Solana 價格分析
Solana (SOL) has been in a strong uptrend for the past few days, indicating solid demand at higher levels.
Solana (SOL) 在過去幾天一直處於強勁的上升趨勢,顯示較高水準的需求強勁。
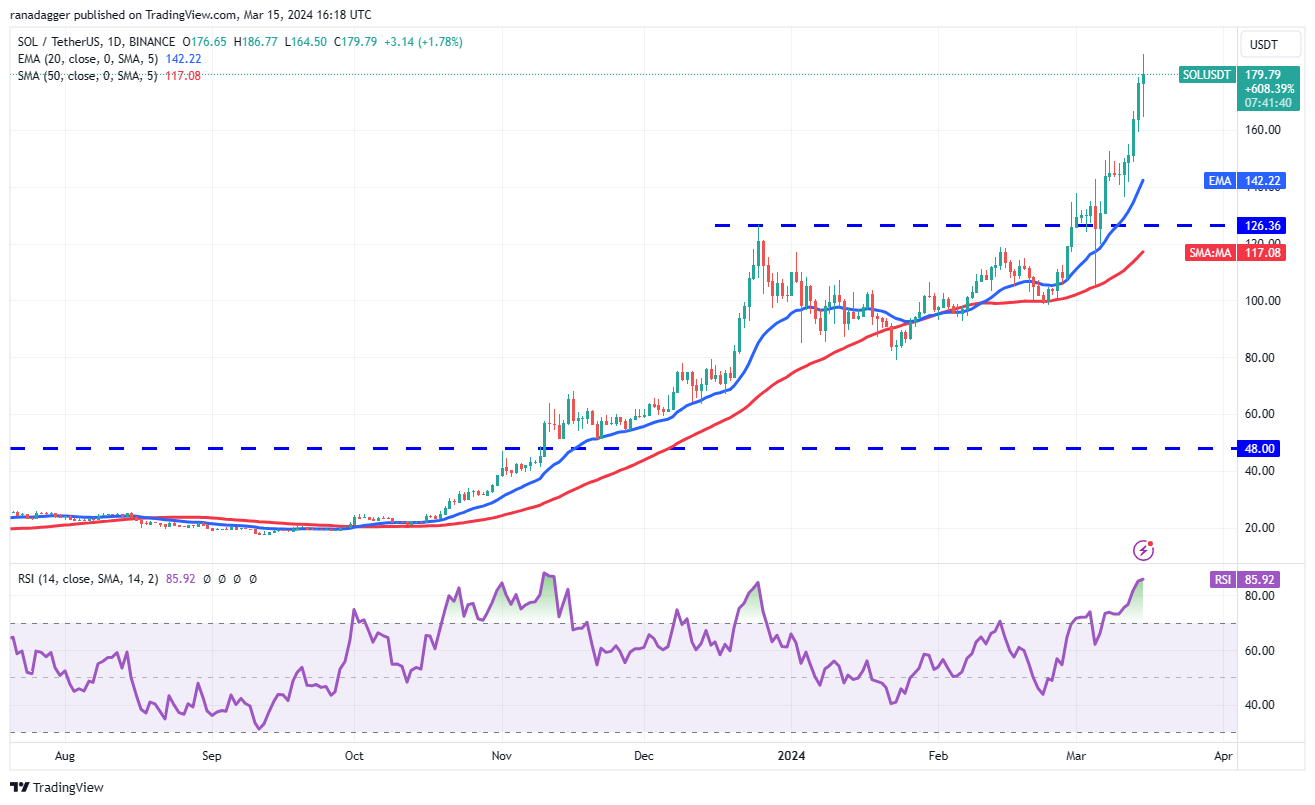
The up move has pushed the RSI deep into the overbought territory, suggesting that the SOL/USDT pair may have run up too fast in a short time. That could start a correction, which could pull the pair to the 20-day EMA ($142).
此次上漲已將 RSI 推入超買區域,顯示 SOL/USDT 貨幣對可能在短時間內上漲太快。這可能會開始修正,從而將該貨幣對拉至 20 日均線(142 美元)。
If the price rebounds off the 20-day EMA, it will suggest that the sentiment remains positive and traders are buying on dips. That may enhance the prospects of a rally to $205. This optimistic view will be negated on a break below the 20-day EMA. The pair may then slump to the breakout level at $126.
如果價格從 20 日均線反彈,則表示市場情緒依然樂觀,交易者逢低買進。這可能會增強其反彈至 205 美元的前景。如果跌破 20 日均線,這種樂觀看法將被否定。隨後該貨幣對可能會跌至 126 美元的突破水平。
XRP price analysis
瑞波幣價格分析
XRP (XRP) turned down from $0.74 on March 12, indicating that the bears are fiercely defending the level.
XRP (XRP) 從 3 月 12 日的 0.74 美元下跌,表明空頭正在激烈捍衛該水平。
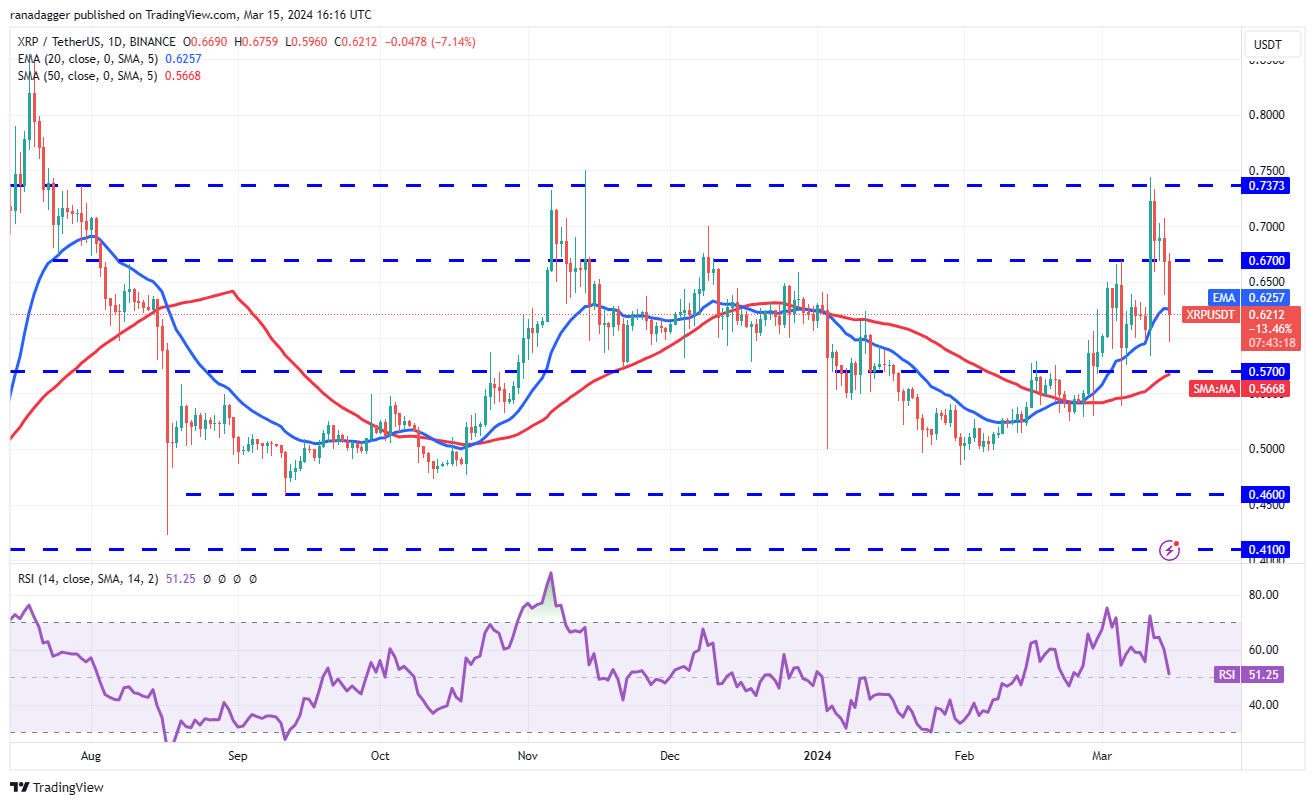
The bulls tried to flip $0.67 into support on March 13, but the bears had other plans. They continued their selling and pulled the price back below the $0.67 level on March 14.
3 月 13 日,多頭試圖將 0.67 美元推向支撐位,但空頭另有計劃。他們繼續拋售,並將價格拉回到 3 月 14 日的 0.67 美元以下。
The selling increased further on March 15, and the XRP/USDT pair broke below the 20-day EMA ($0.62). This suggests that the pair may consolidate inside a large range between $0.50 and $0.74 for some time. A break and close above $0.74 will signal the start of a new uptrend toward $1.02.
3 月 15 日,賣盤進一步增加,XRP/USDT 貨幣對跌破 20 日均線(0.62 美元)。這表明該貨幣對可能會在一段時間內在 0.50 美元至 0.74 美元之間的大範圍內盤整。突破並收盤於 0.74 美元之上將標誌著新的上漲趨勢開始向 1.02 美元邁進。
Cardano price analysis
卡爾達諾價格分析
The bulls tried to kick Cardano (ADA) above the overhead resistance of $0.80 on March 14, but the long wick on the candlestick shows selling at higher levels.
3 月 14 日,多頭試圖將卡爾達諾 (ADA) 推升至 0.80 美元的上方阻力位之上,但燭台上的長影線顯示在更高水平上出現拋售。
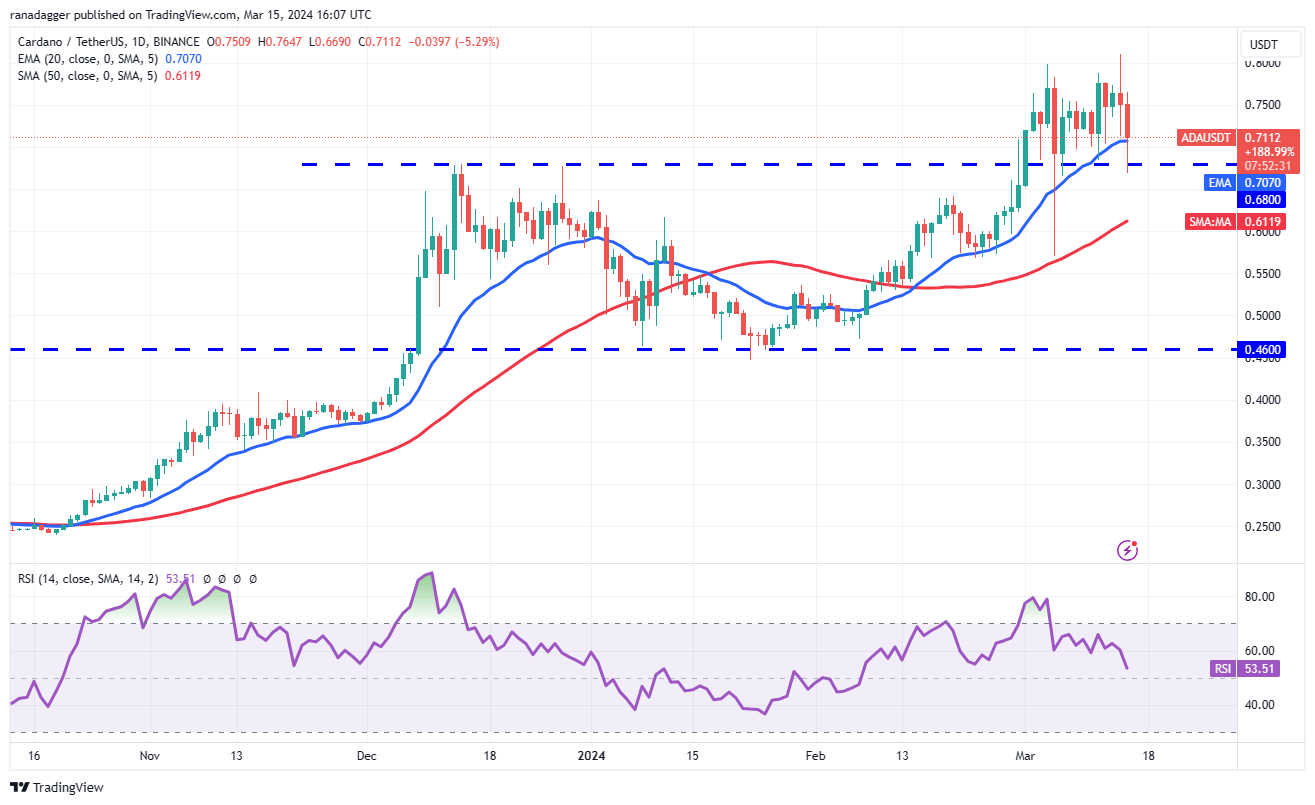
The price turned down sharply, and the price dipped to the breakout level of $0.68 on March 15. If bears sink the price below $0.68, it will signal the start of a deeper correction toward the 50-day SMA ($0.61).
價格急劇下跌,並跌至 3 月 15 日的 0.68 美元突破水平。如果空頭將價格跌破 0.68 美元,則將預示著將開始向 50 日移動平均線(0.61 美元)進行更深層次的修正。
Alternatively, if the price rebounds off $0.68, it will suggest that the bulls continue to buy near strong support levels. The ADA/USDT pair could then swing between $0.68 and $0.80 for a while. A break above $0.80 could launch the pair to $0.92.
或者,如果價格從 0.68 美元反彈,則表示多頭繼續在強力支撐位附近買入。 ADA/USDT 貨幣對可能會在 0.68 美元至 0.80 美元之間波動一段時間。突破 0.80 美元可能會使該貨幣對上漲至 0.92 美元。
Dogecoin price analysis
狗狗幣價格分析
Dogecoin (DOGE) rose above the $0.18 resistance on March 14, but the long wick on the candlestick shows selling at higher levels.
狗狗幣 (DOGE) 於 3 月 14 日昇至 0.18 美元阻力位上方,但燭台上的長影線顯示在更高水平上出現拋售。
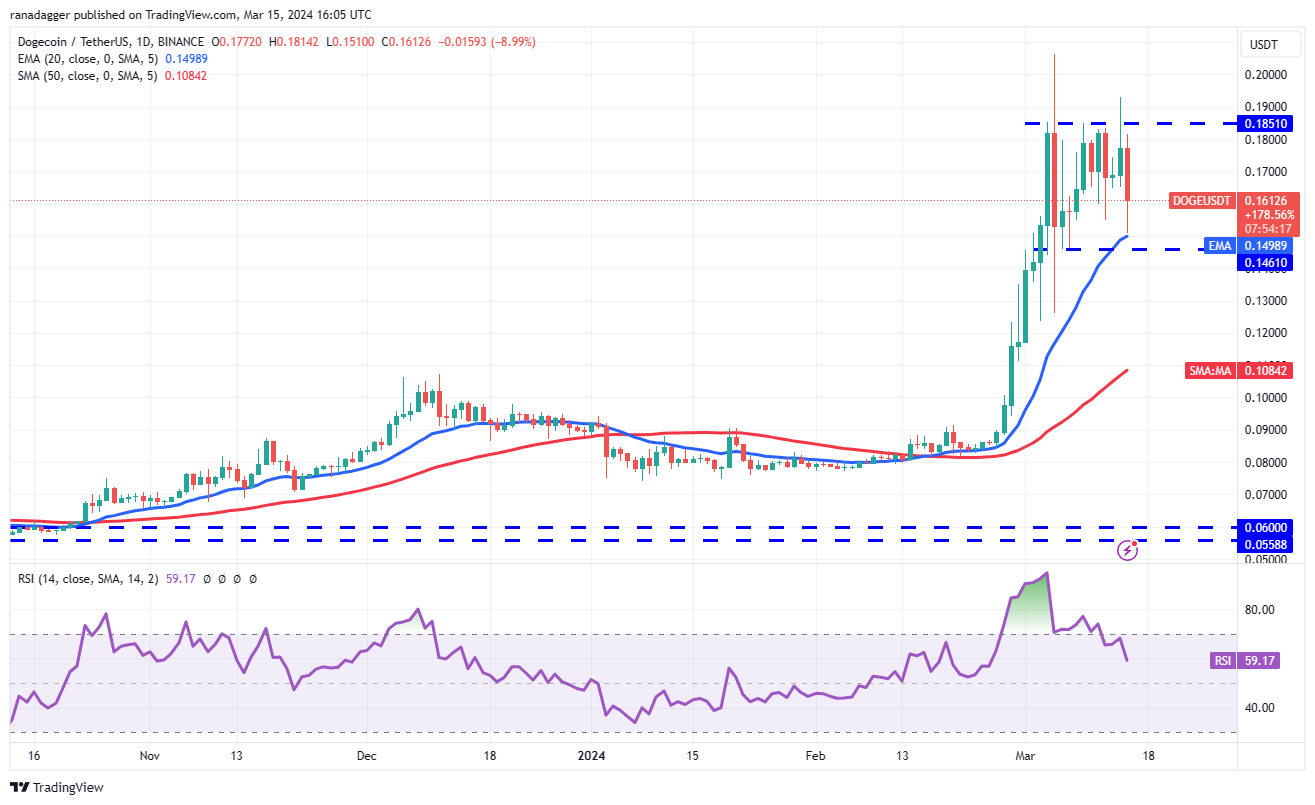
The price turned down sharply and reached the 20-day EMA ($0.15) on March 15. This suggests that the DOGE/USDT pair may remain stuck inside the range for a few more days. A break and close below $0.15 will tilt the advantage in favor of the bears. The pair could then tumble toward $0.12.
價格急劇下跌,並於 3 月 15 日觸及 20 日均線(0.15 美元)。這表明 DOGE/USDT 貨幣對可能會在該區間內停留幾天。突破並收於 0.15 美元下方將使優勢向空頭傾斜。隨後該貨幣對可能會跌向 0.12 美元。
Contrarily, a rally above $0.18 will suggest that the bulls have absorbed the supply. That will open the doors for a rally to $0.24 and then $0.30.
相反,反彈至 0.18 美元以上將表明多頭已經吸收了供應。這將為反彈至 0.24 美元,然後是 0.30 美元打開大門。
Related: Bitcoin overtakes gold in investor portfolio allocation — JPMorgan
相關:比特幣在投資者投資組合配置中超過黃金—摩根大通
Avalanche price analysis
雪崩價格分析
Avalanche (AVAX) witnessed a large range day with a long wick and a long tail on March 14, indicating indecision between the bulls and the bears.
3 月 14 日,Avalanche (AVAX) 出現了一個帶有長影線和長尾巴的大波動日,表明多頭和空頭之間猶豫不決。
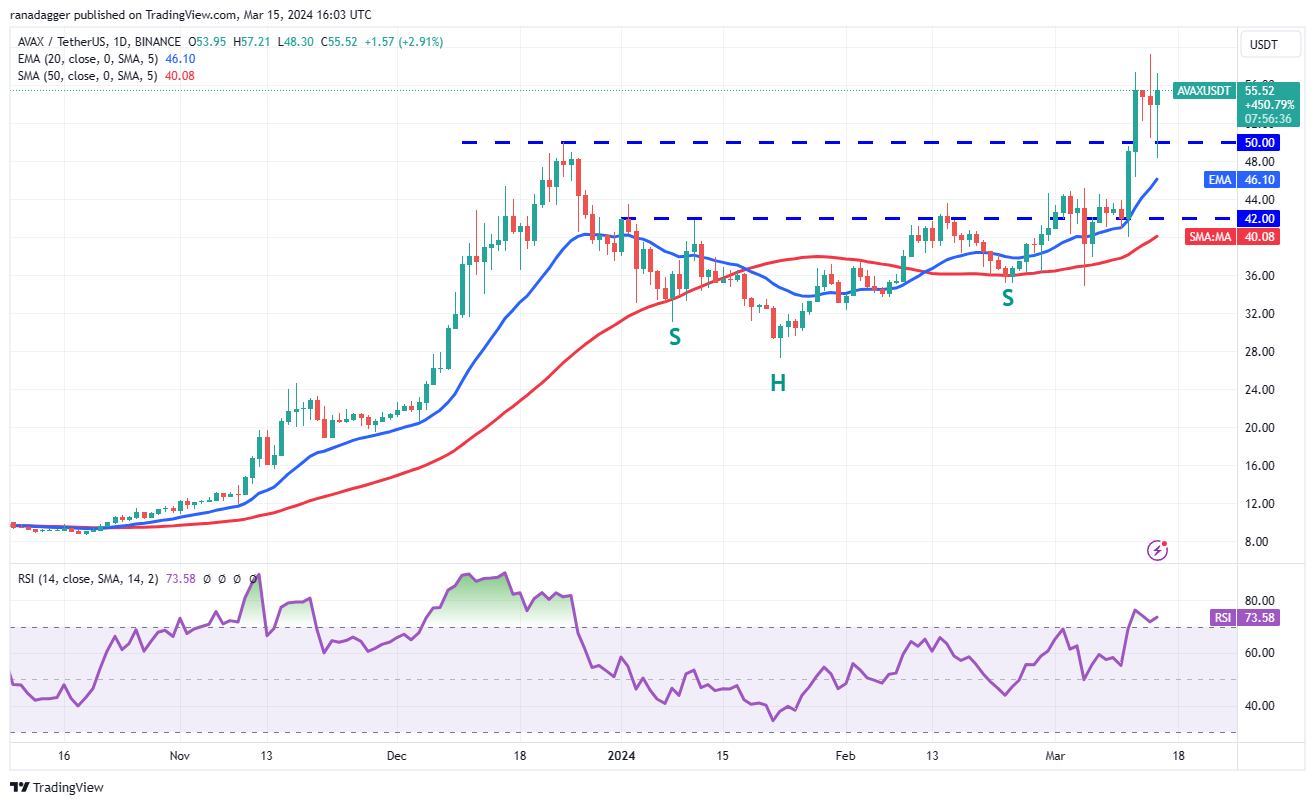
The bears tried to strengthen their position on March 15, but the long tail on the candlestick shows solid buying near the breakout level of $50. This suggests that the bulls are trying to flip $50 into support. If buyers shove the price above $59, the AVAX/USDT pair could resume its uptrend to $87.
3 月 15 日,空頭試圖加強倉位,但燭台上的長尾顯示出在 50 美元突破位附近的強勁買盤。這表明多頭正試圖將 50 美元推向支撐位。如果買家將價格推高至 59 美元以上,AVAX/USDT 貨幣對可能會恢復上漲趨勢至 87 美元。
If bears want to prevent the upside, they will have to maintain the price below the 20-day EMA. That could sink the pair to the 50-day SMA ($40).
如果空頭想要阻止上漲,他們就必須將價格維持在 20 日均線下方。這可能會使該貨幣對跌至 50 日移動平均線(40 美元)。
Shiba Inu price analysis
柴犬價格分析
Shiba Inu (SHIB) tumbled below the $0.000029 support on March 15, indicating that the bears are trying to establish their supremacy.
柴犬 (SHIB) 於 3 月 15 日跌破 0.000029 美元的支撐位,顯示空頭正試圖確立其霸主地位。
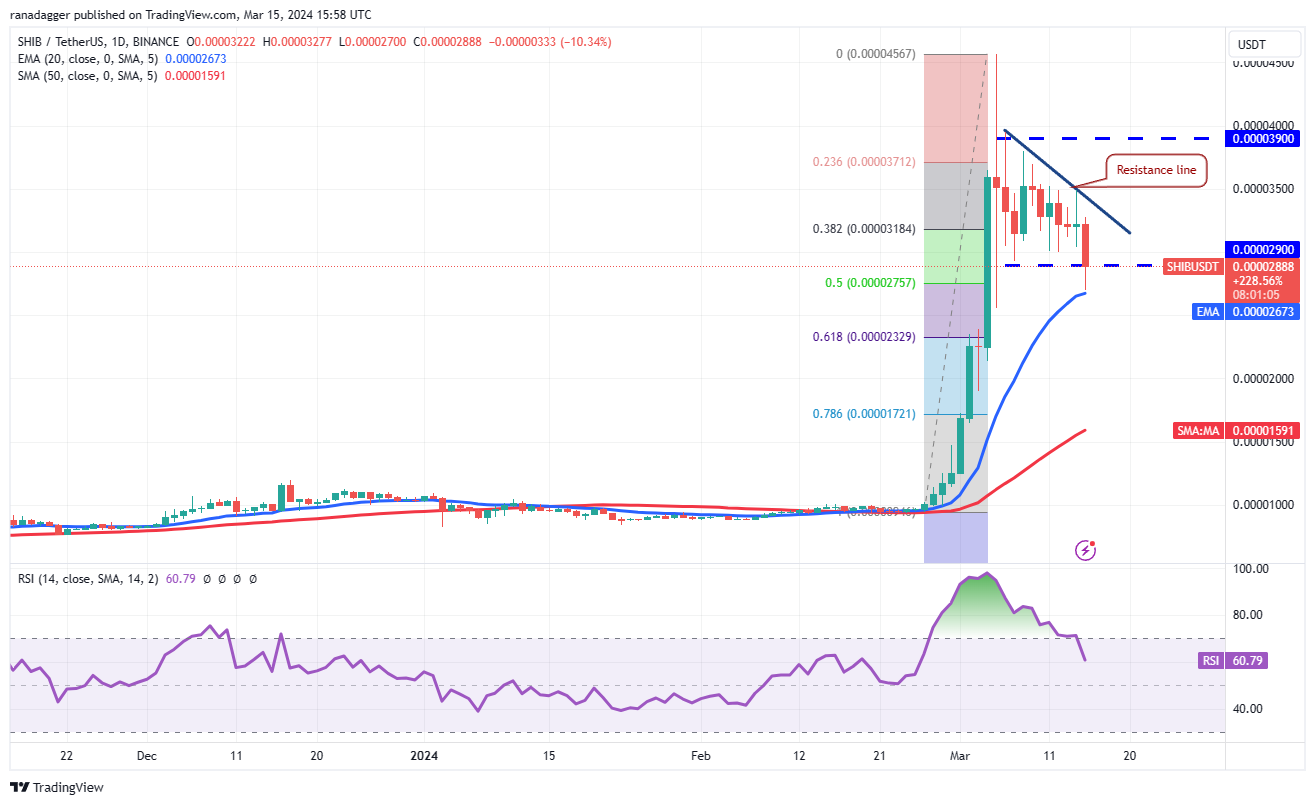
The bulls are trying to defend the 20-day EMA ($0.000027), but the recovery is expected to face selling at the downtrend line. If the price turns lower from the downtrend line, it will increase the likelihood of a slide to the 61.8% Fibonacci retracement level of $0.000023 and then $0.000019.
多頭正試圖捍衛 20 日均線(0.000027 美元),但復甦預計將面臨下行趨勢線的拋售。如果價格從下降趨勢線轉向走低,則會增加滑向 61.8% 斐波那契回檔位 0.000023 美元,然後是 0.000019 美元的可能性。
Conversely, if the price turns up and breaks above the downtrend line, it will suggest that the markets have rejected the lower levels. The SHIB/USDT pair could rally to the overhead resistance of $0.000039.
相反,如果價格上漲並突破下降趨勢線,則表示市場已經拒絕了較低的水平。 SHIB/USDT 貨幣對可能會反彈至上方阻力位 0.000039 美元。
Polkadot price analysis
波卡價格分析
Polkadot (DOT) turned down from $11.88 on March 14, and the selling picked up momentum on March 15.
Polkadot (DOT) 從 3 月 14 日的 11.88 美元開始下跌,3 月 15 日拋售勢頭增強。
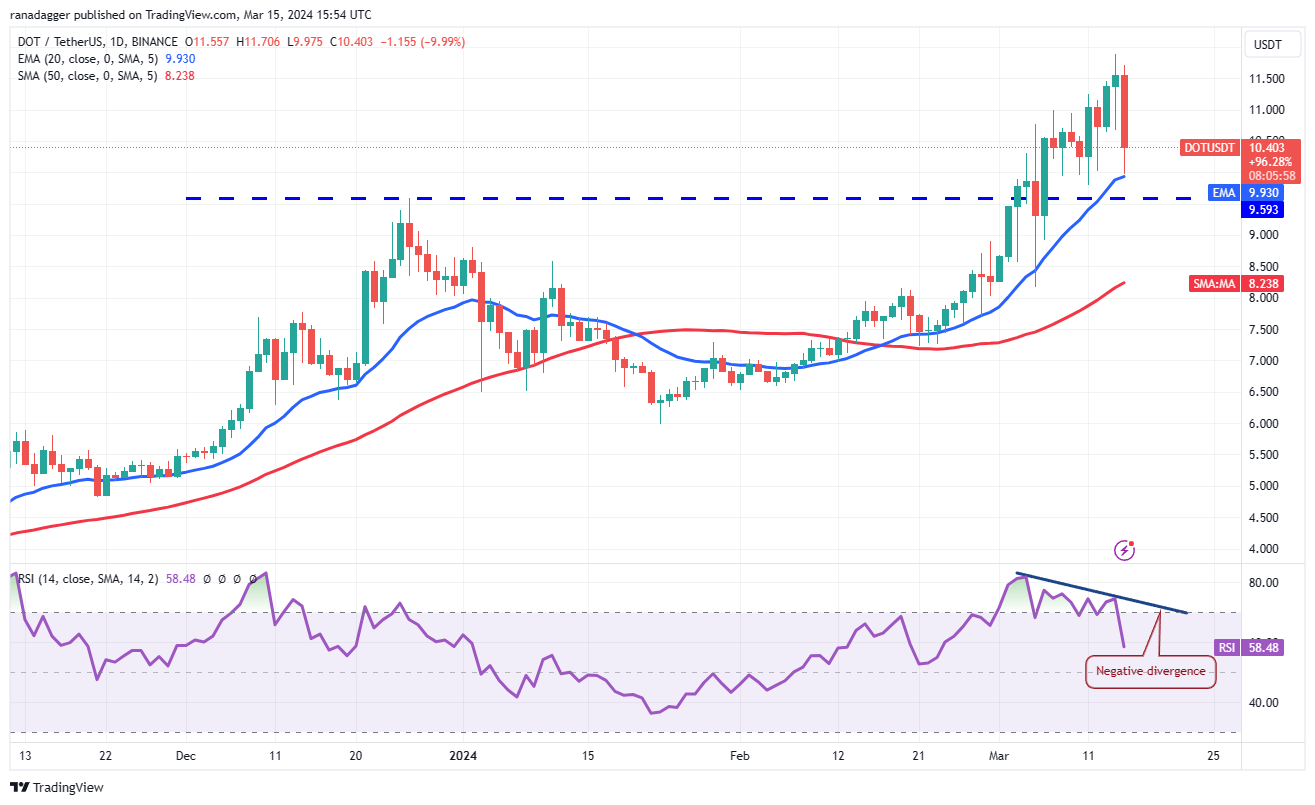
The negative divergence on the RSI suggests that the bullish momentum is waning. That increases the risk of a drop below the 20-day EMA ($9.93) and the breakout level of $9.59. If that happens, the DOT/USDT pair may start a deeper pullback. The pair could then decline to the 50-day SMA ($8.23).
RSI 的負背離顯示看漲勢頭正在減弱。這增加了跌破 20 日均線(9.93 美元)和突破 9.59 美元的風險。如果發生這種情況,DOT/USDT 貨幣對可能會開始更深層的回調。隨後該貨幣對可能會跌至 50 日移動平均線(8.23 美元)。
On the other hand, if the price rebounds off the 20-day EMA with strength, the bulls will again try to push the price to $11.88.
另一方面,如果價格從 20 日均線強勢反彈,多頭將再次嘗試將價格推至 11.88 美元。
This article does not contain investment advice or recommendations. Every investment and trading move involves risk, and readers should conduct their own research when making a decision.
本文不包含投資建議或建議。每一項投資和交易行為都涉及風險,讀者在做決定時應自行研究。
 Crypto Front News
 DogeHome
 Crypto Daily™
 Crypto News Land
 TheNewsCrypto
 CFN
CFN Crypto Daily™
 Crypto Daily™
 Crypto Daily™


