

Bitcoin’s (BTC) sharp rally is showing signs of a short-term pullback, which could be one of the reasons for the mere $132 million in inflows into the spot Bitcoin exchange-traded funds on March 14. A marked slowdown in inflows could start a corrective phase as Bitcoin’s most recent leg of the rally has largely been driven by solid inflows into the Bitcoin ETFs.
비트코인(BTC)의 급격한 반등은 단기 하락 조짐을 보이고 있는데, 이는 3월 14일 현물 비트코인 상장 거래 자금이 1억 3,200만 달러에 불과한 이유 중 하나일 수 있습니다. 유입이 눈에 띄게 둔화되면 비트코인의 가장 최근 랠리 구간인 조정 단계는 주로 비트코인 ETF로의 견고한 유입에 의해 주도되었습니다.
If a correction starts in Bitcoin, how deep could that be? During previous halving cycles, Bitcoin has seen a drop close to 40%, according to a X (formerly Twitter) post by the pseudonymous trader known as Bags. If history were to repeat, then Bitcoin could plummet to about $45,500.
비트코인에서 조정이 시작된다면 그 깊이는 얼마나 될까요? Bags로 알려진 익명 거래자의 X(이전 트위터) 게시물에 따르면 이전 반감기 주기 동안 비트코인은 40% 가까이 하락했습니다. 역사가 반복된다면 비트코인은 약 45,500달러까지 급락할 수 있습니다.
Corrections are a part of every bull market. A positive sign during the current pullback is that it is largely due to profit-booking on hedges and has not led to “panic shorting yet,” according to popular trader Skew.
조정은 모든 상승장의 일부입니다. 인기 트레이더인 Skew에 따르면 현재 하락세 중 긍정적인 신호는 주로 헤지 이익 장부에 따른 것이며 아직 '패닉 매도'로 이어지지 않았다는 것입니다.
Could the correction in Bitcoin and altcoins deepen, or will the price rebound from the current levels? Let’s analyze the charts of the top 10 cryptocurrencies to find out.
비트코인과 알트코인의 조정이 심화될 수 있을까요, 아니면 가격이 현재 수준에서 반등할까요? 알아보기 위해 상위 10개 암호화폐의 차트를 분석해 보겠습니다.
Bitcoin price analysis
비트코인 가격 분석
Bitcoin witnessed profit booking at $73,777 on March 14, but the bulls purchased the dip, as seen from the long tail on the candlestick.
비트코인은 3월 14일 73,777달러에 이익을 기록했지만 상승세는 촛대의 긴 꼬리에서 볼 수 있듯이 딥을 매수했습니다.
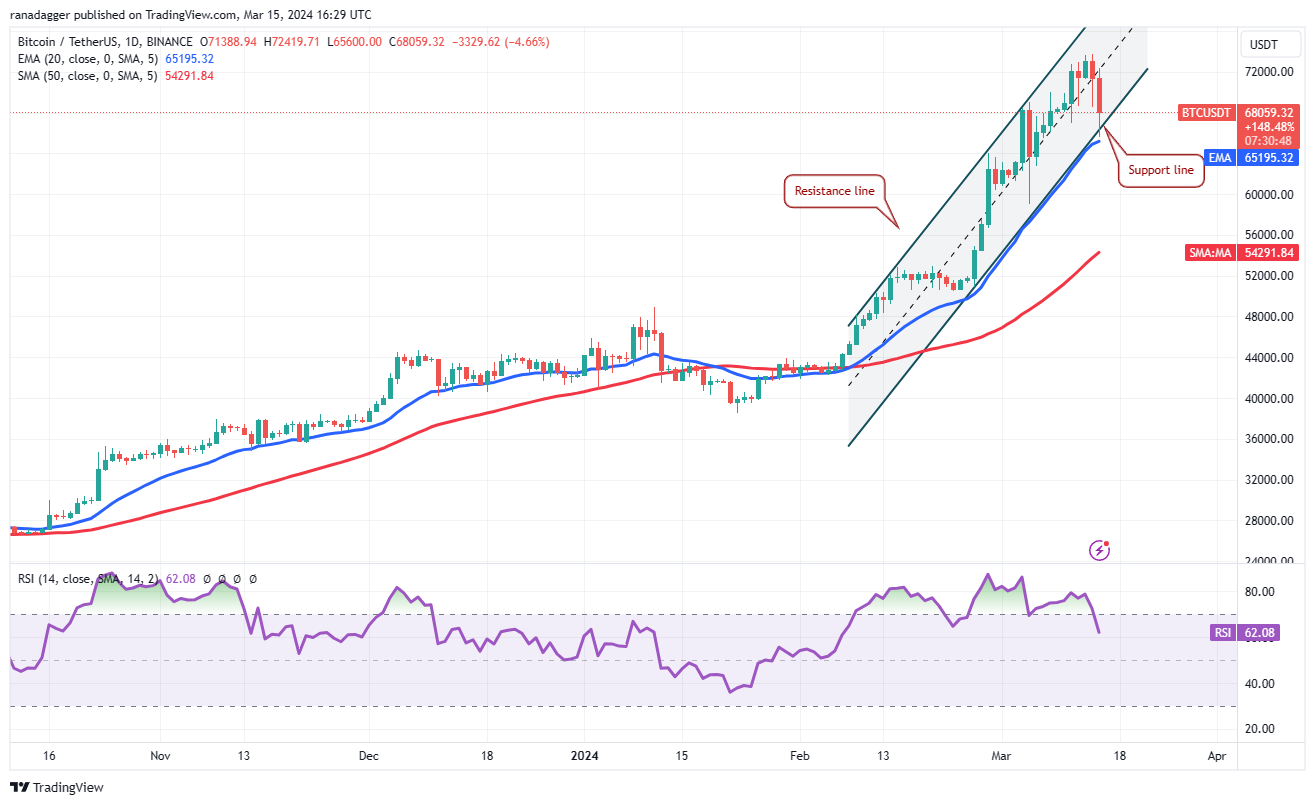
However, the failure to build upon the momentum on March 15 attracted strong selling by the short-term traders. The price has reached the support line of the ascending channel pattern, which is an important level to watch out for.
그러나 3월 15일 모멘텀을 구축하지 못하면서 단기 거래자들의 강력한 매도가 이루어졌습니다. 가격이 상승 채널 패턴의 지지선에 도달했는데, 이는 주목해야 할 중요한 수준입니다.
If the price plummets below the channel and the 20-day exponential moving average ($65,195), it will indicate the start of a corrective phase. The BTC/USDT pair could slide to $59,000 and thereafter to the 50-day simple moving average ($54,291).
가격이 채널 및 20일 지수 이동 평균(65,195달러) 아래로 급락하면 조정 단계가 시작된다는 의미입니다. BTC/USDT 쌍은 $59,000까지 하락한 후 50일 단순 이동 평균($54,291)까지 하락할 수 있습니다.
Contrarily, if the price bounces off the support line, it will suggest that the pair may remain inside the channel for some more time. The bulls will again try to push the price above the overhead resistance at $73,777.
반대로, 가격이 지지선을 벗어나면 해당 쌍이 한동안 채널 내부에 머물 수 있음을 시사합니다. 강세론자들은 다시 가격을 머리 위 저항선인 $73,777 위로 끌어올리려고 시도할 것입니다.
Ether price analysis
이더 가격 분석
Ether’s (ETH) up move stalled near $4,000, tempting short-term traders to book profits. The long tail on the March 14 candlestick shows the bulls tried to flip the $3,600 level into support, but the fall on March 15 shows that the bears have kept up the pressure.
이더리움(ETH)의 상승 움직임은 4,000달러 근처에서 정체되어 단기 거래자들이 이익을 기록하도록 유혹했습니다. 3월 14일 캔들스틱의 긴 꼬리는 상승세가 3,600달러 수준을 지지로 바꾸려고 시도했음을 보여 주지만, 3월 15일 하락은 하락세가 압력을 계속 유지했음을 보여줍니다.
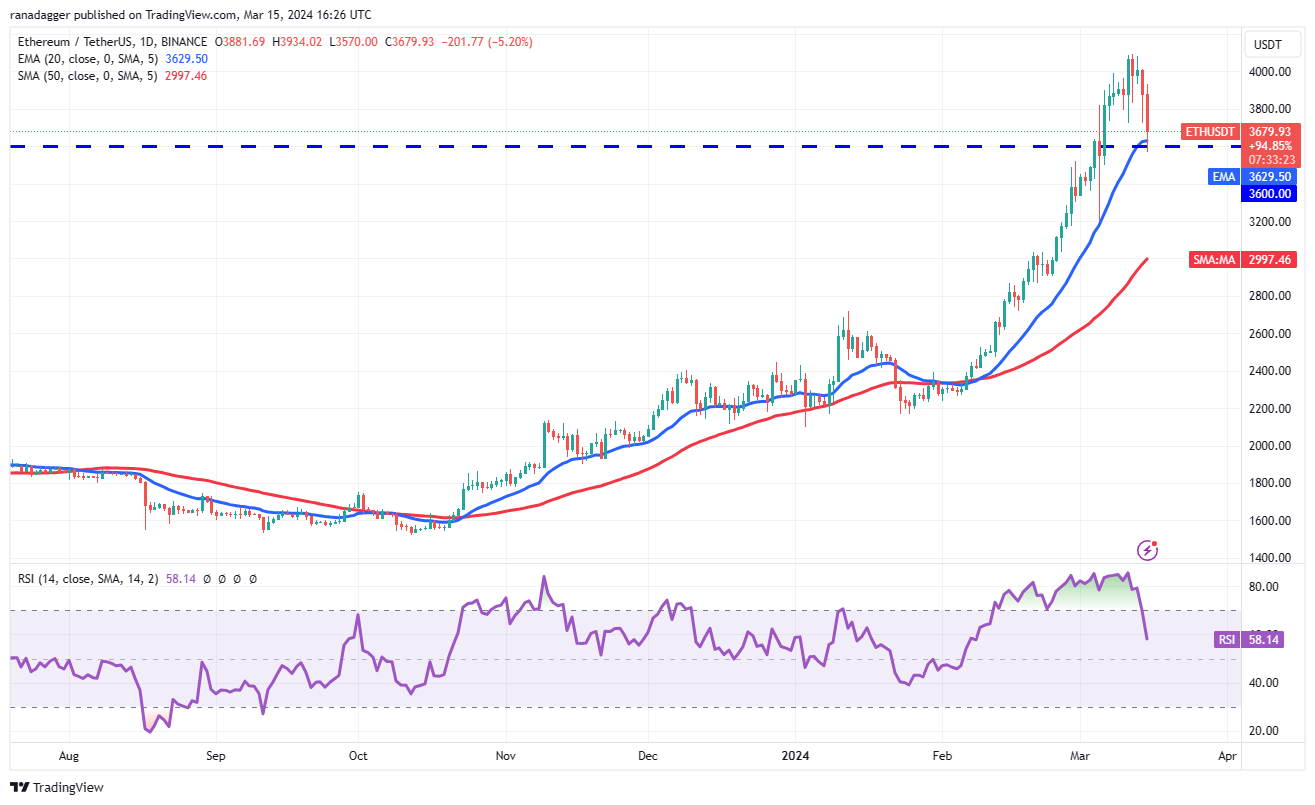
The bulls and the bears are likely to witness a tough battle near $3,600. If the price rebounds off this support, the bulls will again try to push the ETH/USDT pair to $4,000. The bears are expected to vigorously defend this level.
황소와 곰은 $3,600 근처에서 힘든 싸움을 목격할 가능성이 높습니다. 가격이 이 지지선에서 반등하면 상승세는 다시 ETH/USDT 쌍을 4,000달러로 끌어올리려고 시도할 것입니다. 곰들은 이 수준을 강력하게 방어할 것으로 예상된다.
On the downside, the bears will try to yank the price below $3,600. If they do that, the selling could accelerate, and the ETH/USDT pair could slump to $3,200 and later to the 50-day SMA ($2,997). The greater the fall, the longer it will take for the pair to resume the uptrend.
단점이라면 하락세는 가격을 $3,600 아래로 낮추려고 노력할 것입니다. 그렇게 하면 매도가 가속화될 수 있고 ETH/USDT 쌍은 $3,200까지 하락하고 나중에는 50일 SMA($2,997)까지 하락할 수 있습니다. 하락 폭이 클수록 쌍이 상승 추세를 재개하는 데 시간이 더 오래 걸립니다.
BNB price analysis
BNB 가격 분석
BNB (BNB) has pulled back in a strong uptrend, indicating that the traders are booking profits after a sharp rally.
BNB(BNB)가 강한 상승세로 후퇴해 거래자들이 급격한 반등 이후 이익을 기록하고 있음을 나타냅니다.
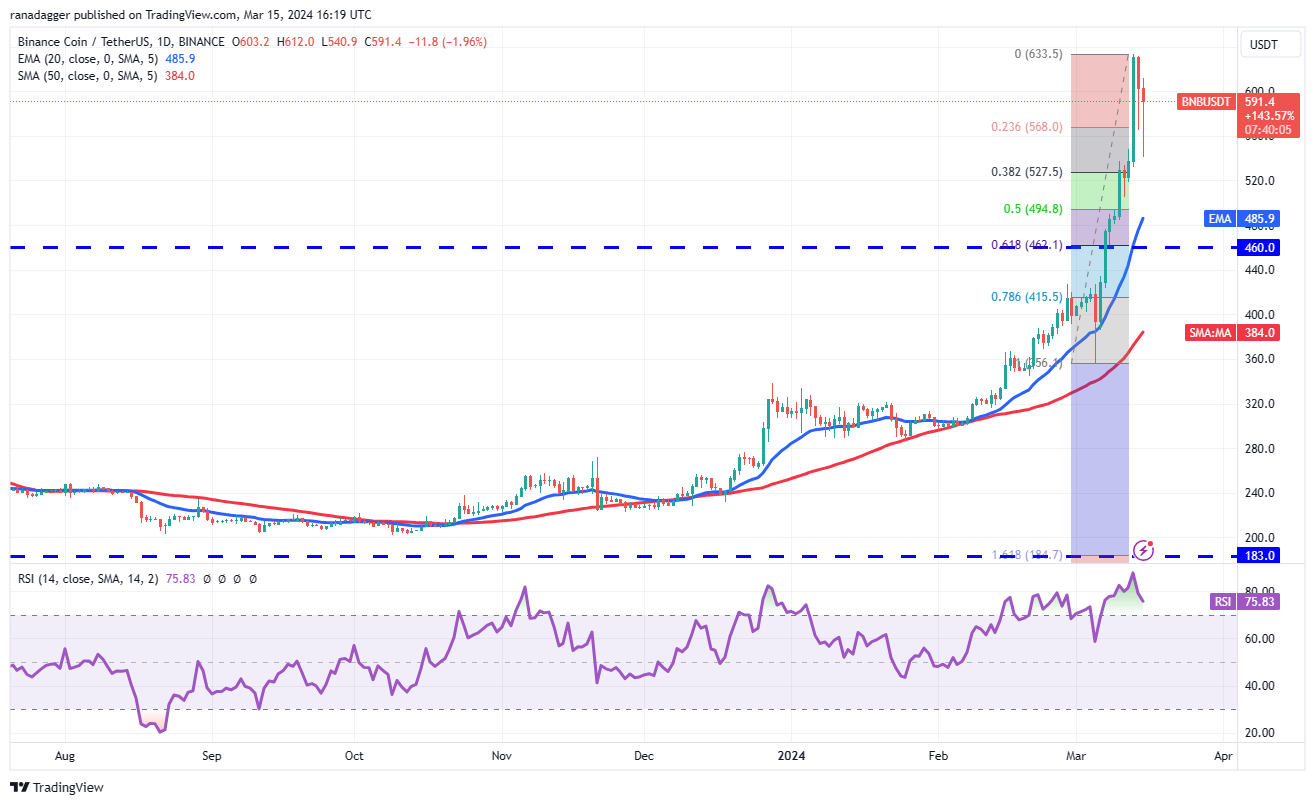
However, the long tail on the March 15 candlestick shows that the bulls are not ready to give up and are buying at the 38.2% Fibonacci retracement level of $527.50.
그러나 3월 15일 캔들스틱의 긴 꼬리는 상승세가 포기할 준비가 되지 않았으며 38.2% 피보나치 되돌림 수준인 $527.50에서 매수하고 있음을 보여줍니다.
A shallow pullback is a positive sign as it shows the bulls are not waiting for a deeper correction to enter. That increases the possibility of a break above $633. The pair may then climb to the $670 to $692 resistance zone.
얕은 하락은 상승세가 더 깊은 조정을 기다리지 않는다는 것을 보여주기 때문에 긍정적인 신호입니다. 이는 $633 이상의 휴식 가능성을 증가시킵니다. 그러면 통화쌍은 $670~$692 저항대까지 오를 수 있습니다.
Contrary to this assumption, if the price turns down from the current level and breaks below $527, it will signal that every rally is being sold into. The BNB/USDT pair may then tumble to the 20-day EMA ($485).
이 가정과 반대로 가격이 현재 수준에서 하락하여 527달러 아래로 떨어지면 모든 랠리가 매도되고 있다는 신호가 됩니다. BNB/USDT 쌍은 20일 EMA($485)로 하락할 수 있습니다.
Solana price analysis
솔라나 가격 분석
Solana (SOL) has been in a strong uptrend for the past few days, indicating solid demand at higher levels.
솔라나(SOL)는 지난 며칠 동안 강한 상승세를 보였으며 이는 더 높은 수준의 탄탄한 수요를 나타냅니다.
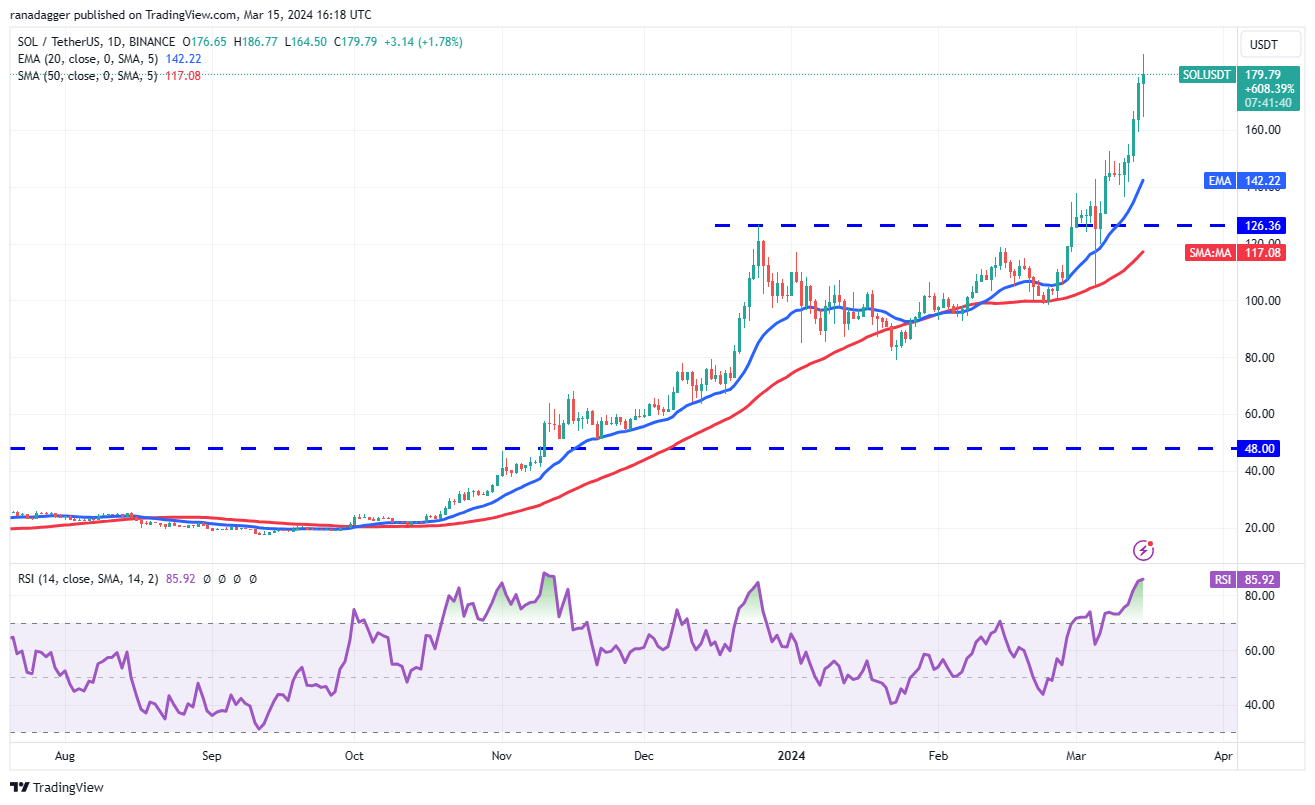
The up move has pushed the RSI deep into the overbought territory, suggesting that the SOL/USDT pair may have run up too fast in a short time. That could start a correction, which could pull the pair to the 20-day EMA ($142).
상승 움직임으로 인해 RSI가 과매수 영역 깊숙이 들어가게 되었으며, 이는 SOL/USDT 쌍이 단기간에 너무 빠르게 상승했을 수 있음을 시사합니다. 이는 조정을 시작하여 20일 EMA($142)까지 끌어올 수 있습니다.
If the price rebounds off the 20-day EMA, it will suggest that the sentiment remains positive and traders are buying on dips. That may enhance the prospects of a rally to $205. This optimistic view will be negated on a break below the 20-day EMA. The pair may then slump to the breakout level at $126.
가격이 20일 EMA에서 반등한다면 정서가 여전히 긍정적이고 거래자들이 하락세에 매수하고 있음을 의미합니다. 이는 랠리 전망을 205달러까지 높일 수 있습니다. 이러한 낙관적인 견해는 20일 EMA 아래로 떨어지면 무효화됩니다. 그러면 통화쌍은 $126 돌파 수준까지 하락할 수 있습니다.
XRP price analysis
XRP 가격 분석
XRP (XRP) turned down from $0.74 on March 12, indicating that the bears are fiercely defending the level.
XRP(XRP)는 3월 12일 0.74달러에서 하락했는데, 이는 하락세가 치열하게 수준을 방어하고 있음을 나타냅니다.
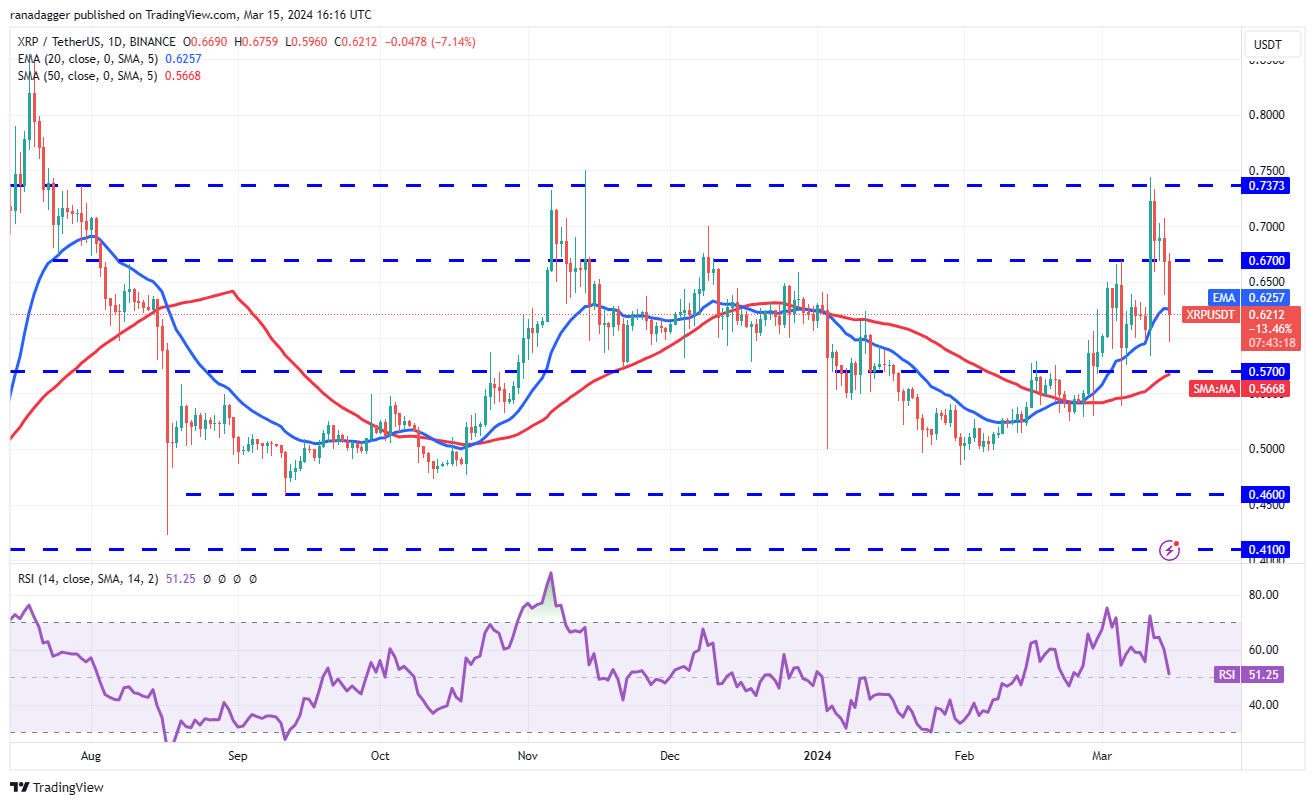
The bulls tried to flip $0.67 into support on March 13, but the bears had other plans. They continued their selling and pulled the price back below the $0.67 level on March 14.
상승세는 3월 13일에 0.67달러를 지지선으로 전환하려고 시도했지만 하락세는 다른 계획을 가지고 있었습니다. 그들은 매도를 계속했고 3월 14일에 가격을 0.67달러 아래로 되돌렸습니다.
The selling increased further on March 15, and the XRP/USDT pair broke below the 20-day EMA ($0.62). This suggests that the pair may consolidate inside a large range between $0.50 and $0.74 for some time. A break and close above $0.74 will signal the start of a new uptrend toward $1.02.
3월 15일에 매도가 더욱 증가했으며 XRP/USDT 쌍은 20일 EMA($0.62) 아래로 떨어졌습니다. 이는 해당 쌍이 한동안 $0.50에서 $0.74 사이의 큰 범위 내에서 통합될 수 있음을 의미합니다. $0.74를 넘어서는 종가는 $1.02를 향한 새로운 상승 추세의 시작을 의미합니다.
Cardano price analysis
카르다노 가격 분석
The bulls tried to kick Cardano (ADA) above the overhead resistance of $0.80 on March 14, but the long wick on the candlestick shows selling at higher levels.
상승세는 3월 14일에 Cardano(ADA)를 오버헤드 저항인 $0.80 위로 밀어내려고 시도했지만, 캔들스틱의 긴 심지는 더 높은 수준에서 매도하고 있음을 보여줍니다.
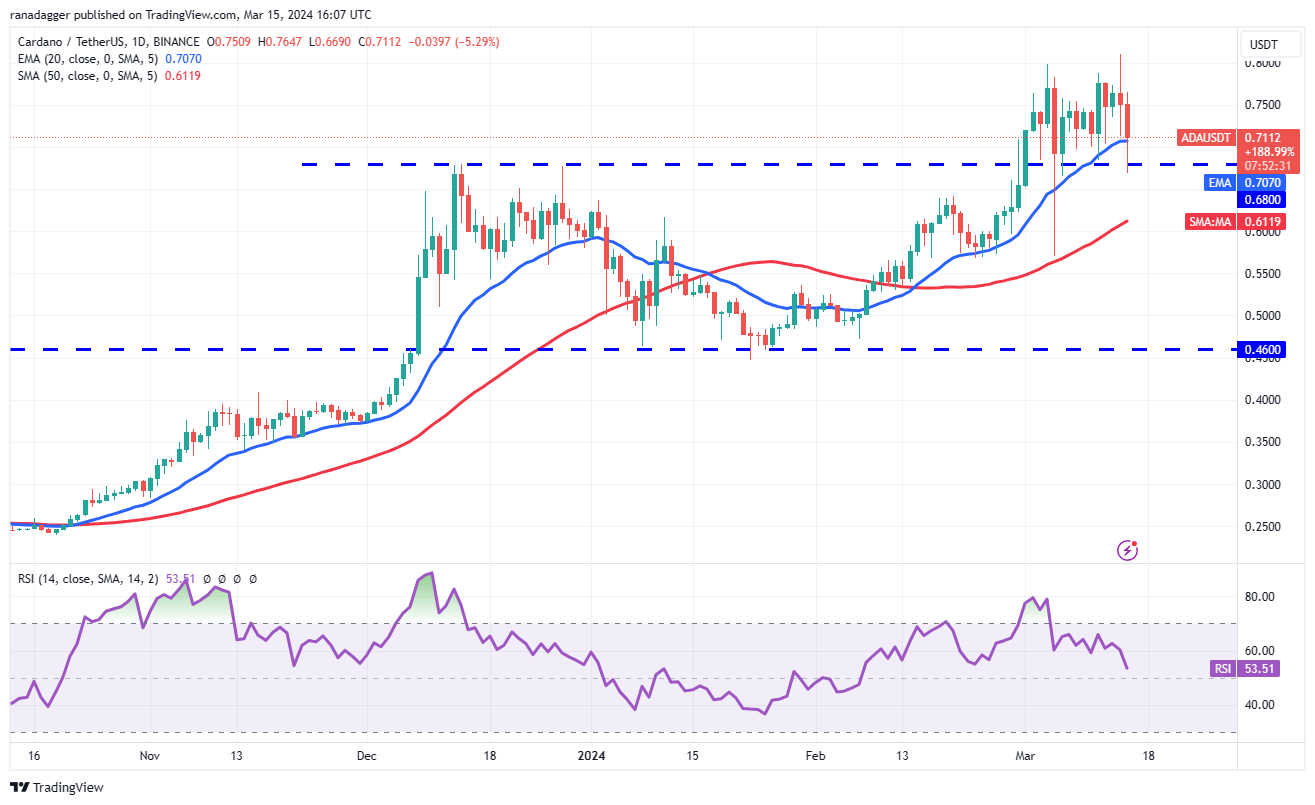
The price turned down sharply, and the price dipped to the breakout level of $0.68 on March 15. If bears sink the price below $0.68, it will signal the start of a deeper correction toward the 50-day SMA ($0.61).
가격은 급격히 하락했고 3월 15일 $0.68 돌파 수준까지 떨어졌습니다. 하락세가 $0.68 아래로 떨어지면 50일 SMA($0.61)를 향한 더 깊은 조정이 시작된다는 신호가 됩니다.
Alternatively, if the price rebounds off $0.68, it will suggest that the bulls continue to buy near strong support levels. The ADA/USDT pair could then swing between $0.68 and $0.80 for a while. A break above $0.80 could launch the pair to $0.92.
또는 가격이 0.68달러에서 반등하면 황소가 강력한 지지 수준 근처에서 계속 매수한다는 의미입니다. 그러면 ADA/USDT 쌍은 한동안 $0.68에서 $0.80 사이에서 변동할 수 있습니다. $0.80를 넘어서면 가격은 $0.92로 상승할 수 있습니다.
Dogecoin price analysis
도지코인 가격 분석
Dogecoin (DOGE) rose above the $0.18 resistance on March 14, but the long wick on the candlestick shows selling at higher levels.
Dogecoin(DOGE)은 3월 14일에 0.18달러 저항선을 넘어섰지만, 캔들스틱의 긴 심지는 더 높은 수준에서 판매되고 있음을 나타냅니다.
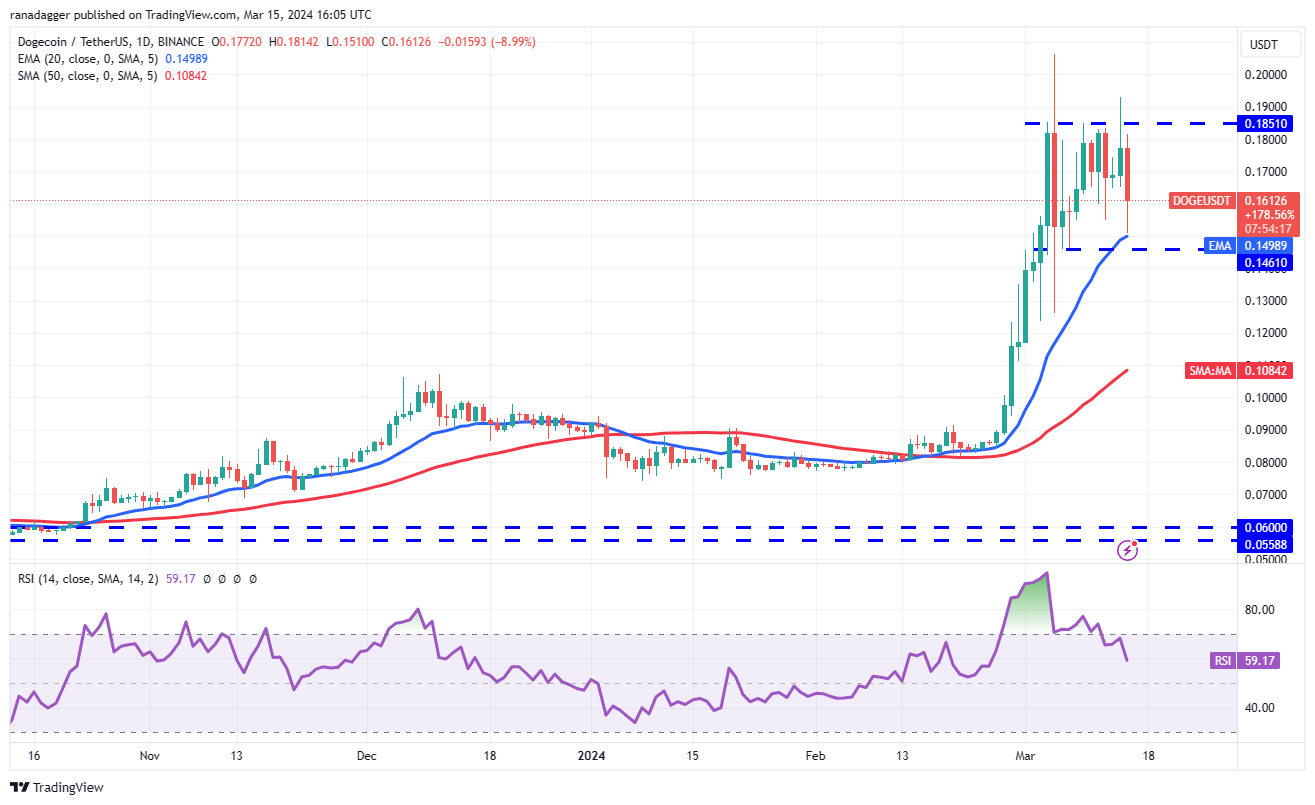
The price turned down sharply and reached the 20-day EMA ($0.15) on March 15. This suggests that the DOGE/USDT pair may remain stuck inside the range for a few more days. A break and close below $0.15 will tilt the advantage in favor of the bears. The pair could then tumble toward $0.12.
가격은 급격히 하락하여 3월 15일 20일 EMA($0.15)에 도달했습니다. 이는 DOGE/USDT 쌍이 며칠 더 범위 내에 머물 수 있음을 의미합니다. $0.15 미만의 중단 및 마감은 약세에게 유리하게 유리하게 기울어질 것입니다. 그러면 통화쌍은 0.12달러 방향으로 하락할 수 있습니다.
Contrarily, a rally above $0.18 will suggest that the bulls have absorbed the supply. That will open the doors for a rally to $0.24 and then $0.30.
반대로 0.18달러 이상의 랠리는 상승세가 공급량을 흡수했음을 의미합니다. 그러면 $0.24, $0.30까지 상승할 수 있는 문이 열릴 것입니다.
Related: Bitcoin overtakes gold in investor portfolio allocation — JPMorgan
관련: 비트코인이 투자자 포트폴리오 배분에서 금을 추월합니다 — JPMorgan
Avalanche price analysis
눈사태 가격 분석
Avalanche (AVAX) witnessed a large range day with a long wick and a long tail on March 14, indicating indecision between the bulls and the bears.
Avalanche(AVAX)는 3월 14일에 긴 심지와 긴 꼬리가 있는 넓은 범위의 날을 목격했는데, 이는 황소와 곰 사이의 우유부단함을 나타냅니다.
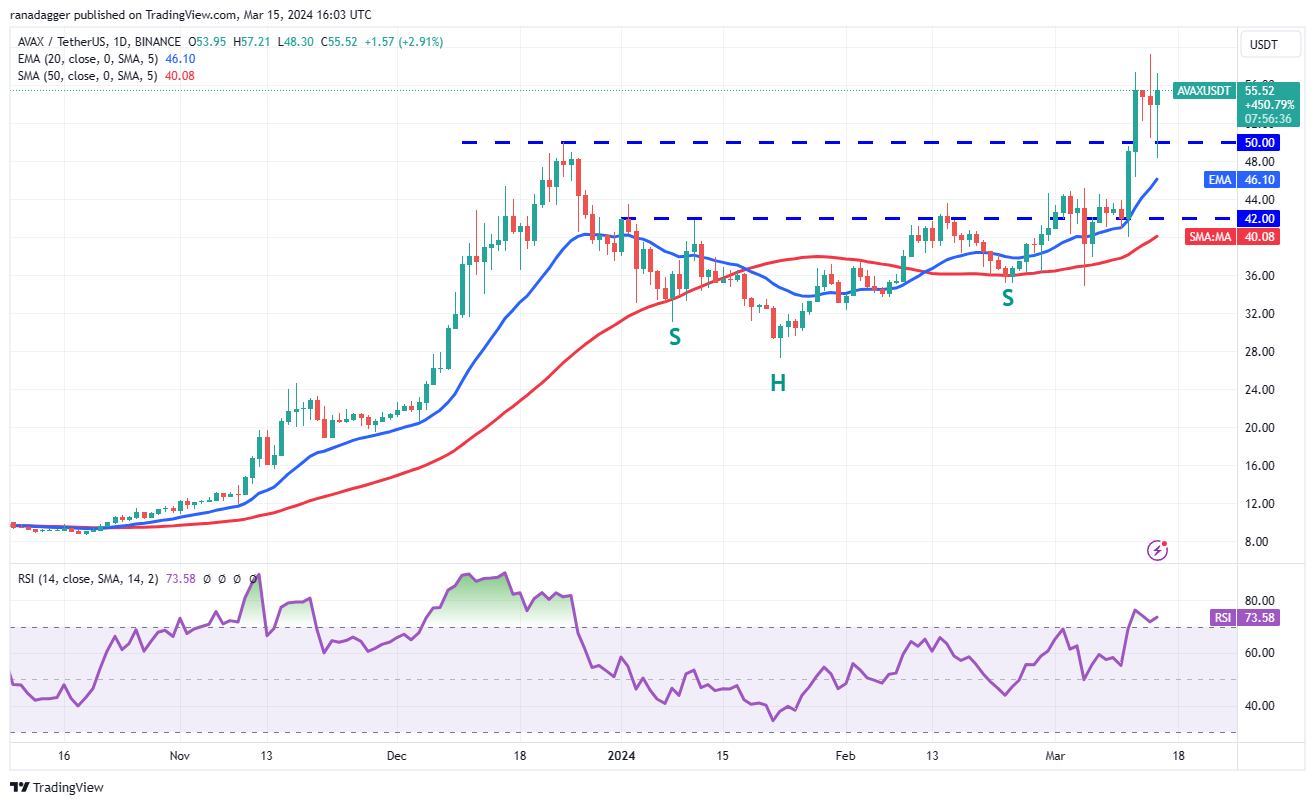
The bears tried to strengthen their position on March 15, but the long tail on the candlestick shows solid buying near the breakout level of $50. This suggests that the bulls are trying to flip $50 into support. If buyers shove the price above $59, the AVAX/USDT pair could resume its uptrend to $87.
하락세는 3월 15일에 포지션을 강화하려고 시도했지만 캔들스틱의 긴 꼬리는 $50 돌파 수준 근처에서 견고한 매수를 보여줍니다. 이는 상승세가 50달러를 지지로 바꾸려고 노력하고 있음을 의미합니다. 구매자가 가격을 59달러 이상으로 올리면 AVAX/USDT 쌍은 87달러까지 상승 추세를 재개할 수 있습니다.
If bears want to prevent the upside, they will have to maintain the price below the 20-day EMA. That could sink the pair to the 50-day SMA ($40).
하락세가 상승을 막고 싶다면 가격을 20일 EMA 아래로 유지해야 합니다. 이는 50일 SMA($40)로 하락할 수 있습니다.
Shiba Inu price analysis
시바견 가격 분석
Shiba Inu (SHIB) tumbled below the $0.000029 support on March 15, indicating that the bears are trying to establish their supremacy.
Shiba Inu (SHIB)는 3월 15일 $0.000029 지지선 아래로 떨어졌으며 이는 곰들이 패권을 확립하려고 노력하고 있음을 나타냅니다.
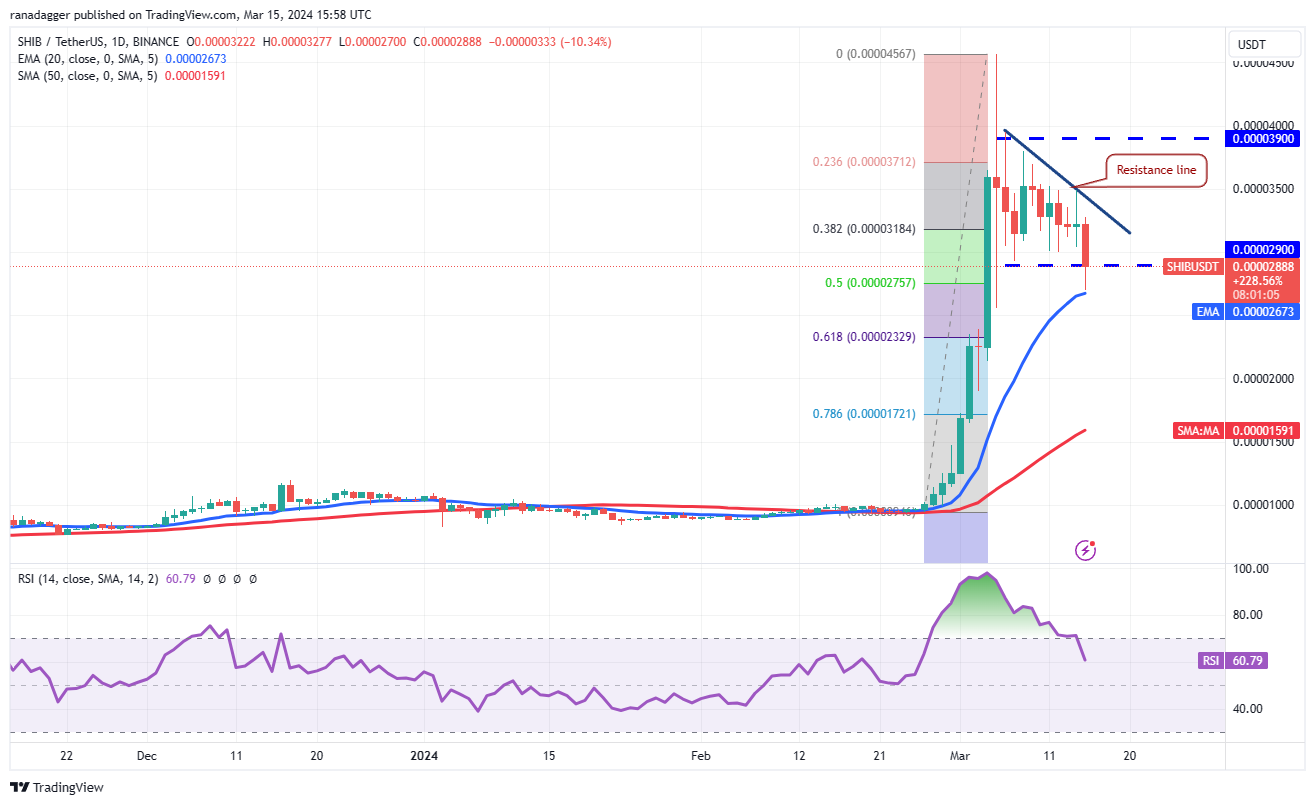
The bulls are trying to defend the 20-day EMA ($0.000027), but the recovery is expected to face selling at the downtrend line. If the price turns lower from the downtrend line, it will increase the likelihood of a slide to the 61.8% Fibonacci retracement level of $0.000023 and then $0.000019.
강세론자들은 20일 EMA($0.000027)를 방어하려고 노력하고 있지만 회복세는 하락 추세선에서 매도에 직면할 것으로 예상됩니다. 가격이 하락 추세선에서 낮아지면 61.8% 피보나치 되돌림 수준인 $0.000023, 그 다음에는 $0.000019까지 하락할 가능성이 높아집니다.
Conversely, if the price turns up and breaks above the downtrend line, it will suggest that the markets have rejected the lower levels. The SHIB/USDT pair could rally to the overhead resistance of $0.000039.
반대로, 가격이 상승하여 하락 추세선을 돌파한다면 이는 시장이 더 낮은 수준을 거부했음을 의미합니다. SHIB/USDT 쌍은 $0.000039의 오버헤드 저항까지 상승할 수 있습니다.
Polkadot price analysis
폴카닷 가격 분석
Polkadot (DOT) turned down from $11.88 on March 14, and the selling picked up momentum on March 15.
Polkadot(DOT)은 3월 14일 $11.88에서 하락세를 보였으며, 3월 15일에 매도세가 탄력을 받았습니다.
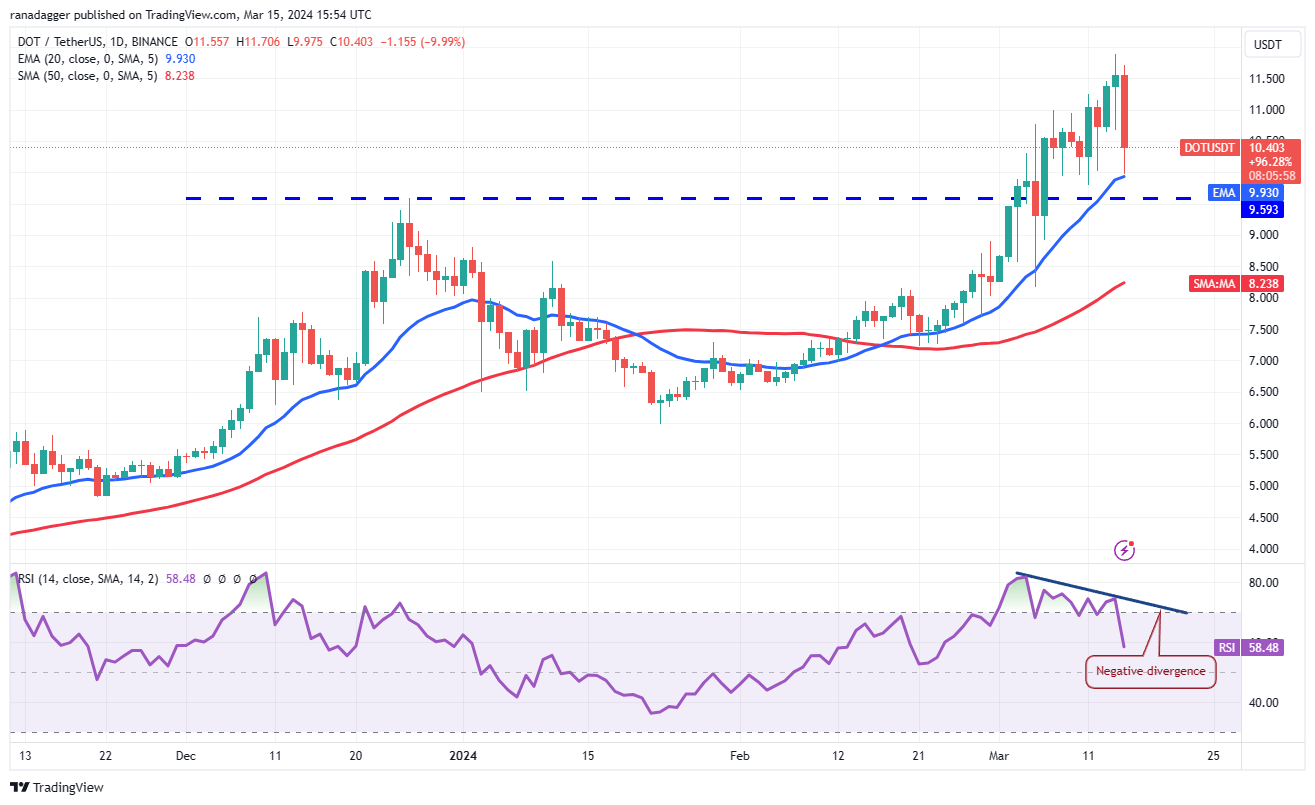
The negative divergence on the RSI suggests that the bullish momentum is waning. That increases the risk of a drop below the 20-day EMA ($9.93) and the breakout level of $9.59. If that happens, the DOT/USDT pair may start a deeper pullback. The pair could then decline to the 50-day SMA ($8.23).
RSI의 부정적인 다이버전스는 강세 모멘텀이 약화되고 있음을 나타냅니다. 이는 20일 EMA(9.93달러)와 돌파 수준인 9.59달러 아래로 하락할 위험을 증가시킵니다. 그런 일이 발생하면 DOT/USDT 쌍이 더 깊은 하락세를 시작할 수 있습니다. 그러면 해당 쌍은 50일 SMA($8.23)로 하락할 수 있습니다.
On the other hand, if the price rebounds off the 20-day EMA with strength, the bulls will again try to push the price to $11.88.
반면에 가격이 20일 EMA에서 강하게 반등하면 상승세는 다시 가격을 $11.88로 끌어올리려고 시도할 것입니다.
This article does not contain investment advice or recommendations. Every investment and trading move involves risk, and readers should conduct their own research when making a decision.
이 글에는 투자 조언이나 추천이 포함되어 있지 않습니다. 모든 투자 및 거래 활동에는 위험이 수반되므로 독자는 결정을 내릴 때 스스로 조사해야 합니다.
 Crypto Front News
 DogeHome
 Crypto Daily™
 Crypto News Land
 TheNewsCrypto
 CFN
CFN Crypto Daily™
 Crypto Daily™
 Crypto Daily™


