

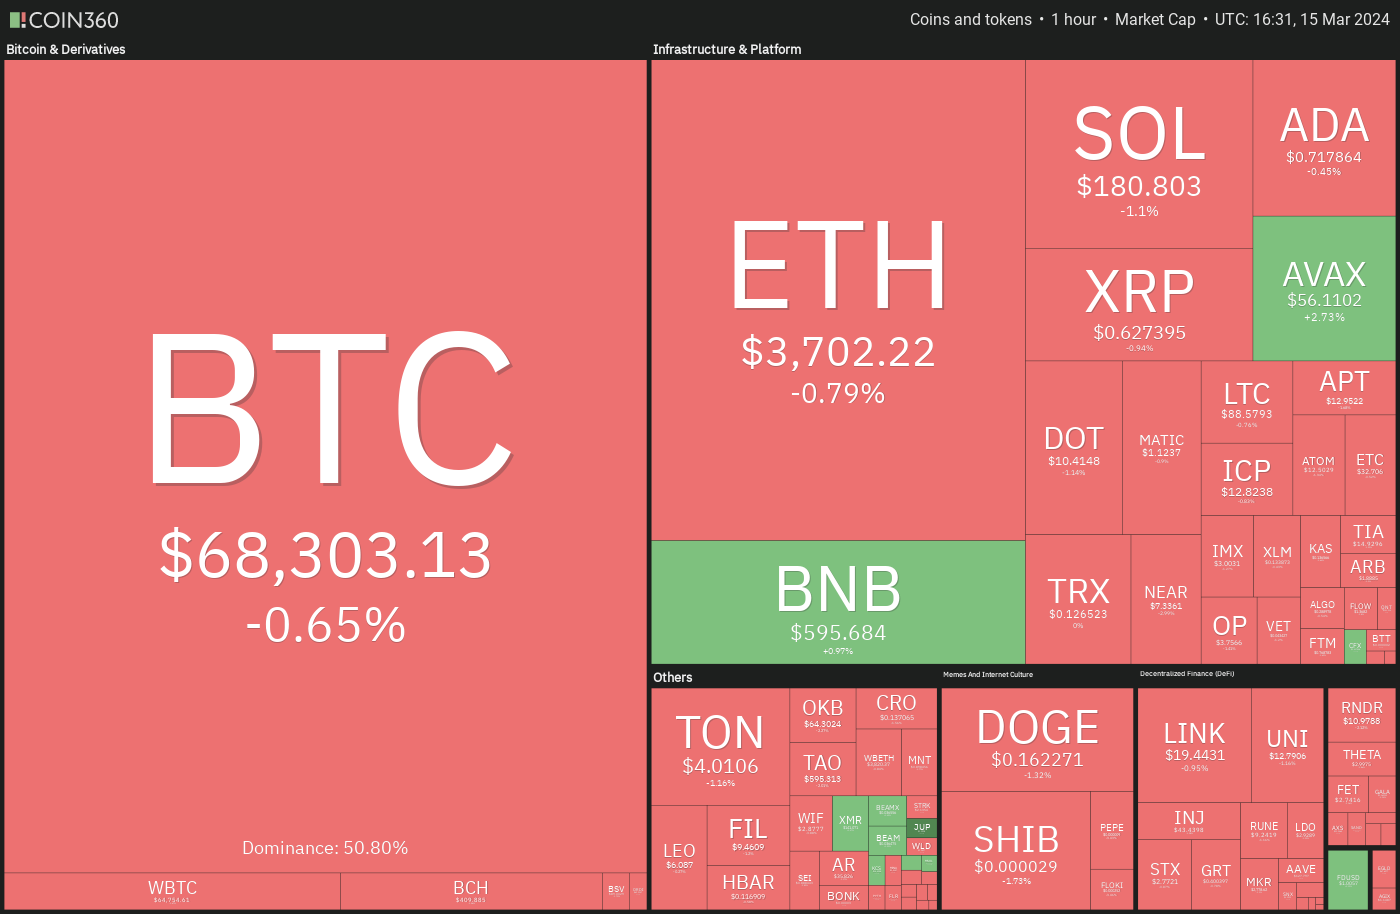
Bitcoin’s (BTC) sharp rally is showing signs of a short-term pullback, which could be one of the reasons for the mere $132 million in inflows into the spot Bitcoin exchange-traded funds on March 14. A marked slowdown in inflows could start a corrective phase as Bitcoin’s most recent leg of the rally has largely been driven by solid inflows into the Bitcoin ETFs.
ビットコイン(BTC)の急激な上昇は短期的な反動の兆しを見せており、これが3月14日にスポットビットコイン上場投資信託への流入額がわずか1億3,200万ドルにとどまった理由の1つである可能性がある。ビットコインの最近の上昇局面は主にビットコインETFへの堅調な流入によって牽引されており、調整局面に入っている。
If a correction starts in Bitcoin, how deep could that be? During previous halving cycles, Bitcoin has seen a drop close to 40%, according to a X (formerly Twitter) post by the pseudonymous trader known as Bags. If history were to repeat, then Bitcoin could plummet to about $45,500.
ビットコインで調整が始まった場合、その調整はどれほどの規模になる可能性があるでしょうか? Bagsとして知られる偽名のトレーダーによるX(旧Twitter)への投稿によると、これまでの半減期サイクルでビットコインは40%近く下落したという。もし歴史が繰り返されるなら、ビットコインは約45,500ドルまで急落する可能性がある。
Corrections are a part of every bull market. A positive sign during the current pullback is that it is largely due to profit-booking on hedges and has not led to “panic shorting yet,” according to popular trader Skew.
調整はあらゆる強気相場の一部です。人気トレーダーのスキュー氏によると、現在の反動の明るい兆しは、主にヘッジでの利益確定によるものであり、「パニック的な空売りにはまだ至っていない」ということだ。
Could the correction in Bitcoin and altcoins deepen, or will the price rebound from the current levels? Let’s analyze the charts of the top 10 cryptocurrencies to find out.
ビットコインとアルトコインの調整はさらに深まる可能性があるのか、それとも価格は現在の水準から反発するのか?それを知るために、トップ 10 の仮想通貨のチャートを分析してみましょう。
Bitcoin price analysis
ビットコイン価格分析
Bitcoin witnessed profit booking at $73,777 on March 14, but the bulls purchased the dip, as seen from the long tail on the candlestick.
ビットコインは3月14日に73,777ドルで利益確定したが、ローソク足のロングテールからわかるように、強気派が押し目を買った。
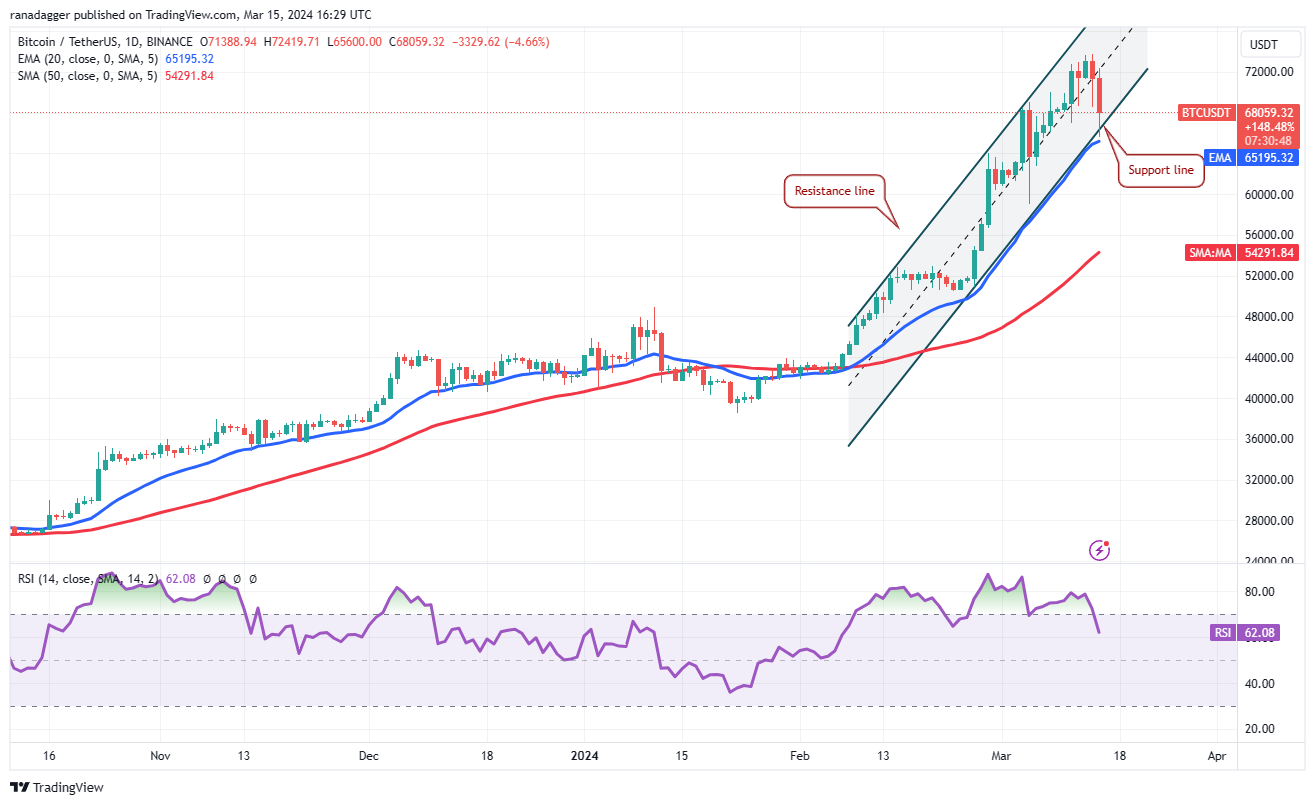
However, the failure to build upon the momentum on March 15 attracted strong selling by the short-term traders. The price has reached the support line of the ascending channel pattern, which is an important level to watch out for.
しかし、3月15日の勢いをさらに高めることができなかったため、短期トレーダーによる強い売りが集まった。価格は上昇チャネルパターンのサポートラインに達しており、これは注意すべき重要なレベルです。
If the price plummets below the channel and the 20-day exponential moving average ($65,195), it will indicate the start of a corrective phase. The BTC/USDT pair could slide to $59,000 and thereafter to the 50-day simple moving average ($54,291).
価格がチャネルと 20 日間の指数移動平均 (65,195 ドル) を下回ると、調整段階の開始を示します。 BTC/USDTペアは59,000ドルまで下落し、その後は50日単純移動平均(54,291ドル)まで下落する可能性がある。
Contrarily, if the price bounces off the support line, it will suggest that the pair may remain inside the channel for some more time. The bulls will again try to push the price above the overhead resistance at $73,777.
逆に、価格がサポートラインから跳ね返った場合は、ペアがしばらくチャネル内に留まる可能性があることを示唆します。強気派は再び価格を73,777ドルの直上の抵抗線を上回ろうとするだろう。
Ether price analysis
イーサ価格分析
Ether’s (ETH) up move stalled near $4,000, tempting short-term traders to book profits. The long tail on the March 14 candlestick shows the bulls tried to flip the $3,600 level into support, but the fall on March 15 shows that the bears have kept up the pressure.
イーサ(ETH)の上昇は4,000ドル付近で失速し、短期トレーダーが利益を確保するよう誘惑した。 3月14日のローソク足のロングテールは、強気派が3,600ドルのレベルをサポートに反転させようとしたことを示しているが、3月15日の下落は弱気派が圧力を維持していることを示している。
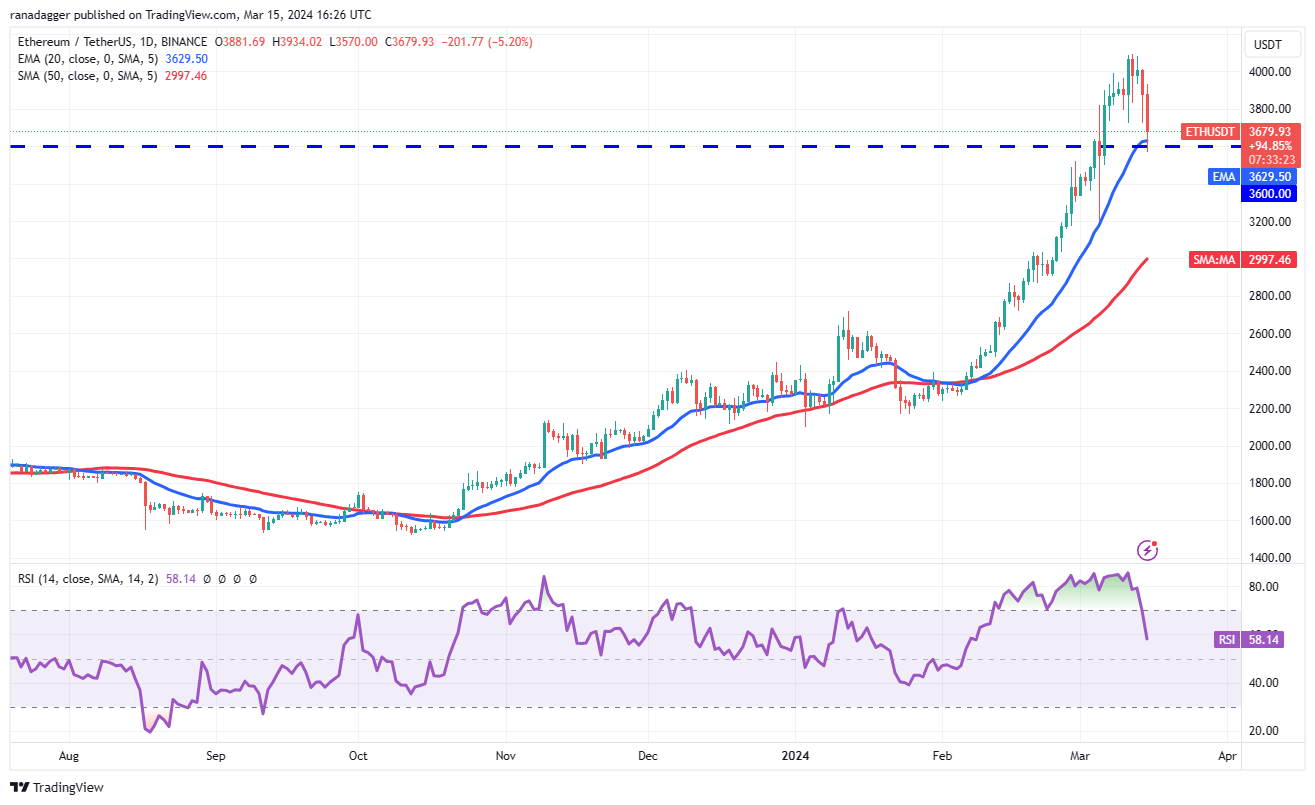
The bulls and the bears are likely to witness a tough battle near $3,600. If the price rebounds off this support, the bulls will again try to push the ETH/USDT pair to $4,000. The bears are expected to vigorously defend this level.
強気派と弱気派は3,600ドル付近で厳しい戦いを目撃する可能性が高い。価格がこのサポートから反発した場合、強気派は再びETH/USDTペアを4,000ドルまで押し上げようとするだろう。弱気派はこのレベルを精力的に守ることが予想される。
On the downside, the bears will try to yank the price below $3,600. If they do that, the selling could accelerate, and the ETH/USDT pair could slump to $3,200 and later to the 50-day SMA ($2,997). The greater the fall, the longer it will take for the pair to resume the uptrend.
マイナス面としては、弱気派は価格を3,600ドル以下に引き下げようとするだろう。そうなれば売りが加速し、ETH/USDTペアは3,200ドルまで下落し、その後は50日SMA(2,997ドル)まで下落する可能性がある。下落が大きければ大きいほど、上昇トレンドに戻るまでに時間がかかります。
BNB price analysis
BNB価格分析
BNB (BNB) has pulled back in a strong uptrend, indicating that the traders are booking profits after a sharp rally.
BNB(BNB)は力強い上昇トレンドから後退しており、トレーダーが急騰後に利益を確定していることを示している。
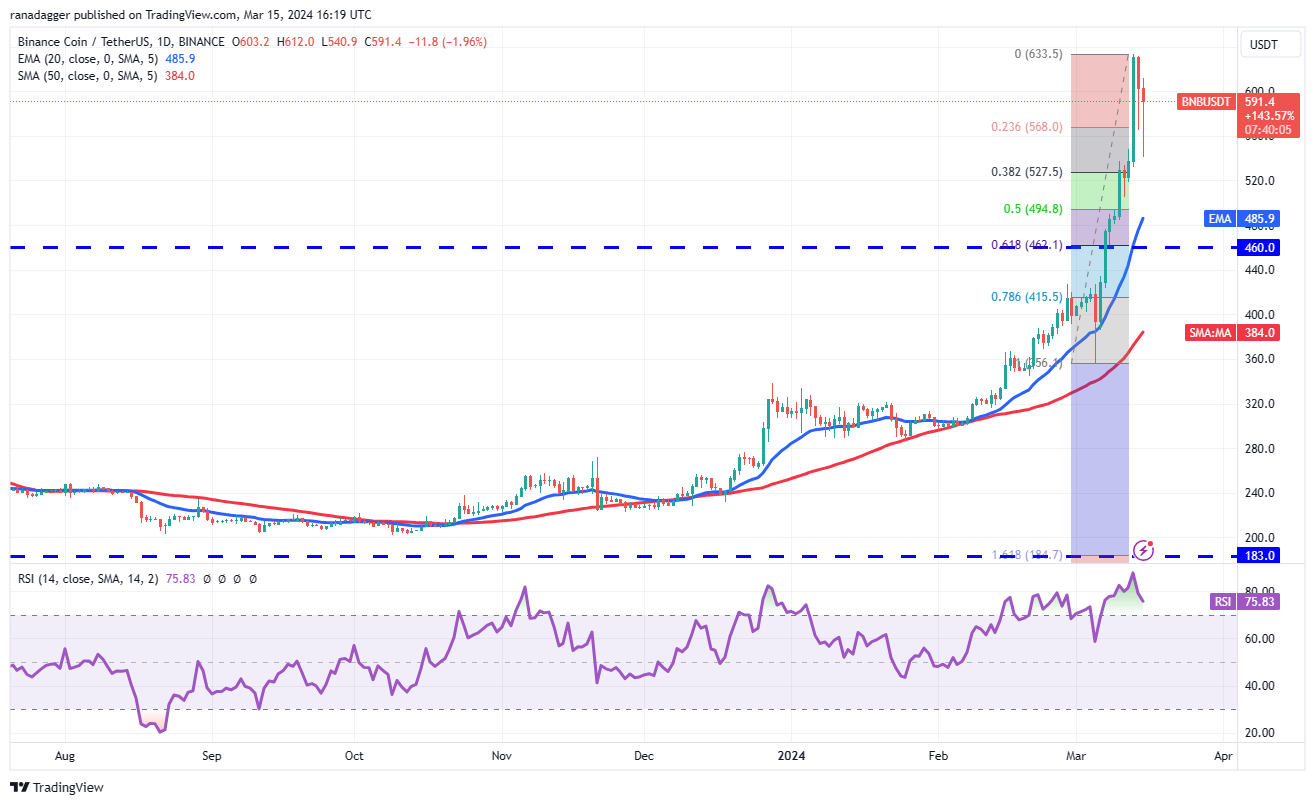
However, the long tail on the March 15 candlestick shows that the bulls are not ready to give up and are buying at the 38.2% Fibonacci retracement level of $527.50.
しかし、3月15日のローソク足のロングテールは、強気派が諦める準備ができておらず、38.2%のフィボナッチリトレースメントレベルである527.50ドルで購入していることを示しています。
A shallow pullback is a positive sign as it shows the bulls are not waiting for a deeper correction to enter. That increases the possibility of a break above $633. The pair may then climb to the $670 to $692 resistance zone.
浅い引き戻しは、強気派がより深い調整が入るのを待っていないことを示しているため、ポジティブな兆候です。これにより、633ドルを突破する可能性が高まる。その後、ペアは670ドルから692ドルのレジスタンスゾーンに上昇する可能性があります。
Contrary to this assumption, if the price turns down from the current level and breaks below $527, it will signal that every rally is being sold into. The BNB/USDT pair may then tumble to the 20-day EMA ($485).
この想定に反して、価格が現在のレベルから下落し、527ドルを下回った場合、あらゆる上昇相場が売り込まれているという合図になります。その後、BNB/USDTペアは20日間EMA(485ドル)まで下落する可能性がある。
Solana price analysis
ソラナの価格分析
Solana (SOL) has been in a strong uptrend for the past few days, indicating solid demand at higher levels.
ソラナ (SOL) は過去数日間強い上昇傾向にあり、より高いレベルでの堅調な需要を示しています。
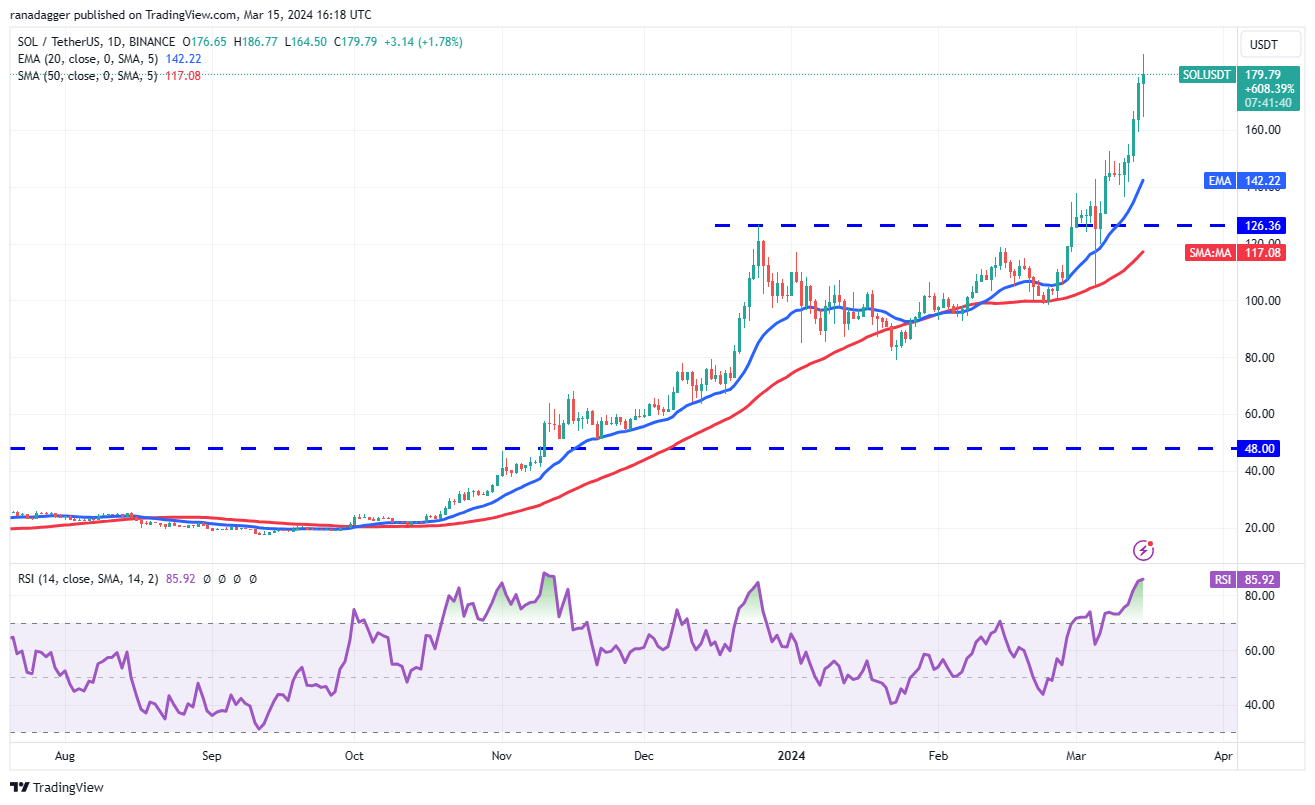
The up move has pushed the RSI deep into the overbought territory, suggesting that the SOL/USDT pair may have run up too fast in a short time. That could start a correction, which could pull the pair to the 20-day EMA ($142).
この上昇によりRSIは買われ過ぎの領域に深く押し込まれており、SOL/USDTペアが短期間で急上昇しすぎた可能性があることを示唆している。そうなると調整が始まり、20日間EMA(142ドル)まで上昇する可能性がある。
If the price rebounds off the 20-day EMA, it will suggest that the sentiment remains positive and traders are buying on dips. That may enhance the prospects of a rally to $205. This optimistic view will be negated on a break below the 20-day EMA. The pair may then slump to the breakout level at $126.
価格が20日間EMAから反発した場合、センチメントは引き続きポジティブであり、トレーダーが押し目買いをしていることを示唆するでしょう。これにより、205ドルまで上昇する可能性が高まるかもしれない。この楽観的な見方は、20日間EMAを下回ると打ち消されるだろう。その後、ペアは126ドルのブレイクアウトレベルまで下落する可能性があります。
XRP price analysis
XRP価格分析
XRP (XRP) turned down from $0.74 on March 12, indicating that the bears are fiercely defending the level.
XRP(XRP)は3月12日の0.74ドルから下落し、弱気派がその水準を激しく守っていることを示している。
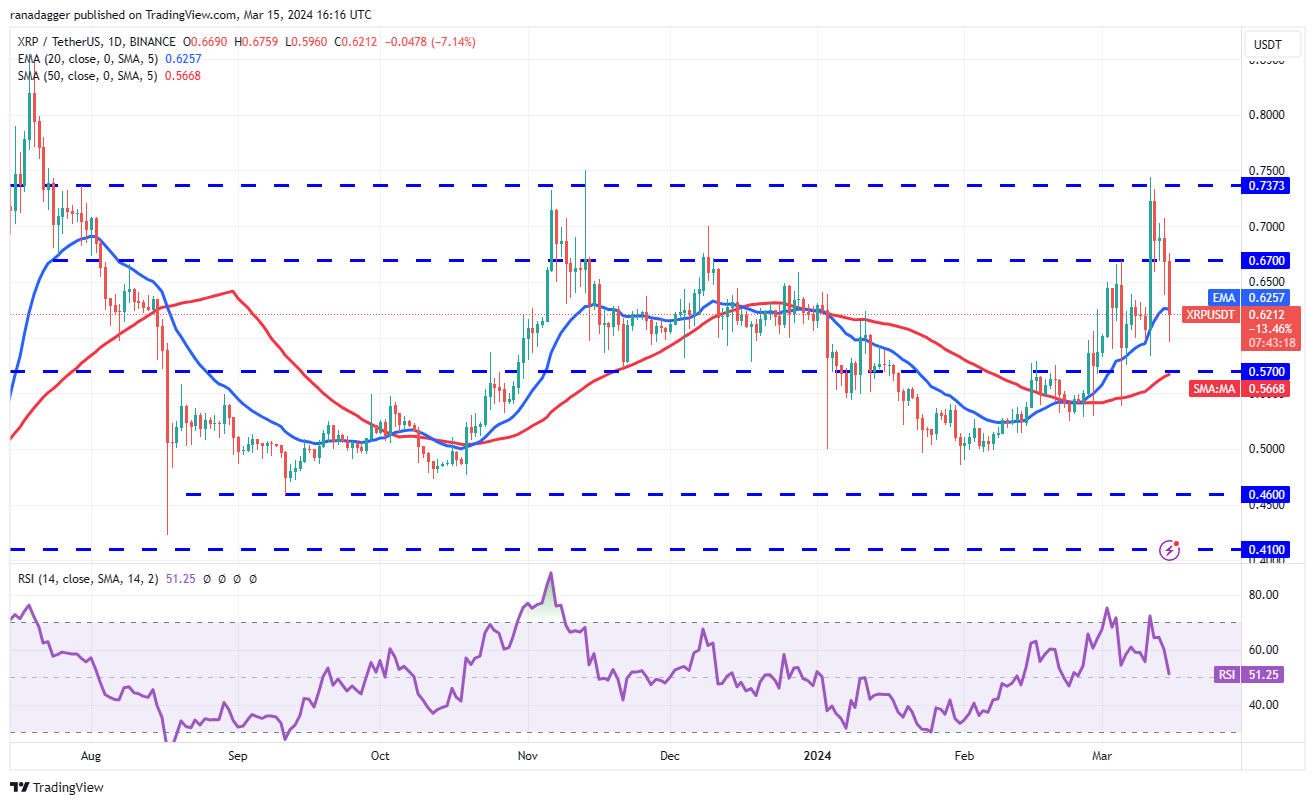
The bulls tried to flip $0.67 into support on March 13, but the bears had other plans. They continued their selling and pulled the price back below the $0.67 level on March 14.
強気派は3月13日に0.67ドルをサポートに転嫁しようとしたが、弱気派には別の計画があった。彼らは売りを続け、価格を3月14日の0.67ドル以下に戻した。
The selling increased further on March 15, and the XRP/USDT pair broke below the 20-day EMA ($0.62). This suggests that the pair may consolidate inside a large range between $0.50 and $0.74 for some time. A break and close above $0.74 will signal the start of a new uptrend toward $1.02.
3月15日には売りがさらに増え、XRP/USDTペアは20日間EMA(0.62ドル)を下回った。これは、しばらくの間、ペアが0.50ドルから0.74ドルの間の大きなレンジ内で保ち合う可能性があることを示唆しています。 0.74ドルを超えてブレイクして終値を迎えると、1.02ドルに向けた新たな上昇トレンドの始まりを示すことになる。
Cardano price analysis
カルダノの価格分析
The bulls tried to kick Cardano (ADA) above the overhead resistance of $0.80 on March 14, but the long wick on the candlestick shows selling at higher levels.
強気派は3月14日にカルダノ(ADA)を頭上の抵抗線である0.80ドルを超えようとしたが、ローソク足の長い芯はより高いレベルでの売りを示している。
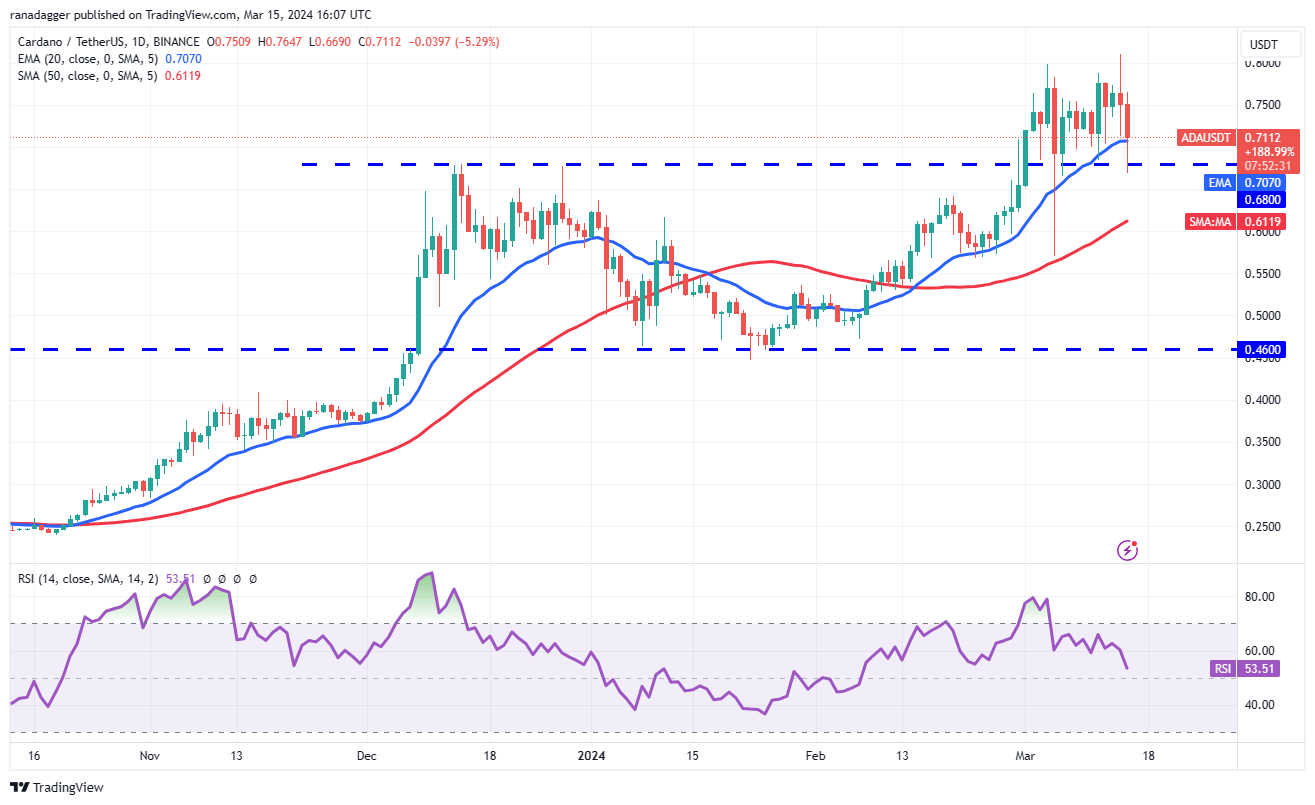
The price turned down sharply, and the price dipped to the breakout level of $0.68 on March 15. If bears sink the price below $0.68, it will signal the start of a deeper correction toward the 50-day SMA ($0.61).
価格は急激に下落し、3月15日に価格はブレイクアウトレベルの0.68ドルまで下落した。弱気派が価格を0.68ドル以下に下げた場合、50日間SMA(0.61ドル)に向けてさらに深い調整が始まることを示すことになる。
Alternatively, if the price rebounds off $0.68, it will suggest that the bulls continue to buy near strong support levels. The ADA/USDT pair could then swing between $0.68 and $0.80 for a while. A break above $0.80 could launch the pair to $0.92.
あるいは、価格が0.68ドルから反発した場合、強気派が強い支持線付近で買いを続けることを示唆するだろう。その後、ADA/USDTペアはしばらく0.68ドルから0.80ドルの間で変動する可能性がある。 0.80ドルを超えると、ペアは0.92ドルまで上昇する可能性がある。
Dogecoin price analysis
ドージコインの価格分析
Dogecoin (DOGE) rose above the $0.18 resistance on March 14, but the long wick on the candlestick shows selling at higher levels.
ドージコイン(DOGE)は3月14日の0.18ドルの抵抗線を超えて上昇したが、ローソク足の長い芯はより高いレベルでの売りを示している。
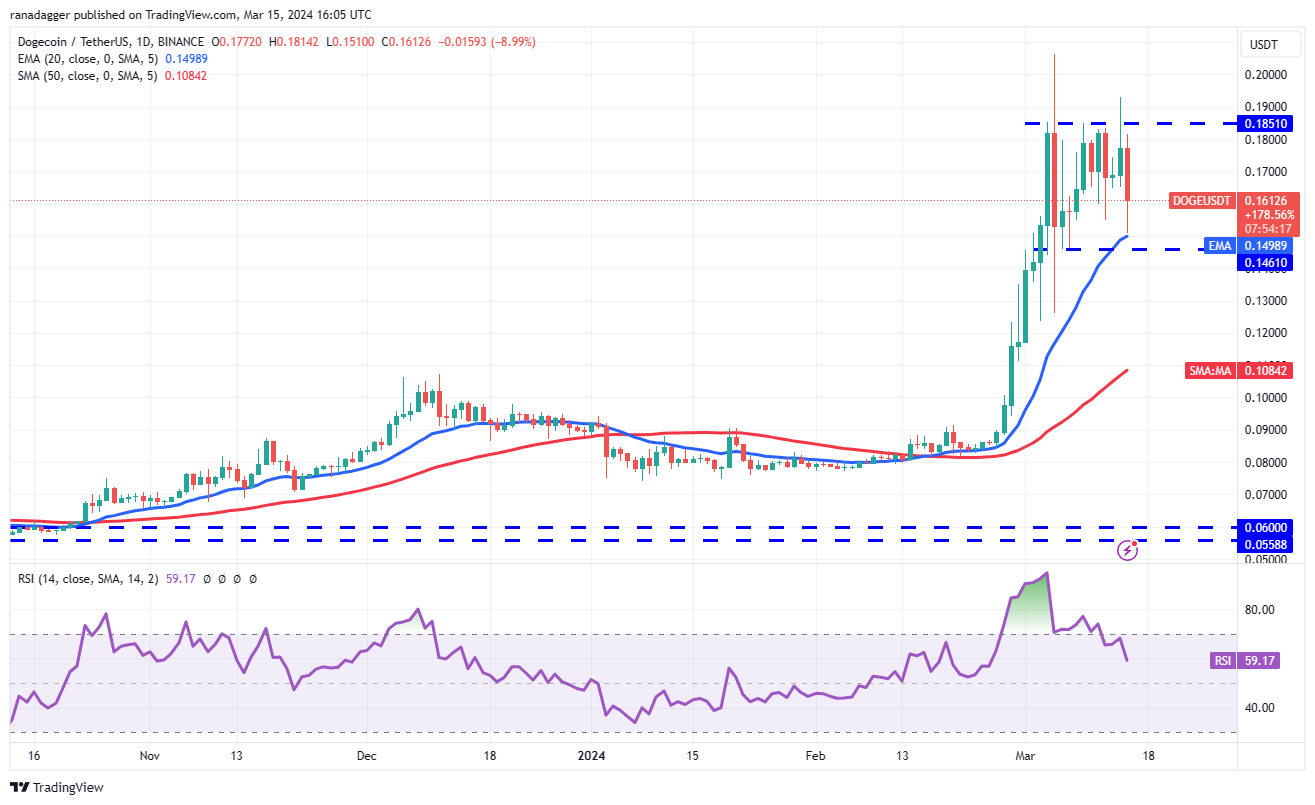
The price turned down sharply and reached the 20-day EMA ($0.15) on March 15. This suggests that the DOGE/USDT pair may remain stuck inside the range for a few more days. A break and close below $0.15 will tilt the advantage in favor of the bears. The pair could then tumble toward $0.12.
価格は急激に下落し、3月15日には20日間EMA(0.15ドル)に達しました。これは、DOGE/USDTペアがさらに数日間レンジ内にとどまる可能性があることを示唆しています。 0.15ドルを下回って終値をとれば、弱気派に有利に傾くだろう。その後、ペアは0.12ドルに向けて下落する可能性がある。
Contrarily, a rally above $0.18 will suggest that the bulls have absorbed the supply. That will open the doors for a rally to $0.24 and then $0.30.
逆に、0.18ドルを超える上昇は、強気派が供給を吸収したことを示唆するだろう。これにより、0.24ドル、そして0.30ドルへの上昇の扉が開かれることになる。
Related: Bitcoin overtakes gold in investor portfolio allocation — JPMorgan
関連: 投資家のポートフォリオ配分でビットコインが金を追い越す — JPモルガン
Avalanche price analysis
雪崩価格分析
Avalanche (AVAX) witnessed a large range day with a long wick and a long tail on March 14, indicating indecision between the bulls and the bears.
アバランチ(AVAX)は、3月14日に長い芯と長い尾を伴う大規模な放牧日を目撃したが、これは強気派と弱気派の間で優柔不断であることを示している。
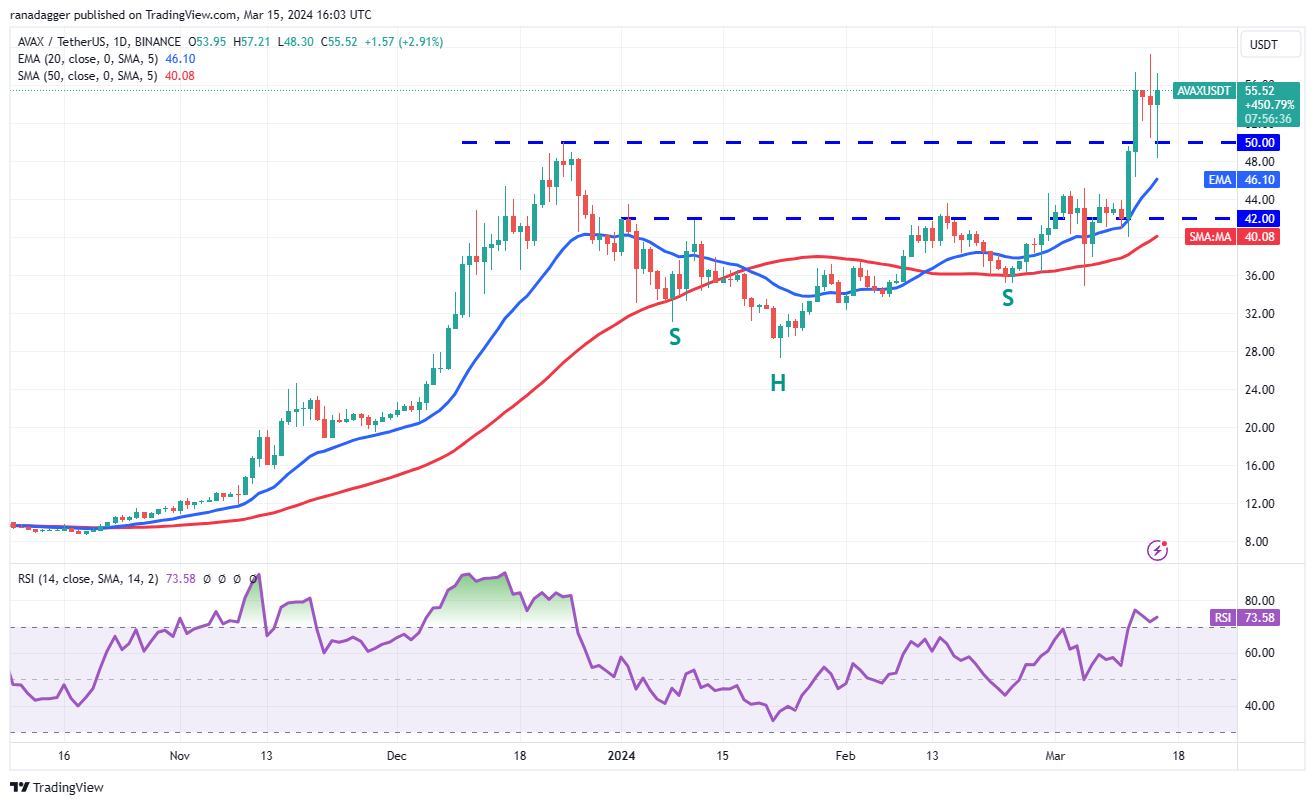
The bears tried to strengthen their position on March 15, but the long tail on the candlestick shows solid buying near the breakout level of $50. This suggests that the bulls are trying to flip $50 into support. If buyers shove the price above $59, the AVAX/USDT pair could resume its uptrend to $87.
弱気派は3月15日にポジションを強化しようとしたが、ローソク足のロングテールはブレイクアウトレベルの50ドル付近で堅調な買いが入っていることを示している。これは強気派が50ドルをサポートに転嫁しようとしていることを示唆している。買い手が価格を59ドル以上に押し上げた場合、AVAX/USDTペアは87ドルまで上昇傾向を再開する可能性がある。
If bears want to prevent the upside, they will have to maintain the price below the 20-day EMA. That could sink the pair to the 50-day SMA ($40).
弱気派が上昇を阻止したい場合は、価格を20日間EMA以下に維持する必要がある。これにより、同ペアは50日間SMA(40ドル)まで下落する可能性がある。
Shiba Inu price analysis
柴犬の価格分析
Shiba Inu (SHIB) tumbled below the $0.000029 support on March 15, indicating that the bears are trying to establish their supremacy.
柴犬(SHIB)は3月15日に0.000029ドルのサポートを下回り、弱気派が優位性を確立しようとしていることを示した。
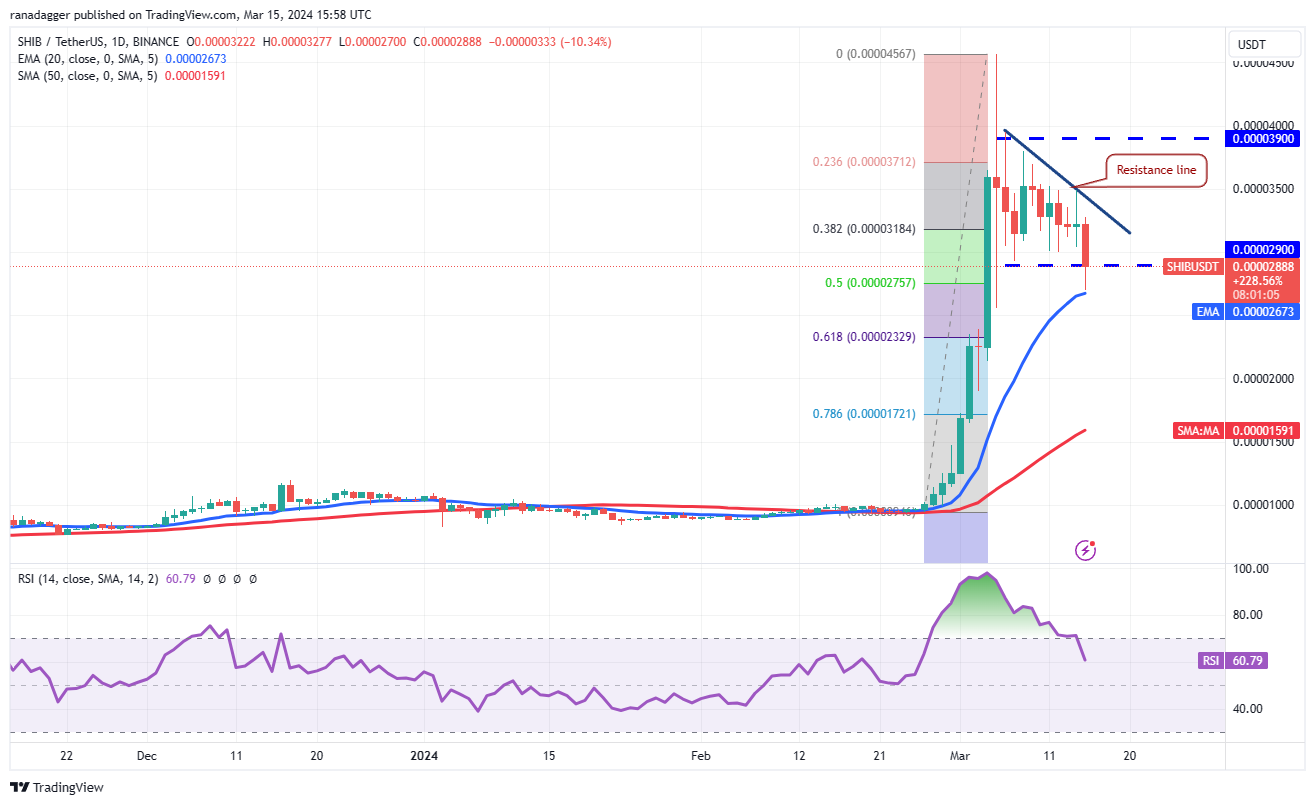
The bulls are trying to defend the 20-day EMA ($0.000027), but the recovery is expected to face selling at the downtrend line. If the price turns lower from the downtrend line, it will increase the likelihood of a slide to the 61.8% Fibonacci retracement level of $0.000023 and then $0.000019.
強気派は20日間EMA(0.000027ドル)を守ろうとしているが、回復は下降トレンドラインで売りに直面すると予想される。価格が下降トレンドラインから下落した場合、61.8%のフィボナッチリトレースメントレベルである0.000023ドル、そして0.000019ドルまで下落する可能性が高まります。
Conversely, if the price turns up and breaks above the downtrend line, it will suggest that the markets have rejected the lower levels. The SHIB/USDT pair could rally to the overhead resistance of $0.000039.
逆に、価格が上昇して下降トレンドラインを上抜けた場合は、市場が下値を拒否したことを示唆します。 SHIB/USDTペアは0.000039ドルの直上抵抗線まで上昇する可能性がある。
Polkadot price analysis
水玉価格分析
Polkadot (DOT) turned down from $11.88 on March 14, and the selling picked up momentum on March 15.
ポルカドット(DOT)は3月14日の11.88ドルから下落に転じ、3月15日には売りの勢いが増した。
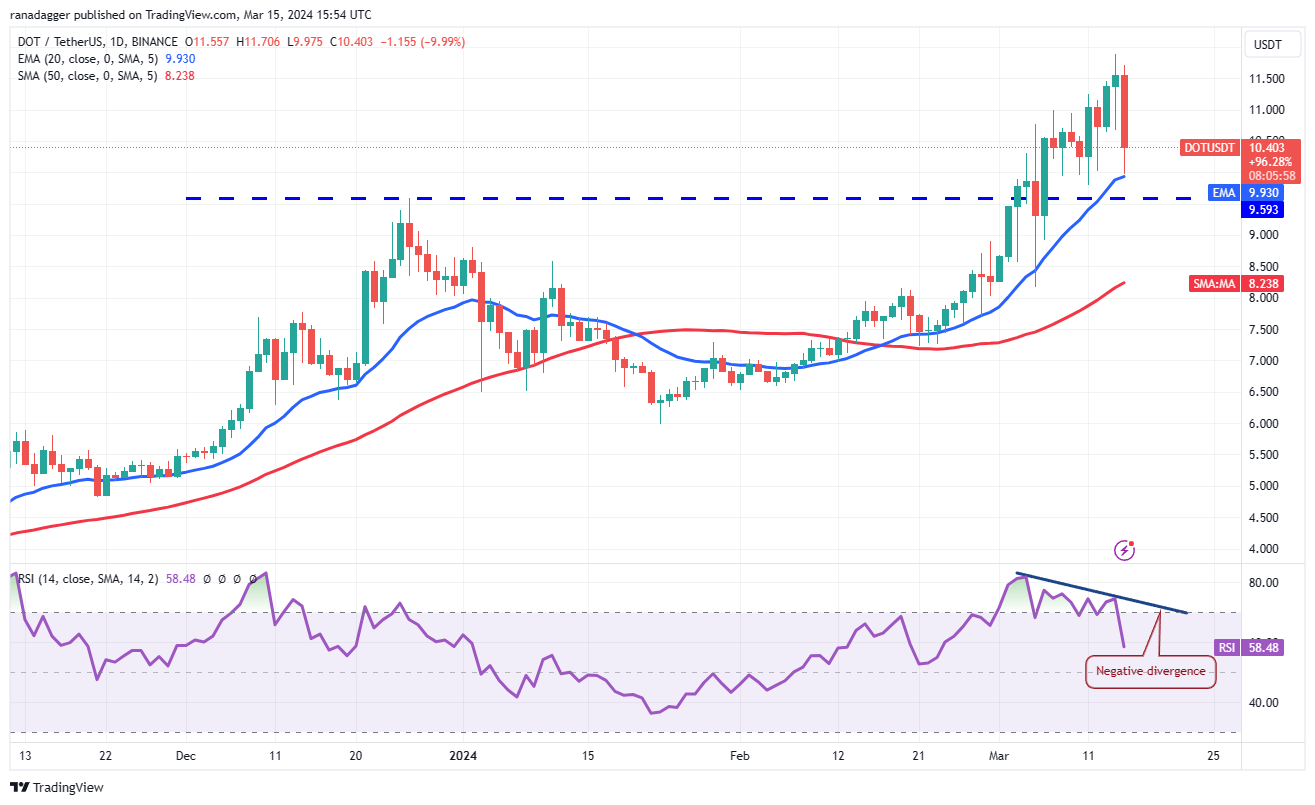
The negative divergence on the RSI suggests that the bullish momentum is waning. That increases the risk of a drop below the 20-day EMA ($9.93) and the breakout level of $9.59. If that happens, the DOT/USDT pair may start a deeper pullback. The pair could then decline to the 50-day SMA ($8.23).
RSIのマイナスの乖離は、強気の勢いが弱まっていることを示唆しています。これにより、20日間EMA(9.93ドル)および9.59ドルのブレイクアウトレベルを下回るリスクが高まります。そうなれば、DOT/USDTペアはさらに深い下落を始める可能性がある。その後、ペアは50日間SMA(8.23ドル)まで下落する可能性がある。
On the other hand, if the price rebounds off the 20-day EMA with strength, the bulls will again try to push the price to $11.88.
一方、価格が20日間EMAから力強く反発した場合、強気派は再び価格を11.88ドルまで押し上げようとするだろう。
This article does not contain investment advice or recommendations. Every investment and trading move involves risk, and readers should conduct their own research when making a decision.
この記事には投資に関するアドバイスや推奨事項は含まれません。あらゆる投資や取引の動きにはリスクが伴うため、読者は決定を下す際に独自の調査を行う必要があります。
 CoinDesk
 Crypto News Land
 DogeHome
 TheCoinrise Media
 TheCoinrise Media
 Crypto News Land
 Thecryptoupdates
 crypto.ro English
 Crypto News Land


