

Stock markets in the United States continued their march higher last week, even after the Federal Reserve Chair Jerome Powell dashed hopes of a rate cut in March. However, Powell did say that a rate cut would likely happen this year. Powell reiterated these views during his interview with CBS news show 60 Minutes.
Los mercados bursátiles de Estados Unidos continuaron su marcha al alza la semana pasada, incluso después de que el presidente de la Reserva Federal, Jerome Powell, frustrara las esperanzas de un recorte de tasas en marzo. Sin embargo, Powell dijo que probablemente se produciría un recorte de tipos este año. Powell reiteró estas opiniones durante su entrevista con el programa de noticias 60 Minutes de CBS.
Fed comments and strong macroeconomic data reduced expectations of rate cuts by the Fed to 120 basis points in 2024, down from 150 basis points at the end of last year, Fed funds futures showed. This pushed the U.S. dollar Index (DXY) to its highest level in 11 weeks.
Los comentarios de la Fed y los sólidos datos macroeconómicos redujeron las expectativas de recortes de tasas por parte de la Fed a 120 puntos básicos en 2024, por debajo de los 150 puntos básicos a fines del año pasado, mostraron los futuros de los fondos de la Fed. Esto llevó el índice del dólar estadounidense (DXY) a su nivel más alto en 11 semanas.
Historically, Bitcoin (BTC) moves in inverse correlation with the U.S. dollar. Hence the strength in the greenback could act as a headwind for Bitcoin in the near term. A minor positive in favor of the bulls is the strong inflows into BlackRock and Fidelity’s spot Bitcoin exchange-traded funds (ETFs) in January, totaling about $4.8 billion. Continued inflows into the ETFs could limit the downside.
Históricamente, Bitcoin (BTC) se mueve en correlación inversa con el dólar estadounidense. Por lo tanto, la fortaleza del dólar podría actuar como un obstáculo para Bitcoin en el corto plazo. Un aspecto positivo menor a favor de los alcistas son las fuertes entradas en los fondos cotizados en bolsa (ETF) de Bitcoin de BlackRock y Fidelity en enero, por un total de alrededor de 4.800 millones de dólares. Las continuas entradas de capital a los ETF podrían limitar la caída.
Will Bitcoin remain stuck in a range, or is a breakout on the cards? How are the altcoins expected to behave? Let’s analyze the charts to find out.
¿Bitcoin permanecerá estancado en un rango o hay una ruptura en juego? ¿Cómo se espera que se comporten las altcoins? Analicemos los gráficos para averiguarlo.
S&P 500 Index price analysis
Análisis de precios del índice S&P 500
The S&P 500 Index rebounded off the 20-day exponential moving average (4,850) on Feb. 1 and soared to a new all-time high on Feb. 2.
El índice S&P 500 se recuperó del promedio móvil exponencial de 20 días (4.850) el 1 de febrero y se disparó a un nuevo máximo histórico el 2 de febrero.
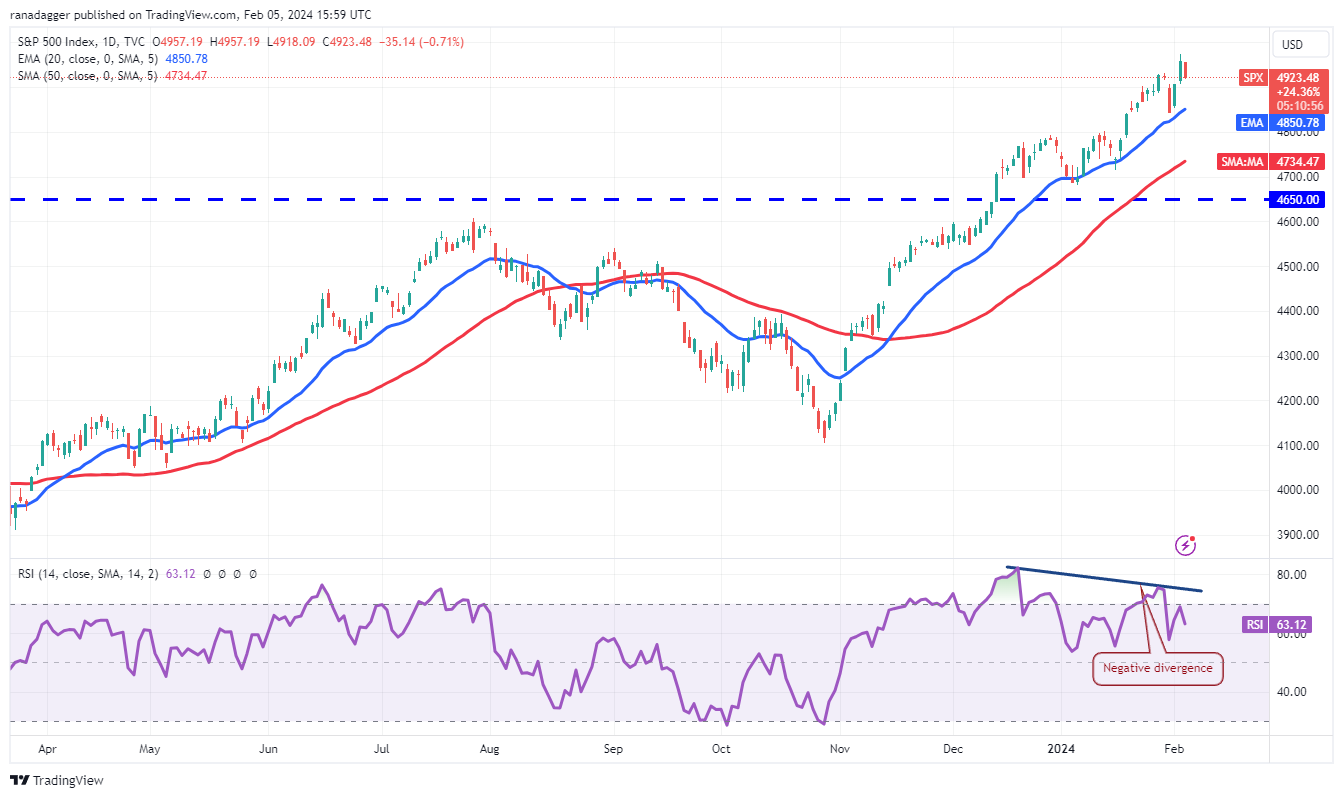
Both moving averages are sloping up, indicating that the bulls are in command, but the negative divergence on the relative strength index (RSI) warrants caution. The up move could face selling at the psychological resistance of 5,000, but if buyers bulldoze their way through, the next stop could be 5,200.
Ambos promedios móviles están subiendo, lo que indica que los alcistas tienen el mando, pero la divergencia negativa en el índice de fuerza relativa (RSI) justifica cautela. El movimiento alcista podría enfrentar ventas en la resistencia psicológica de 5.000, pero si los compradores se abren paso con excavadoras, la siguiente parada podría ser 5.200.
The crucial support on the downside is the 20-day EMA. A slide below this level will be the first indication that the bulls are rushing to the exit. That may start a fall to the 50-day simple moving average (4,734) and then to 4,650.
El soporte crucial a la baja es la EMA de 20 días. Una caída por debajo de este nivel será la primera indicación de que los alcistas se apresuran hacia la salida. Eso puede iniciar una caída hasta el promedio móvil simple de 50 días (4.734) y luego hasta 4.650.
U.S. dollar Index price analysis
Análisis de precios del índice del dólar estadounidense
The U.S. dollar Index snapped back sharply from the 50-day SMA (102.84) on Feb. 2 and broke above the neckline of the inverted head-and-shoulders pattern.
El índice del dólar estadounidense se recuperó bruscamente desde la media móvil simple (SMA) de 50 días (102,84) del 2 de febrero y superó el escote del patrón invertido de cabeza y hombros.
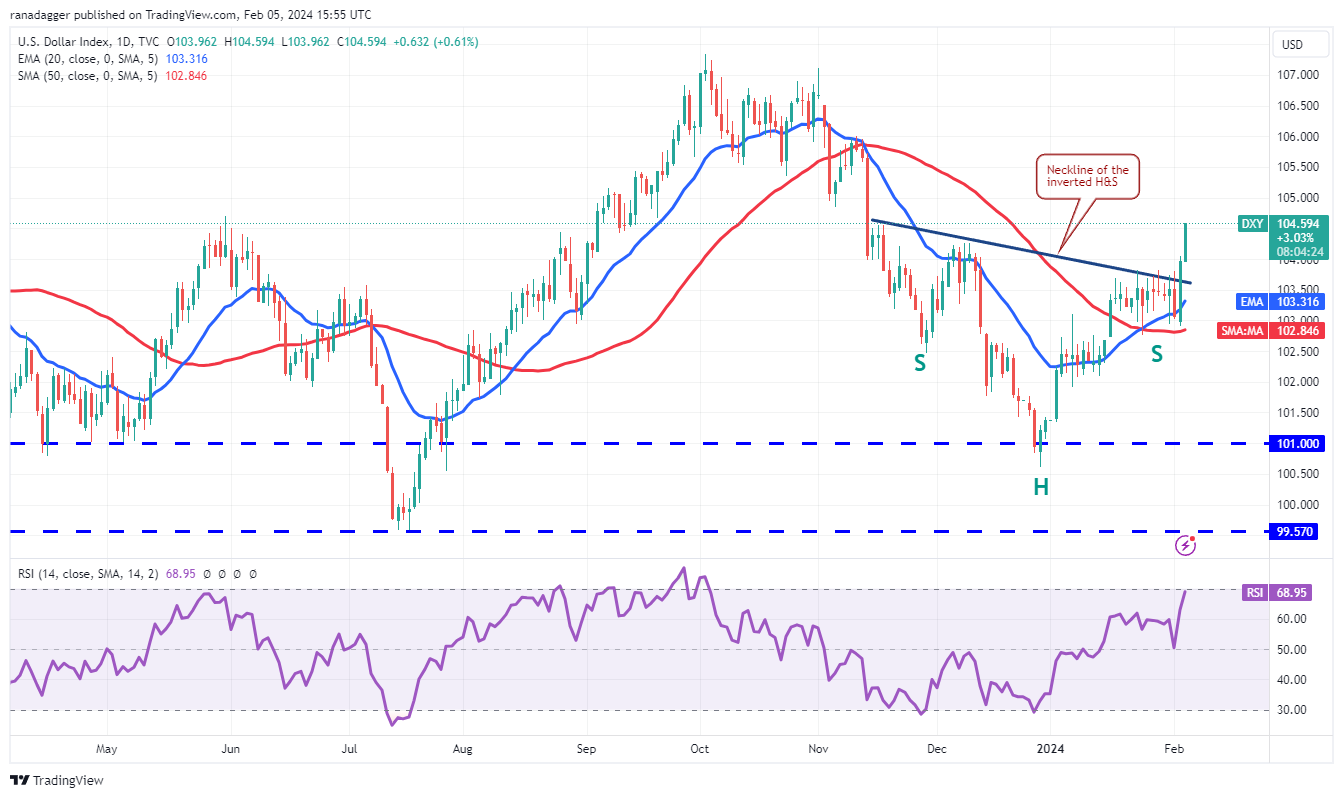
The pattern target of the bullish setup is 107.39, just below the formidable overhead resistance at 108. However, the bears are unlikely to give up easily. They will try to halt the up move near 104.55 and again at 106.
El patrón objetivo de la configuración alcista es 107,39, justo por debajo de la formidable resistencia superior de 108. Sin embargo, es poco probable que los bajistas se rindan fácilmente. Intentarán detener el movimiento alcista cerca de 104,55 y nuevamente en 106.
If bears want to make a comeback, they will have to tug the price below the 50-day SMA to seize control. The index may decline to the vital support zone between 101 and 99.57. The bulls are expected to defend this zone with all their might.
Si los bajistas quieren regresar, tendrán que bajar el precio por debajo de la SMA de 50 días para tomar el control. El índice puede caer a la zona de soporte vital entre 101 y 99,57. Se espera que los alcistas defiendan esta zona con todas sus fuerzas.
Bitcoin price analysis
Análisis de precios de Bitcoin
The bears have failed to sink Bitcoin below the 20-day EMA ($42,463) even after repeated attempts, suggesting that the bulls are fiercely defending the level.
Los bajistas no han logrado hundir Bitcoin por debajo de la EMA de 20 días ($42,463) incluso después de repetidos intentos, lo que sugiere que los alcistas están defendiendo ferozmente el nivel.
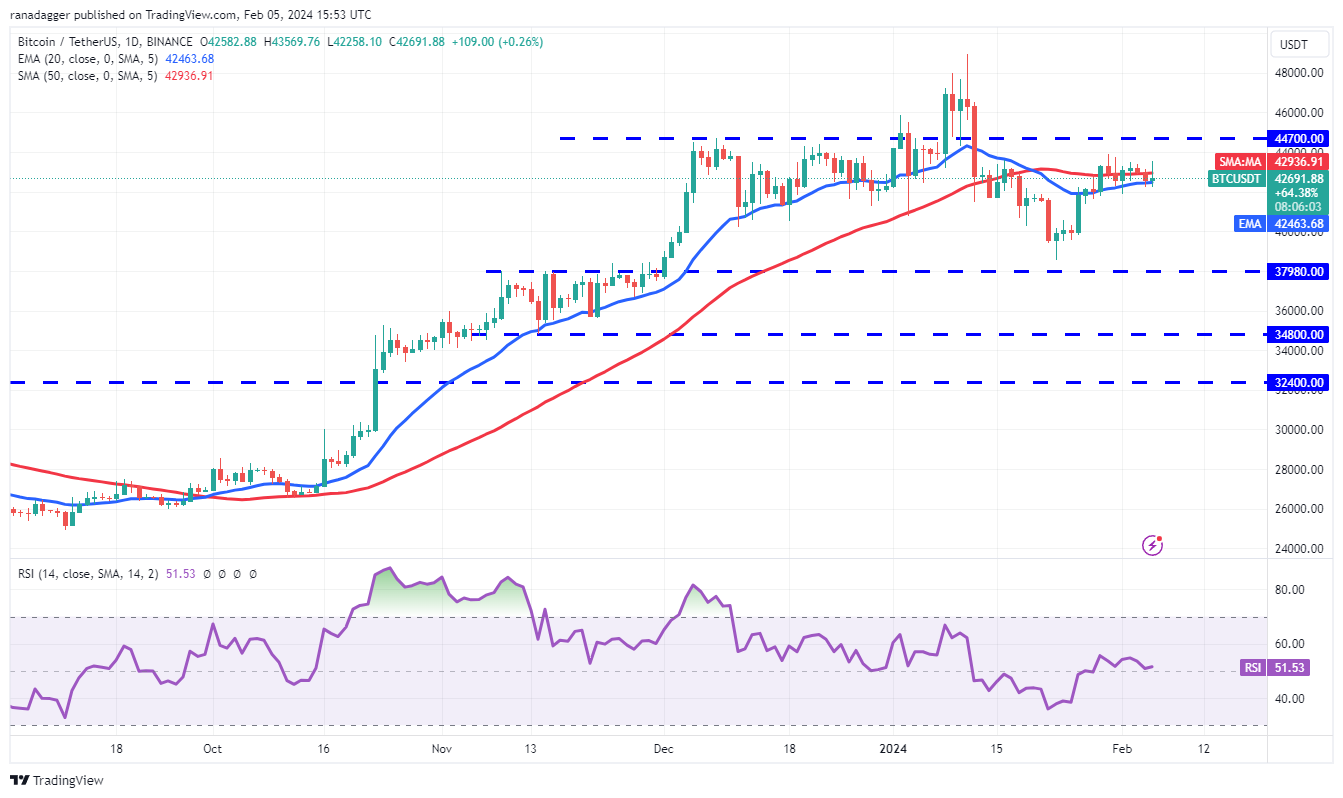
Buyers will try to push the price to the $44,000 to $44,700 overhead resistance zone. This remains the key zone for the bears to defend because if they fail in their endeavor, the BTC/USDT pair could skyrocket to the psychological level of $50,000.
Los compradores intentarán llevar el precio a la zona de resistencia superior de entre 44.000 y 44.700 dólares. Esta sigue siendo la zona clave que deben defender los bajistas porque si fallan en su esfuerzo, el par BTC/USDT podría dispararse hasta el nivel psicológico de $50,000.
On the other hand, if the price turns down from $44,700, the pair may consolidate in a tight range for a while. The bears will be on top if they sink the pair below $41,394. The pair may then slide to $40,000 and eventually to $37,980.
Por otro lado, si el precio baja desde $44,700, el par puede consolidarse en un rango estrecho por un tiempo. Los bajistas estarán en la cima si hunden el par por debajo de los USD 41,394. Luego, el par puede caer a $40,000 y eventualmente a $37,980.
Ether price analysis
Análisis de precios de éter
Ether (ETH) has been trading below the moving averages for several days, but the bears have failed to pull the price to the strong support at $2,100. This suggests buying at lower levels.
Ether (ETH) ha estado cotizando por debajo de los promedios móviles durante varios días, pero los bajistas no han logrado llevar el precio al fuerte soporte de $2,100. Esto sugiere comprar a niveles más bajos.
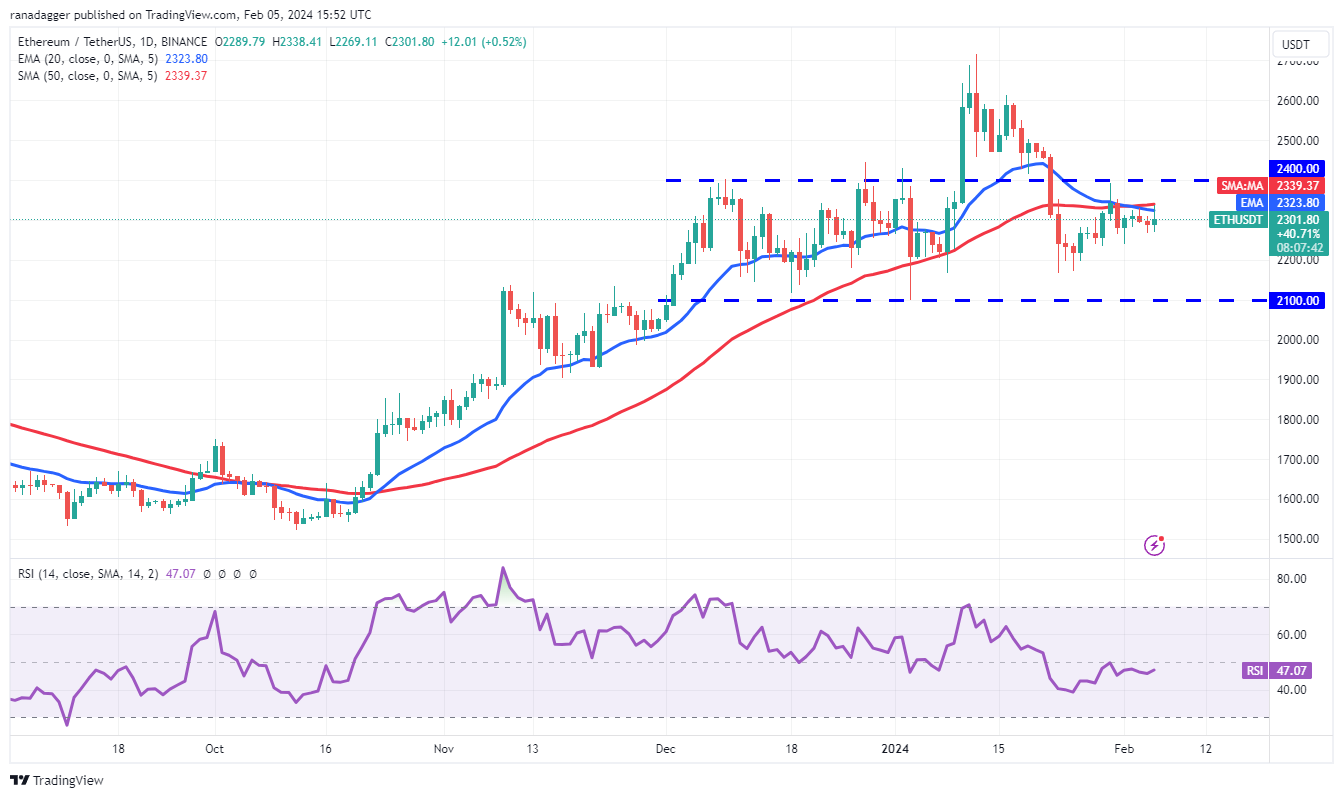
The bulls are trying to push the price above the moving averages. If they do that, the ETH/USDT pair could challenge the $2,400 level. A break and close above this resistance will indicate that bulls have overpowered the bears. The pair may rise to $2,600 and then to the Jan. 12 intraday high of $2,717.
Los alcistas están intentando llevar el precio por encima de las medias móviles. Si lo hacen, el par ETH/USDT podría desafiar el nivel de $2,400. Una ruptura y un cierre por encima de esta resistencia indicarán que los alcistas han dominado a los bajistas. El par puede subir a $2,600 y luego al máximo intradiario del 12 de enero de $2,717.
Conversely, if the price turns down from the overhead resistance, it will signal that the bears are active at higher levels. That may keep the pair stuck inside the $2,100 to $2,400 range for some more time.
Por el contrario, si el precio baja desde la resistencia superior, indicará que los bajistas están activos en niveles más altos. Eso puede mantener al par estancado dentro del rango de $2,100 a $2,400 por algún tiempo más.
BNB price analysis
Análisis de precios de BNB
BNB (BNB) bounced off the 50-day SMA ($300) on Feb. 4, but the bulls are struggling to build upon the strength.
BNB (BNB) rebotó en la SMA de 50 días ($300) el 4 de febrero, pero los alcistas están luchando por aprovechar esa fortaleza.
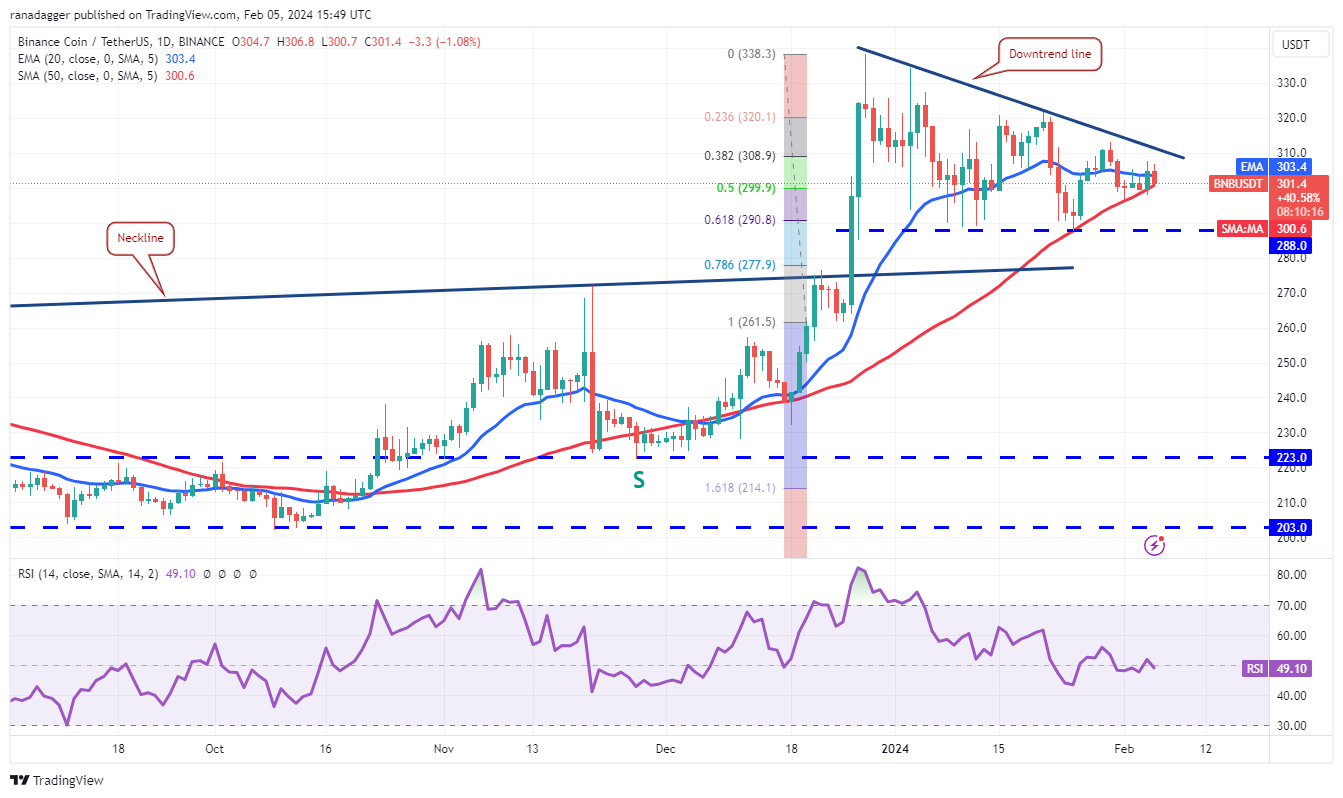
Buyers will have to clear the overhead hurdle at the downtrend line to invalidate the descending triangle pattern. If they succeed, the BNB/USDT pair could rally to $320 and subsequently to $338.
Los compradores tendrán que superar el obstáculo superior en la línea de tendencia bajista para invalidar el patrón de triángulo descendente. Si tienen éxito, el par BNB/USDT podría subir a $320 y posteriormente a $338.
Contrary to this assumption, if the price turns down and breaks below the 50-day SMA, it will indicate that the bears continue to sell on minor rallies. The pair may then drop to the strong support at $288. If this level crumbles, the pair will complete the bearish setup, which could start a down move to $260.
Contrariamente a esta suposición, si el precio baja y cae por debajo de la SMA de 50 días, indicará que los bajistas continúan vendiendo en repuntes menores. Luego, el par puede caer hasta el fuerte soporte de 288 dólares. Si este nivel se desmorona, el par completará la configuración bajista, lo que podría iniciar un movimiento bajista hasta los USD 260.
XRP price analysis
Análisis de precios XRP
The bears could not maintain XRP (XRP) below $0.50 on Jan. 31 and Feb. 1, which started a recovery to the 20-day EMA ($0.53) on Feb. 3.
Los bajistas no pudieron mantener el XRP (XRP) por debajo de 0,50 dólares el 31 de enero y el 1 de febrero, lo que inició una recuperación hasta la EMA de 20 días (0,53 dólares) el 3 de febrero.
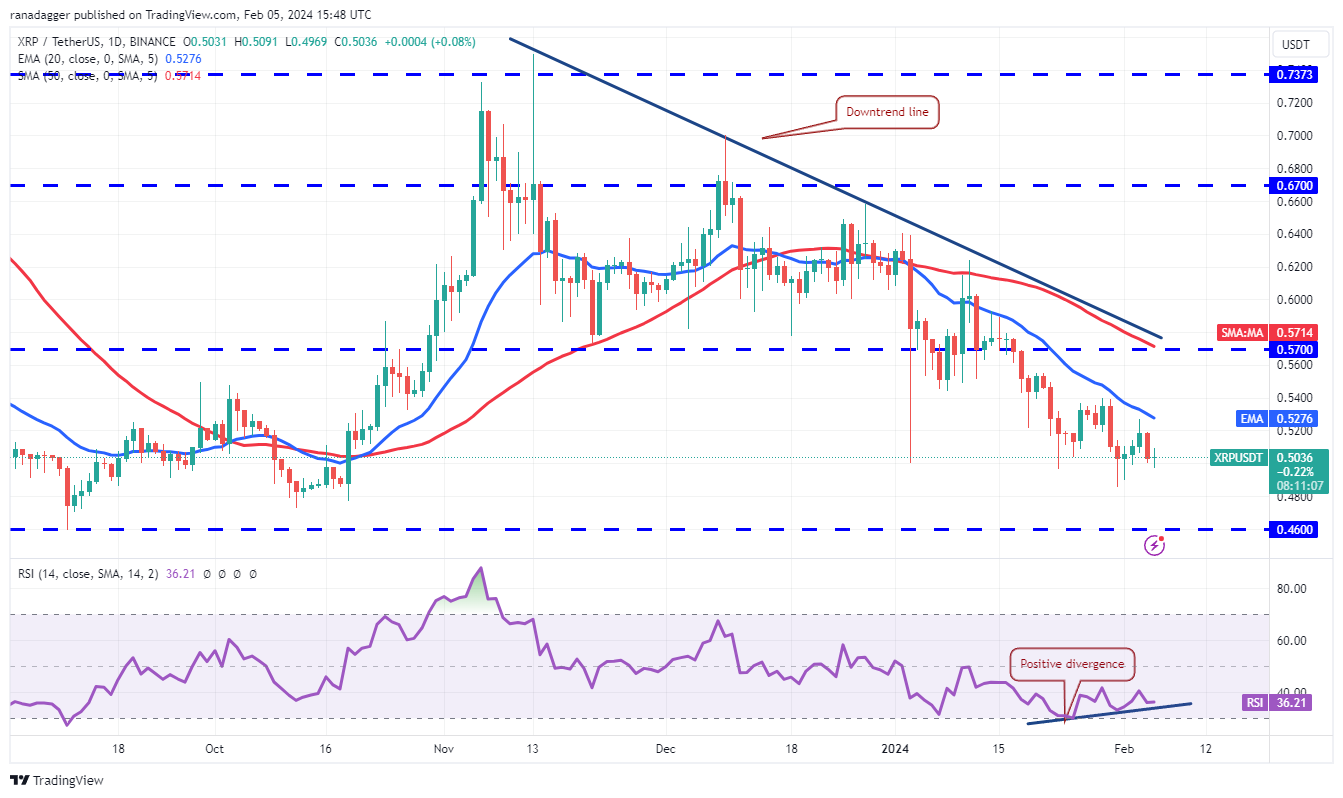
The price turned down from the 20-day EMA on Feb. 4, indicating that the sentiment remains negative and traders are selling on rallies. If the $0.50 support gives way, the XRP/USDT pair could plunge to $0.46.
El precio bajó desde la EMA de 20 días el 4 de febrero, lo que indica que el sentimiento sigue siendo negativo y los operadores están vendiendo en los repuntes. Si el soporte de $0,50 cede, el par XRP/USDT podría caer a $0,46.
Contrarily, if the price turns up from the current level and breaks above the 20-day EMA, it will suggest that the bulls are vigorously defending the $0.50 support. The positive divergence on the RSI also points toward a recovery in the near term. If buyers kick the price above the 20-day EMA, the pair may attempt a rally to the downtrend line.
Por el contrario, si el precio sube desde el nivel actual y supera la EMA de 20 días, sugerirá que los alcistas están defendiendo vigorosamente el soporte de 0,50 dólares. La divergencia positiva del RSI también apunta a una recuperación en el corto plazo. Si los compradores elevan el precio por encima de la EMA de 20 días, el par puede intentar subir hasta la línea de tendencia bajista.
Solana price analysis
Análisis de precios de Solana
Solana (SOL) is witnessing a tough battle between the bulls and the bears near the moving averages.
Solana (SOL) está presenciando una dura batalla entre alcistas y bajistas cerca de las medias móviles.
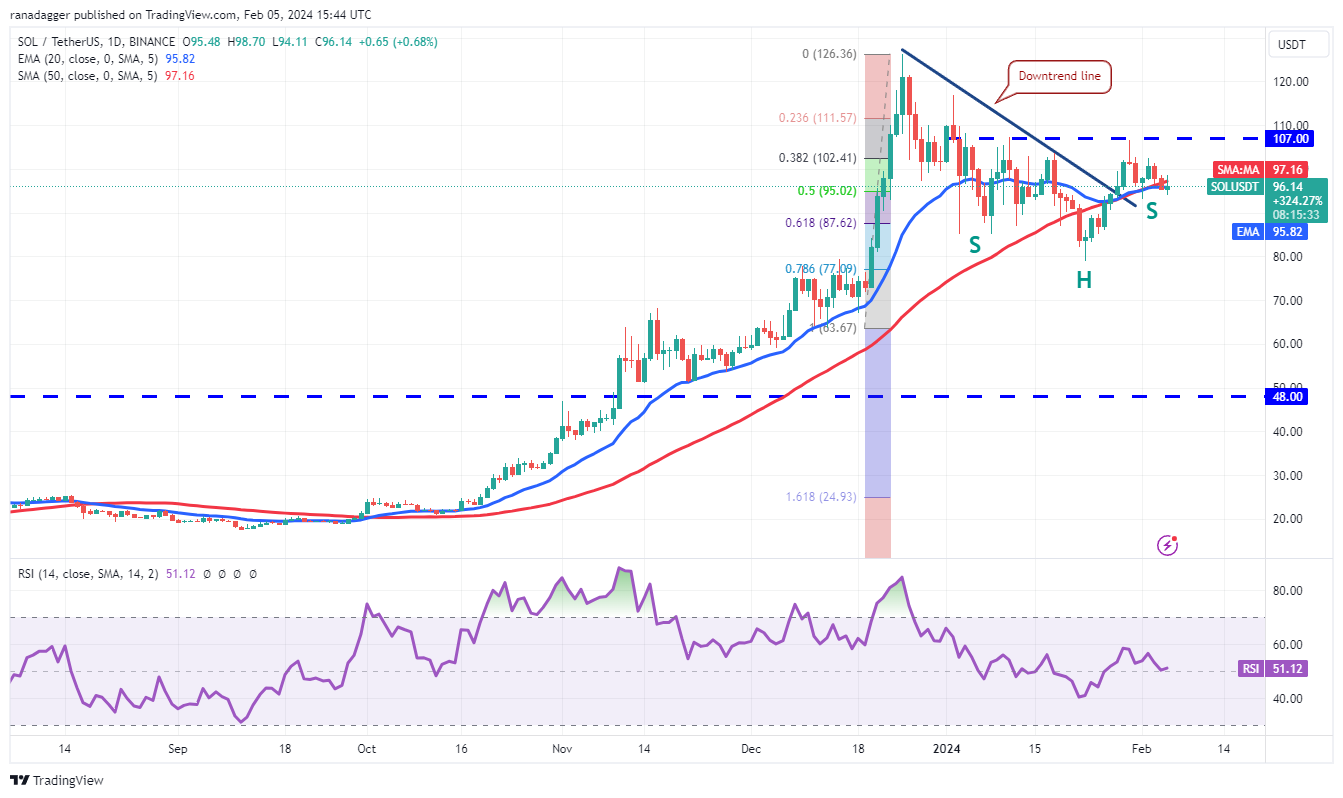
The price action of the past few days is forming an inverse H&S pattern, which will complete on a break and close above $107. This bullish setup has a target objective of $125. There is a minor resistance at $117, but it is likely to be crossed.
La acción del precio de los últimos días está formando un patrón de gráfico de cabeza y hombros inverso, que se completará con una ruptura y cerrará por encima de 107 dólares. Esta configuración alcista tiene un objetivo de 125 dólares. Hay una resistencia menor en 117 dólares, pero es probable que se supere.
Alternatively, if the price breaks and maintains below the moving averages, it will signal that the bulls have given up. The SOL/USDT pair may start a descent to $79, which is an important level for the bulls to guard, because if it cracks, the next stop may be $64.
Alternativamente, si el precio se rompe y se mantiene por debajo de las medias móviles, indicará que los alcistas se han rendido. El par SOL/USDT puede iniciar un descenso a $79, que es un nivel importante que deben proteger los alcistas, porque si se rompe, la próxima parada puede ser $64.
Related: BTC price sets new February high as Bitcoin buyers target faraway $25K
Relacionado: El precio de BTC establece un nuevo máximo en febrero, ya que los compradores de Bitcoin apuntan a los lejanos $ 25,000
Cardano price analysis
Análisis de precios de Cardano
Cardano (ADA) has been hovering near the 20-day EMA ($0.50) for the past few days, indicating indecision between the bulls and the bears.
Cardano (ADA) ha estado rondando cerca de la EMA de 20 días ($0,50) durante los últimos días, lo que indica indecisión entre los alcistas y los bajistas.
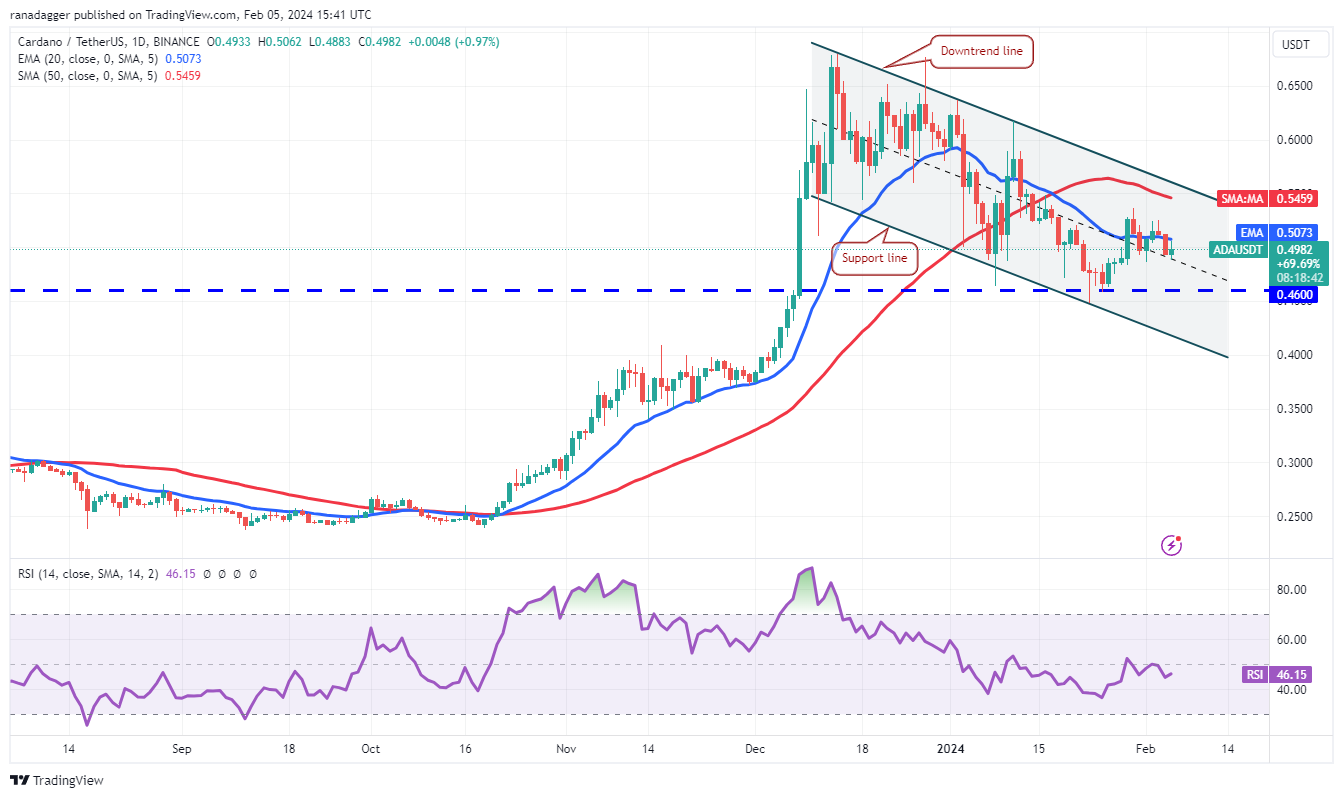
The 20-day EMA has flattened out, and the RSI is just below the midpoint, suggesting a range-bound action in the near term. If buyers drive the price above the 20-day EMA, the ADA/USDT pair could rise to the downtrend line. The bulls will have to overcome this obstacle to signal a potential trend change in the near term.
La EMA de 20 días se ha aplanado y el RSI está justo por debajo del punto medio, lo que sugiere una acción dentro del rango en el corto plazo. Si los compradores elevan el precio por encima de la EMA de 20 días, el par ADA/USDT podría subir hasta la línea de tendencia bajista. Los alcistas tendrán que superar este obstáculo para señalar un posible cambio de tendencia en el corto plazo.
On the downside, if the price breaks below $0.48, it will indicate that bears are trying to gain the upper hand. The pair may slide to $0.46 and later to the channel’s support line.
En el lado negativo, si el precio cae por debajo de $ 0,48, indicará que los bajistas están tratando de tomar ventaja. El par puede caer a USD 0,46 y luego a la línea de soporte del canal.
Avalanche price analysis
Análisis de precios de avalancha
Avalanche (AVAX) reversed direction from the downtrend line on Feb. 3, but a positive sign is that the bulls are attempting to defend the 20-day EMA ($34.55).
Avalanche (AVAX) cambió de dirección desde la línea de tendencia bajista el 3 de febrero, pero una señal positiva es que los alcistas están intentando defender la EMA de 20 días ($34,55).
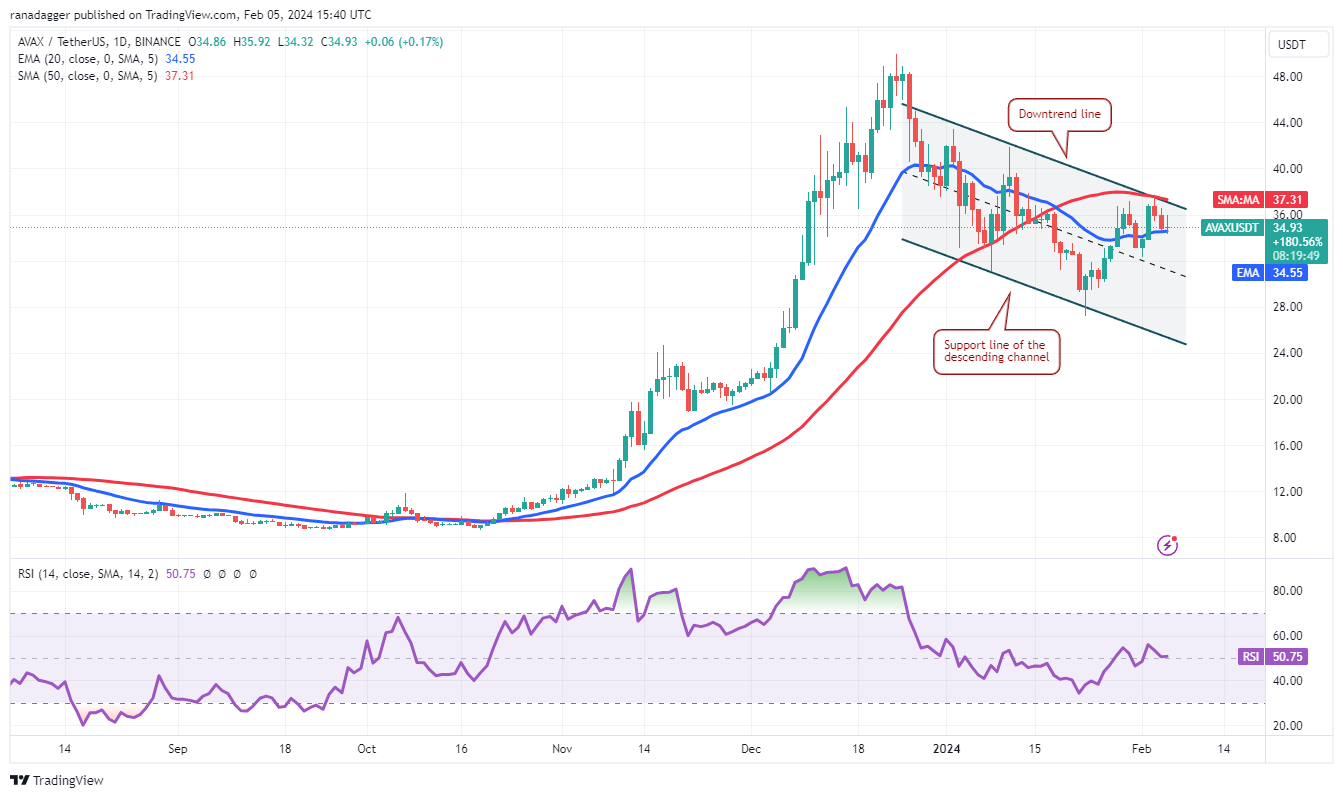
If the price turns up from the current level, it will increase the likelihood of a break above the descending channel. If that happens, the AVAX/USDT pair could climb to $44 and thereafter attempt a rally to the psychologically important level of $50.
Si el precio sube desde el nivel actual, aumentará la probabilidad de una ruptura por encima del canal descendente. Si eso sucede, el par AVAX/USDT podría subir a $44 y luego intentar un repunte hasta el nivel psicológicamente importante de $50.
If bears want to prevent the upward move, they will have to quickly yank the price below the immediate support at $32. If they do that, the pair could slump toward the channel’s support line near $24.
Si los bajistas quieren evitar el movimiento alcista, tendrán que bajar rápidamente el precio por debajo del soporte inmediato de 32 dólares. Si lo hacen, el par podría caer hacia la línea de soporte del canal cerca de $24.
Dogecoin price analysis
Análisis de precios de Dogecoin
Dogecoin (DOGE) continues to trade below the 20-day EMA ($0.08), but the bulls have not allowed the price to dip below the uptrend line of the symmetrical triangle pattern.
Dogecoin (DOGE) continúa cotizando por debajo de la EMA de 20 días ($0,08), pero los alcistas no han permitido que el precio caiga por debajo de la línea de tendencia alcista del patrón de triángulo simétrico.
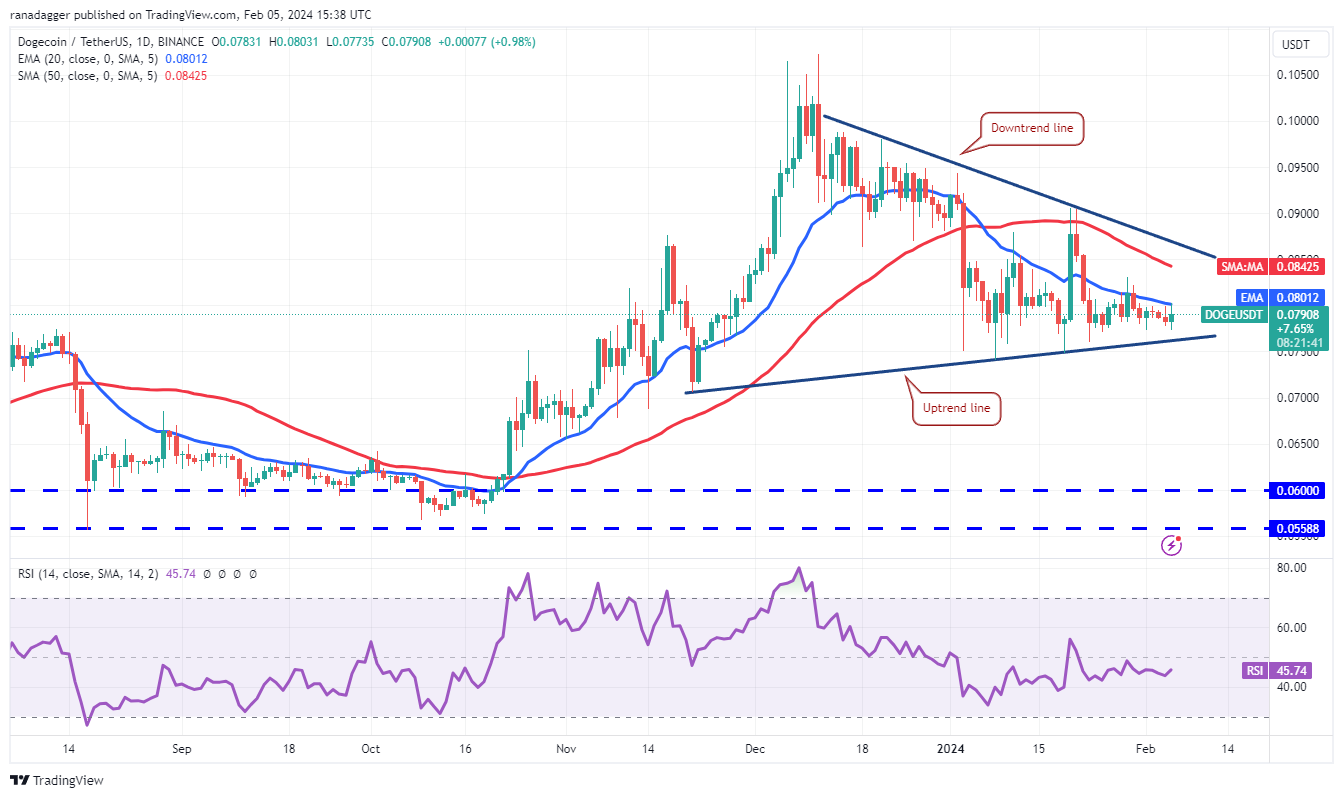
If the price turns up and breaks above the 20-day EMA, it will indicate that the DOGE/USDT pair may extend its stay inside the triangle for a few more days. The pair will try to rise to the downtrend line.
Si el precio sube y supera la EMA de 20 días, indicará que el par DOGE/USDT puede extender su permanencia dentro del triángulo por unos días más. El par intentará subir hasta la línea de tendencia bajista.
The next trending move is likely to begin on a break above or below the triangle. If the price surges above the triangle, the pair could travel to the $0.10 to $0.11 resistance zone. On the contrary, a break below the triangle will open the doors for a fall to $0.07 and then $0.06.
Es probable que el próximo movimiento de tendencia comience con una ruptura por encima o por debajo del triángulo. Si el precio sube por encima del triángulo, el par podría viajar a la zona de resistencia de $0,10 a $0,11. Por el contrario, una ruptura por debajo del triángulo abrirá las puertas a una caída a 0,07 dólares y luego a 0,06 dólares.
This article does not contain investment advice or recommendations. Every investment and trading move involves risk, and readers should conduct their own research when making a decision.
Este artículo no contiene consejos ni recomendaciones de inversión. Cada movimiento de inversión y comercio implica riesgos, y los lectores deben realizar su propia investigación al tomar una decisión.
 ETHNews
 CFN
CFN U_Today
 Thecoinrepublic.com
 DogeHome
 Optimisus
 Optimisus
 DeFi Planet
 Crypto Daily™


