

Stock markets in the United States continued their march higher last week, even after the Federal Reserve Chair Jerome Powell dashed hopes of a rate cut in March. However, Powell did say that a rate cut would likely happen this year. Powell reiterated these views during his interview with CBS news show 60 Minutes.
ジェローム・パウエル連邦準備制度理事会議長が3月の利下げへの期待を打ち砕いた後でも、米国の株式市場は先週も上昇を続けた。ただ、パウエル議長は年内利下げが行われる可能性が高いと述べた。パウエル氏はCBSのニュース番組「60ミニッツ」とのインタビューでこうした見解を繰り返し述べた。
Fed comments and strong macroeconomic data reduced expectations of rate cuts by the Fed to 120 basis points in 2024, down from 150 basis points at the end of last year, Fed funds futures showed. This pushed the U.S. dollar Index (DXY) to its highest level in 11 weeks.
フェデラルファンド先物によると、FRBのコメントと好調なマクロ経済指標により、FRBによる2024年の利下げ予想は昨年末の150ベーシスポイントから120ベーシスポイントに低下した。これを受けて米ドル指数(DXY)は11週間ぶりの高値水準に上昇した。
Historically, Bitcoin (BTC) moves in inverse correlation with the U.S. dollar. Hence the strength in the greenback could act as a headwind for Bitcoin in the near term. A minor positive in favor of the bulls is the strong inflows into BlackRock and Fidelity’s spot Bitcoin exchange-traded funds (ETFs) in January, totaling about $4.8 billion. Continued inflows into the ETFs could limit the downside.
歴史的に、ビットコイン (BTC) は米ドルと逆相関して動きます。したがって、ドル高は短期的にはビットコインにとって逆風となる可能性がある。強気派に有利なわずかなプラス材料は、1月にブラックロックとフィデリティのスポットビットコイン上場投資信託(ETF)への流入額が総額約48億ドルに達したことだ。 ETFへの流入が続けば、下値は限定される可能性がある。
Will Bitcoin remain stuck in a range, or is a breakout on the cards? How are the altcoins expected to behave? Let’s analyze the charts to find out.
ビットコインはレンジ内で膠着状態が続くのか、それともブレイクアウトの可能性があるのか?アルトコインはどのように動作すると予想されますか?チャートを分析して調べてみましょう。
S&P 500 Index price analysis
S&P 500 指数の価格分析
The S&P 500 Index rebounded off the 20-day exponential moving average (4,850) on Feb. 1 and soared to a new all-time high on Feb. 2.
S&P 500指数は2月1日に20日間指数移動平均(4,850)から反発し、2月2日には過去最高値を更新した。
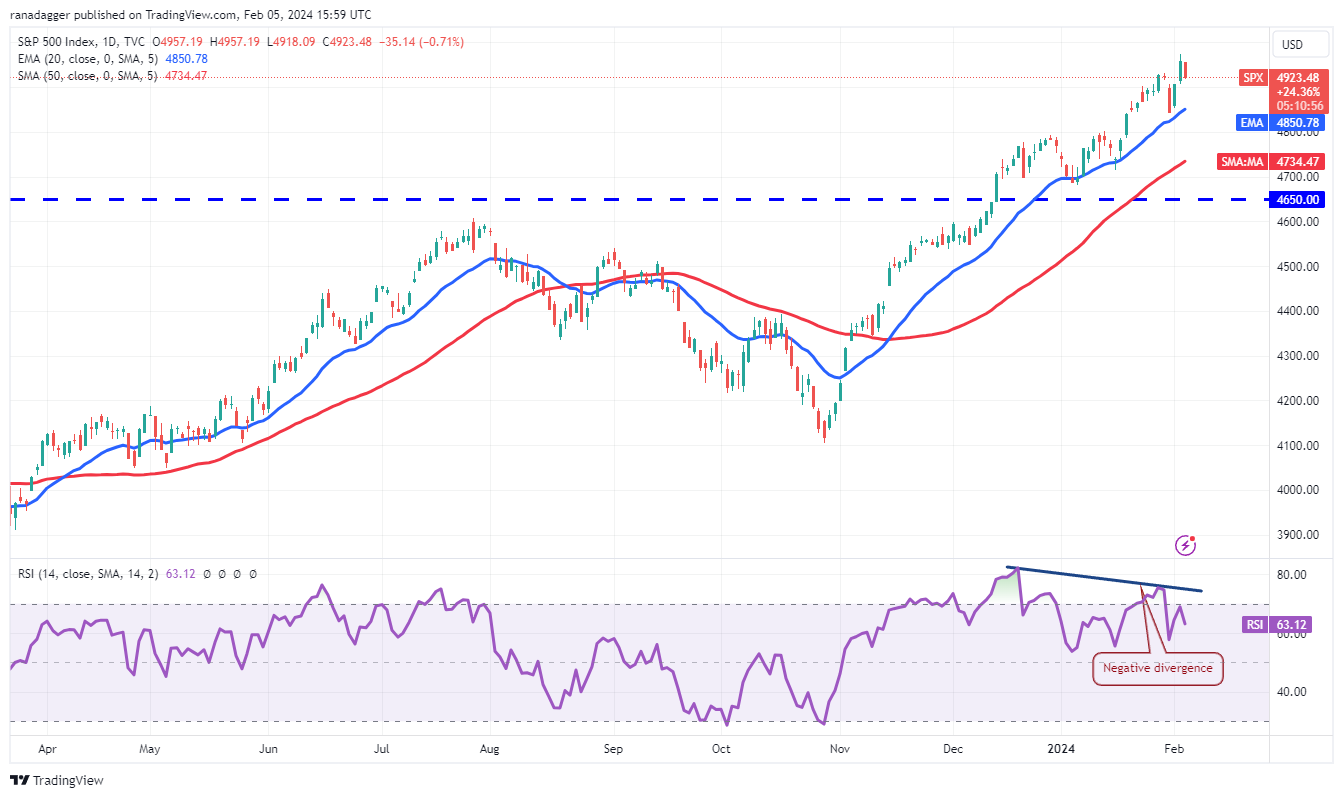
Both moving averages are sloping up, indicating that the bulls are in command, but the negative divergence on the relative strength index (RSI) warrants caution. The up move could face selling at the psychological resistance of 5,000, but if buyers bulldoze their way through, the next stop could be 5,200.
両方の移動平均は右肩上がりで、強気派が主導権を握っていることを示していますが、相対力指数(RSI)のマイナスの乖離には注意が必要です。上昇相場は5,000の心理的抵抗で売りに直面する可能性があるが、買い手が強気で押し切った場合、次のストップは5,200になる可能性がある。
The crucial support on the downside is the 20-day EMA. A slide below this level will be the first indication that the bulls are rushing to the exit. That may start a fall to the 50-day simple moving average (4,734) and then to 4,650.
下値の重要なサポートは 20 日間 EMA です。このレベルを下回ると、強気派が出口に向かって急いでいることを示す最初の兆候となる。そうなると、50日単純移動平均(4,734)まで下落し始め、その後4,650まで下落する可能性がある。
U.S. dollar Index price analysis
米ドルインデックス価格分析
The U.S. dollar Index snapped back sharply from the 50-day SMA (102.84) on Feb. 2 and broke above the neckline of the inverted head-and-shoulders pattern.
米ドル指数は2月2日の50日間SMA(102.84)から急反発し、逆ヘッド・アンド・ショルダー・パターンのネックラインを上抜けた。
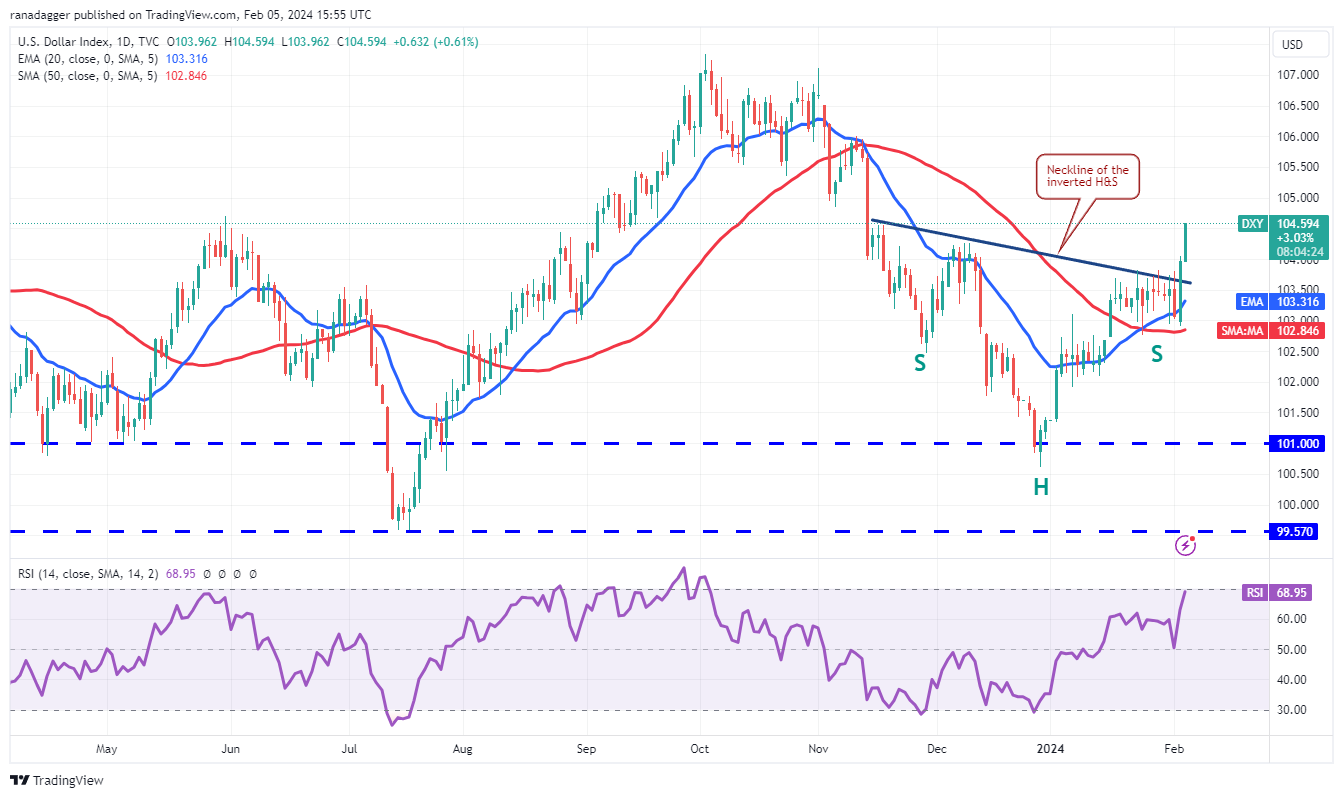
The pattern target of the bullish setup is 107.39, just below the formidable overhead resistance at 108. However, the bears are unlikely to give up easily. They will try to halt the up move near 104.55 and again at 106.
強気セットアップのパターン目標は 107.39 で、108 という手ごわい頭上の抵抗線のすぐ下にあります。しかし、弱気派が簡単に諦める可能性は低いです。彼らは104.55付近で上昇を止め、再び106で止めようとするだろう。
If bears want to make a comeback, they will have to tug the price below the 50-day SMA to seize control. The index may decline to the vital support zone between 101 and 99.57. The bulls are expected to defend this zone with all their might.
弱気派が巻き返しを望むなら、主導権を握るために価格を50日間SMA以下に引き下げる必要があるだろう。同指数は101~99.57の重要なサポートゾーンまで下落する可能性がある。雄牛たちはこのゾーンを全力で守ることが期待される。
Bitcoin price analysis
ビットコイン価格分析
The bears have failed to sink Bitcoin below the 20-day EMA ($42,463) even after repeated attempts, suggesting that the bulls are fiercely defending the level.
弱気派は何度も試みたにもかかわらず、ビットコインを20日間EMA(4万2463ドル)以下に下げることができず、強気派がその水準を激しく守っていることを示唆している。
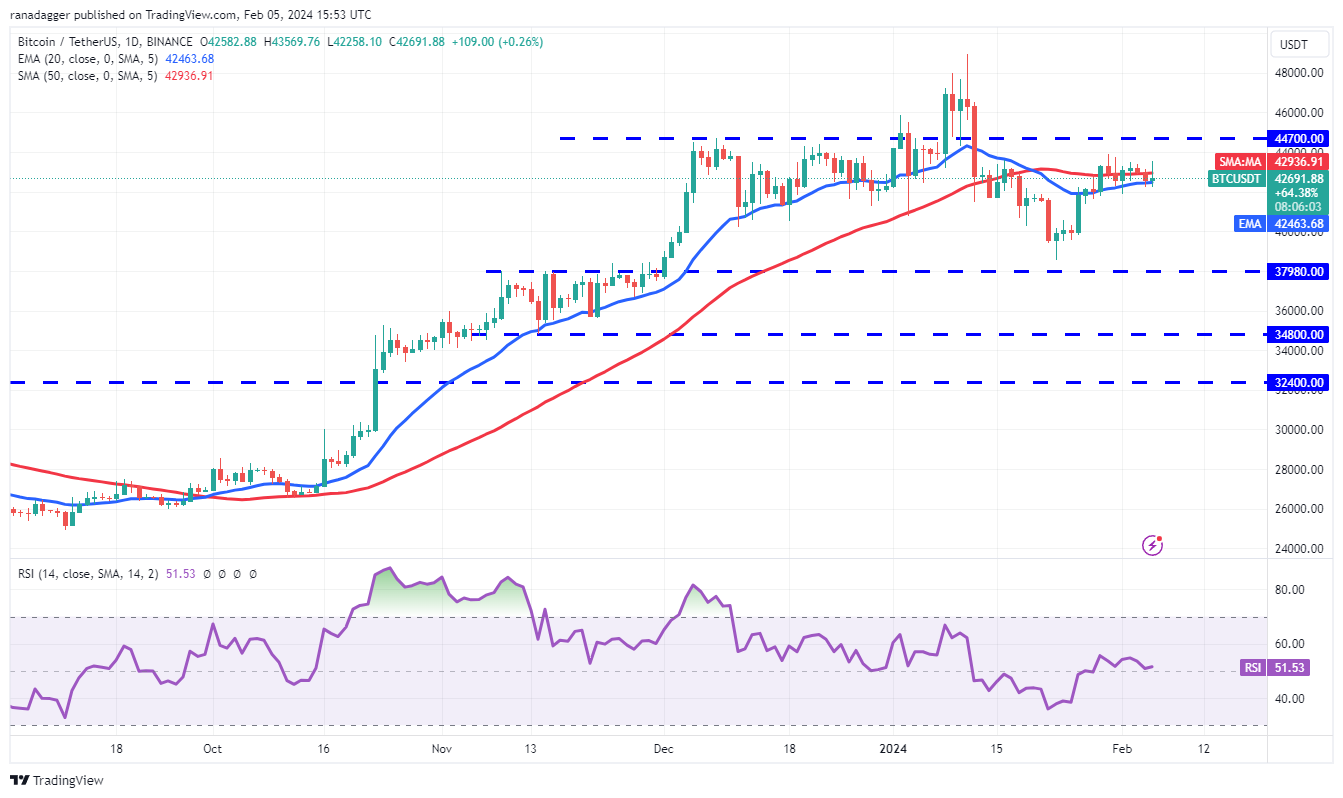
Buyers will try to push the price to the $44,000 to $44,700 overhead resistance zone. This remains the key zone for the bears to defend because if they fail in their endeavor, the BTC/USDT pair could skyrocket to the psychological level of $50,000.
買い手は価格を44,000ドルから44,700ドルの直上抵抗ゾーンに押し上げようとするだろう。弱気派がその試みに失敗すれば、BTC/USDTペアが心理的レベルの5万ドルまで急騰する可能性があるため、ここは依然として弱気派が守るべき重要なゾーンである。
On the other hand, if the price turns down from $44,700, the pair may consolidate in a tight range for a while. The bears will be on top if they sink the pair below $41,394. The pair may then slide to $40,000 and eventually to $37,980.
一方、価格が44,700ドルから下落に転じた場合、しばらくは狭いレンジ内での値固めが続く可能性がある。弱気派が41,394ドルを下回れば首位に立つことになる。その後、ペアは40,000ドルまで下落し、最終的には37,980ドルまで下落する可能性があります。
Ether price analysis
イーサ価格分析
Ether (ETH) has been trading below the moving averages for several days, but the bears have failed to pull the price to the strong support at $2,100. This suggests buying at lower levels.
イーサ(ETH)はここ数日間、移動平均を下回って取引されているが、弱気派は価格を2,100ドルの強力なサポートまで引き上げることができていない。これは、より低いレベルでの購入を示唆しています。
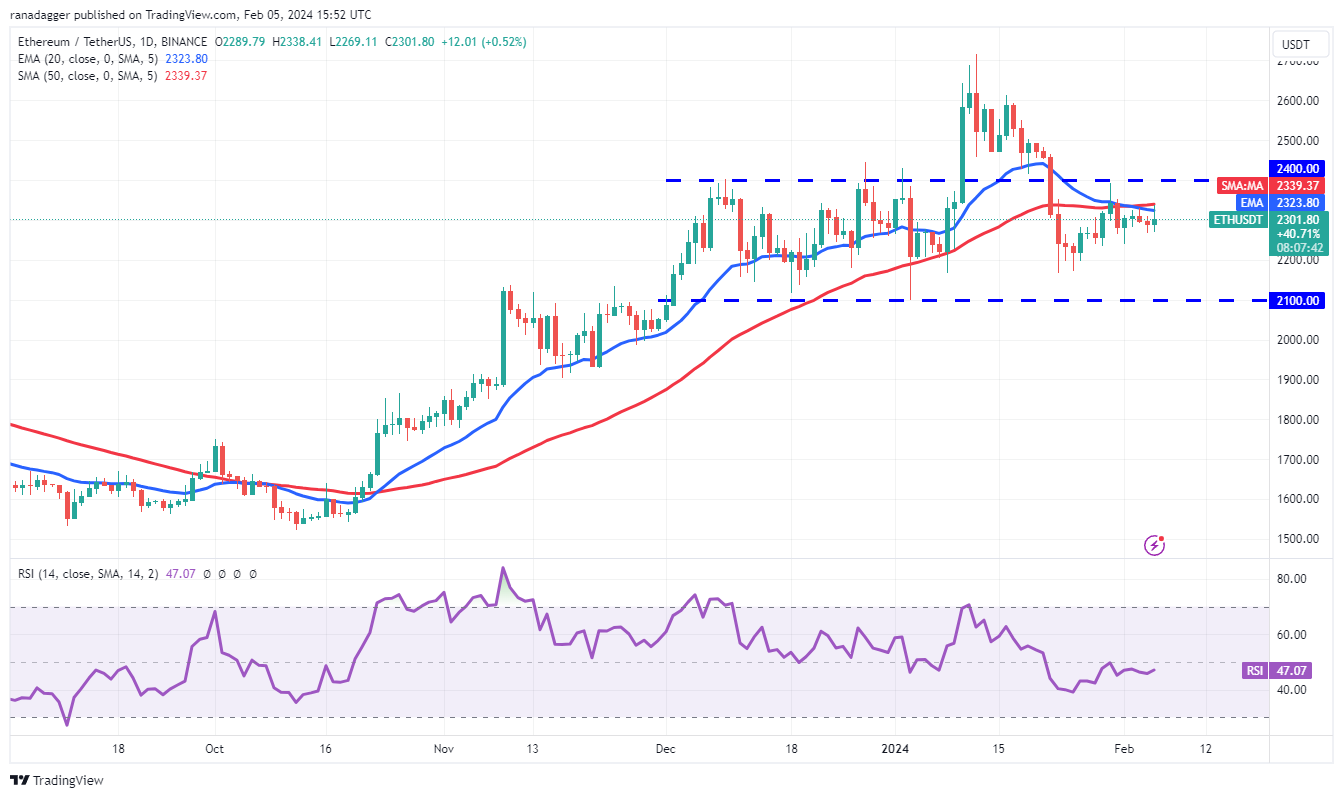
The bulls are trying to push the price above the moving averages. If they do that, the ETH/USDT pair could challenge the $2,400 level. A break and close above this resistance will indicate that bulls have overpowered the bears. The pair may rise to $2,600 and then to the Jan. 12 intraday high of $2,717.
強気派は価格を移動平均線より上に押し上げようとしている。そうなれば、ETH/USDTペアは2,400ドルの水準に挑戦する可能性がある。このレジスタンスを上抜けて終値を迎えると、強気派が弱気派を圧倒したことを示すことになる。このペアは2,600ドルまで上昇し、その後1月12日の日中高値である2,717ドルまで上昇する可能性がある。
Conversely, if the price turns down from the overhead resistance, it will signal that the bears are active at higher levels. That may keep the pair stuck inside the $2,100 to $2,400 range for some more time.
逆に、価格が頭上の抵抗線から下落した場合、それは弱気派がより高いレベルで活動していることを示します。これにより、ペアはしばらく2,100ドルから2,400ドルの範囲内にとどまる可能性があります。
BNB price analysis
BNB価格分析
BNB (BNB) bounced off the 50-day SMA ($300) on Feb. 4, but the bulls are struggling to build upon the strength.
BNB(BNB)は2月4日に50日間SMA(300ドル)から反発したが、強気派はその強さを築くのに苦労している。
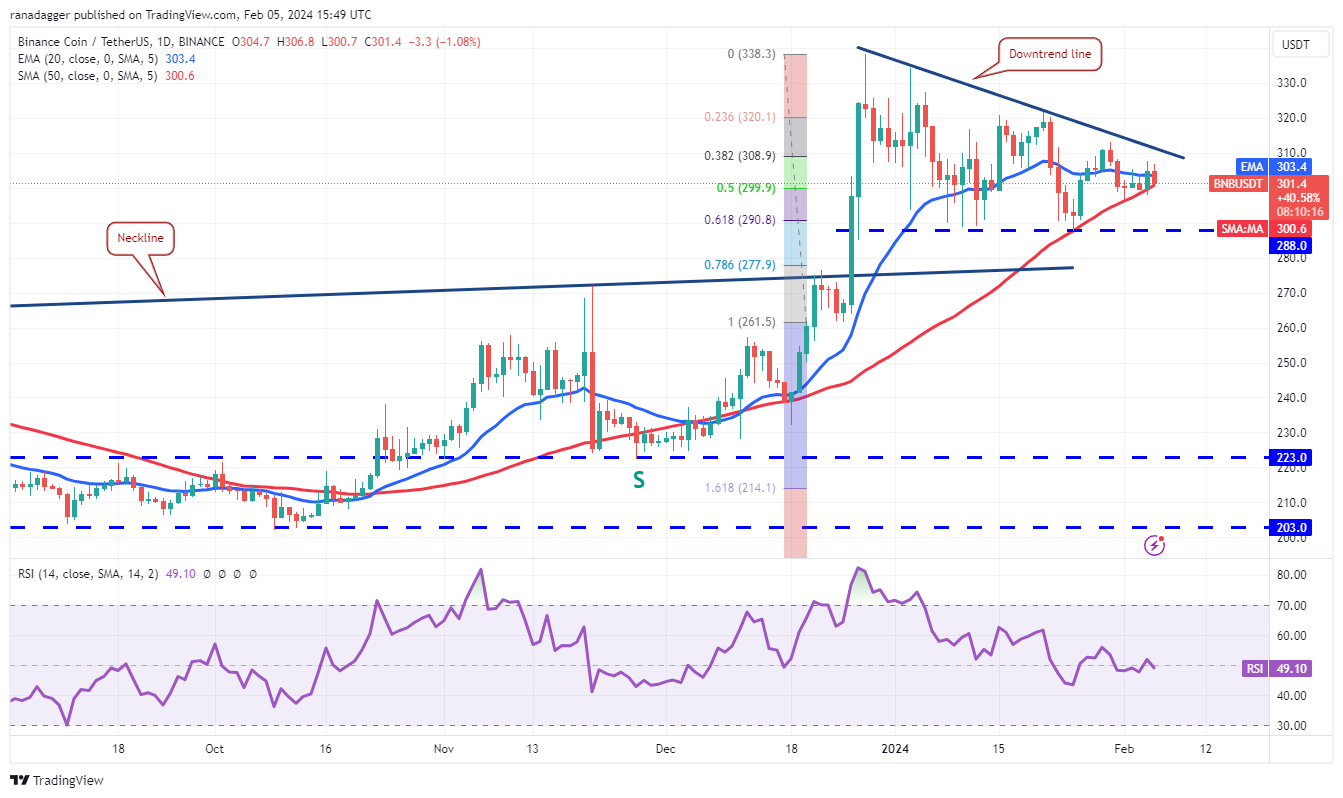
Buyers will have to clear the overhead hurdle at the downtrend line to invalidate the descending triangle pattern. If they succeed, the BNB/USDT pair could rally to $320 and subsequently to $338.
買い手は下降三角パターンを無効にするために、下降トレンドラインのオーバーヘッドハードルをクリアする必要があります。それが成功すれば、BNB/USDTペアは320ドルまで上昇し、その後338ドルまで上昇する可能性がある。
Contrary to this assumption, if the price turns down and breaks below the 50-day SMA, it will indicate that the bears continue to sell on minor rallies. The pair may then drop to the strong support at $288. If this level crumbles, the pair will complete the bearish setup, which could start a down move to $260.
この想定に反して、価格が下落して50日間SMAを下回った場合、弱気派が小規模な反発で売りを継続していることを示すことになる。その後、ペアは288ドルの強力なサポートに下落する可能性があります。このレベルが崩れると、ペアは弱気のセットアップを完了し、260ドルまで下落し始める可能性があります。
XRP price analysis
XRP価格分析
The bears could not maintain XRP (XRP) below $0.50 on Jan. 31 and Feb. 1, which started a recovery to the 20-day EMA ($0.53) on Feb. 3.
弱気派は1月31日と2月1日にXRP(XRP)を0.50ドル以下に維持できず、2月3日に20日間EMA(0.53ドル)まで回復を始めた。
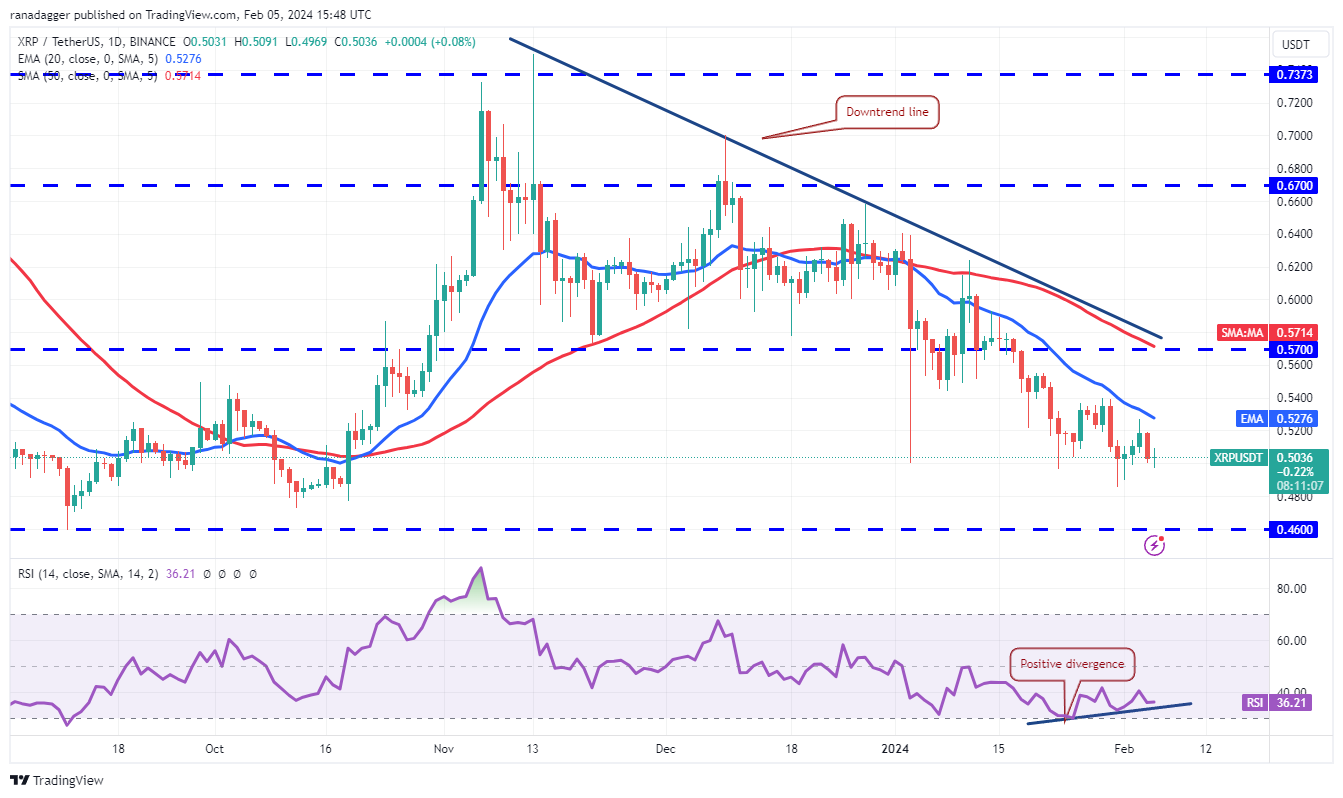
The price turned down from the 20-day EMA on Feb. 4, indicating that the sentiment remains negative and traders are selling on rallies. If the $0.50 support gives way, the XRP/USDT pair could plunge to $0.46.
価格は2月4日の20日間EMAから下落し、センチメントが依然としてネガティブであり、トレーダーが反発で売りを出していることを示している。 0.50ドルのサポートが崩れた場合、XRP/USDTペアは0.46ドルまで急落する可能性がある。
Contrarily, if the price turns up from the current level and breaks above the 20-day EMA, it will suggest that the bulls are vigorously defending the $0.50 support. The positive divergence on the RSI also points toward a recovery in the near term. If buyers kick the price above the 20-day EMA, the pair may attempt a rally to the downtrend line.
逆に、価格が現在のレベルから上昇し、20日間EMAを上回った場合、強気派が0.50ドルのサポートを精力的に守っていることを示唆するでしょう。 RSI のプラスの乖離も、短期的な回復を示しています。買い手が価格を20日間EMAを上回った場合、ペアは下降トレンドラインへの上昇を試みる可能性があります。
Solana price analysis
ソラナの価格分析
Solana (SOL) is witnessing a tough battle between the bulls and the bears near the moving averages.
ソラナ (SOL) は、移動平均付近で強気派と弱気派の間の厳しい戦いを目の当たりにしています。
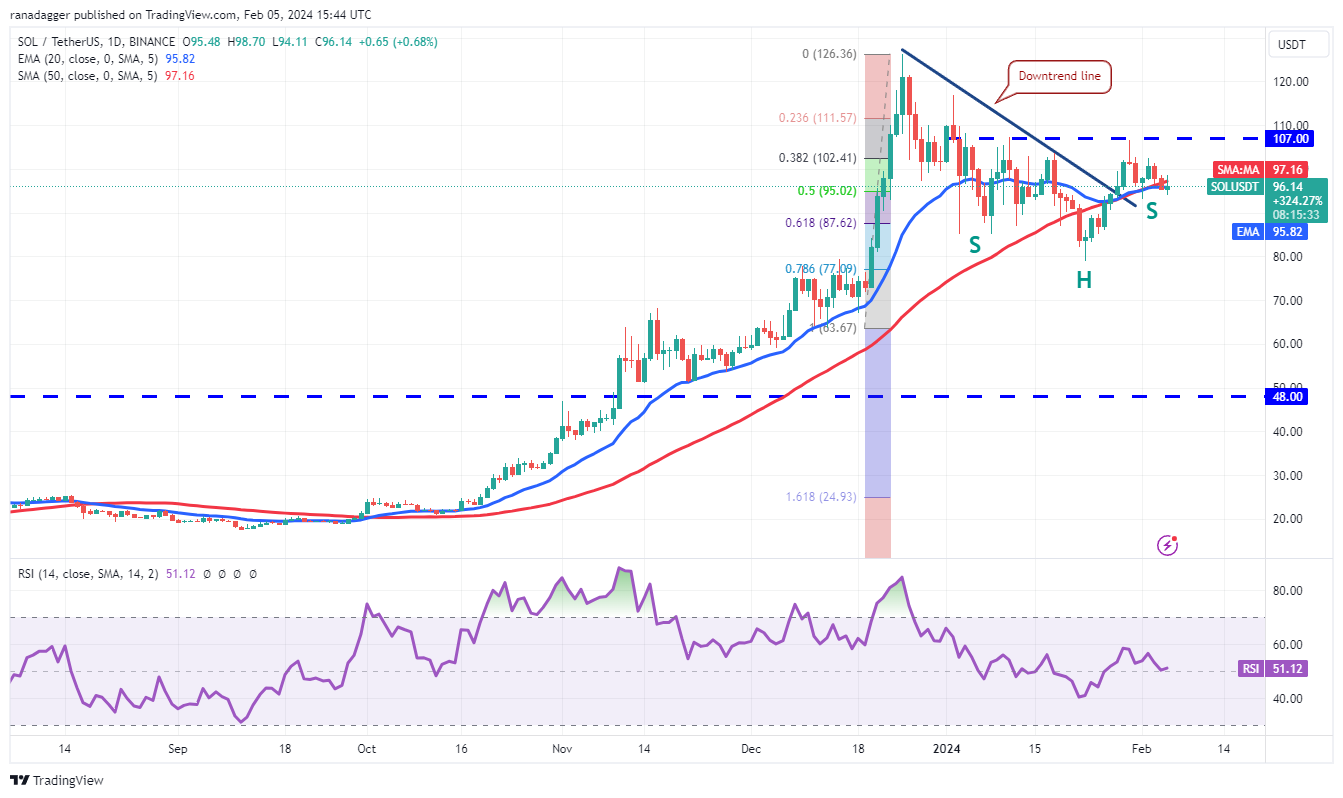
The price action of the past few days is forming an inverse H&S pattern, which will complete on a break and close above $107. This bullish setup has a target objective of $125. There is a minor resistance at $117, but it is likely to be crossed.
過去数日間の価格動向は逆H&Sパターンを形成しており、ブレイクで完了し、107ドルを超えて終了することになる。この強気の設定の目標目標は 125 ドルです。 117ドルに小さな抵抗があるが、それを超える可能性は高い。
Alternatively, if the price breaks and maintains below the moving averages, it will signal that the bulls have given up. The SOL/USDT pair may start a descent to $79, which is an important level for the bulls to guard, because if it cracks, the next stop may be $64.
あるいは、価格が移動平均線を下回って維持した場合、強気派が諦めたことを示すことになります。 SOL/USDTペアは79ドルまで下落を開始する可能性があるが、これが割れた場合、次のストップは64ドルになる可能性があるため、強気派にとっては警戒すべき重要なレベルである。
Related: BTC price sets new February high as Bitcoin buyers target faraway $25K
関連:ビットコイン購入者が2万5千ドルを目標にしているため、BTC価格は2月の新高値を更新
Cardano price analysis
カルダノの価格分析
Cardano (ADA) has been hovering near the 20-day EMA ($0.50) for the past few days, indicating indecision between the bulls and the bears.
カルダノ(ADA)はここ数日間、20日間EMA(0.50ドル)付近で推移しており、強気派と弱気派の間で優柔不断な姿勢が示されている。
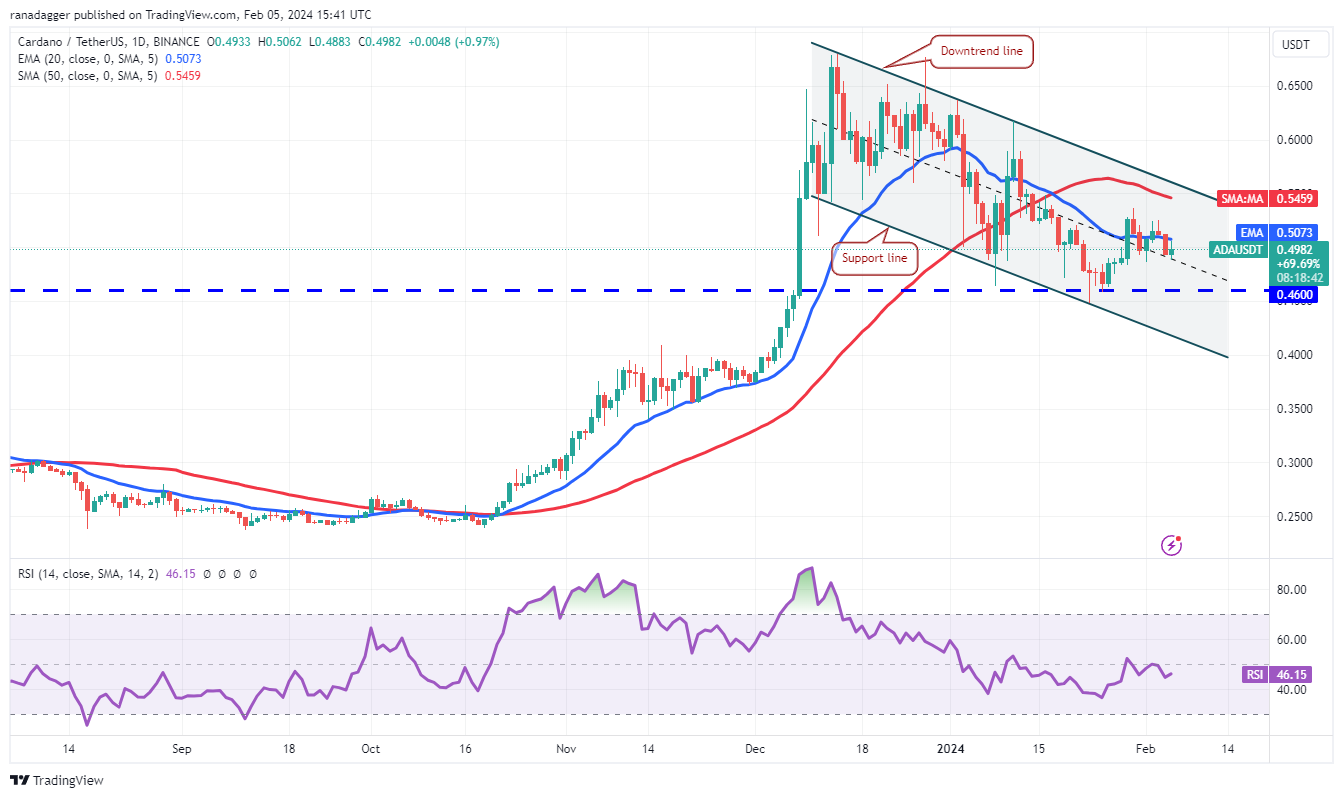
The 20-day EMA has flattened out, and the RSI is just below the midpoint, suggesting a range-bound action in the near term. If buyers drive the price above the 20-day EMA, the ADA/USDT pair could rise to the downtrend line. The bulls will have to overcome this obstacle to signal a potential trend change in the near term.
20 日間 EMA は横ばいとなり、RSI は中間点のすぐ下にあり、短期的にはレンジ内での動きとなることを示唆しています。買い手が価格を20日間EMAを上回った場合、ADA/USDTペアは下降トレンドラインまで上昇する可能性があります。強気派は短期的にトレンドの変化の可能性を示すために、この障害を克服する必要があるだろう。
On the downside, if the price breaks below $0.48, it will indicate that bears are trying to gain the upper hand. The pair may slide to $0.46 and later to the channel’s support line.
下値としては、価格が0.48ドルを下回った場合、弱気派が優位に立とうとしていることを示すことになる。このペアは0.46ドルまで下落し、その後はチャネルのサポートラインまで下落する可能性がある。
Avalanche price analysis
雪崩価格分析
Avalanche (AVAX) reversed direction from the downtrend line on Feb. 3, but a positive sign is that the bulls are attempting to defend the 20-day EMA ($34.55).
アバランチ(AVAX)は2月3日に下降トレンドラインから方向を転換したが、強気派が20日間EMA(34.55ドル)を守ろうとしていることは明るい兆候だ。
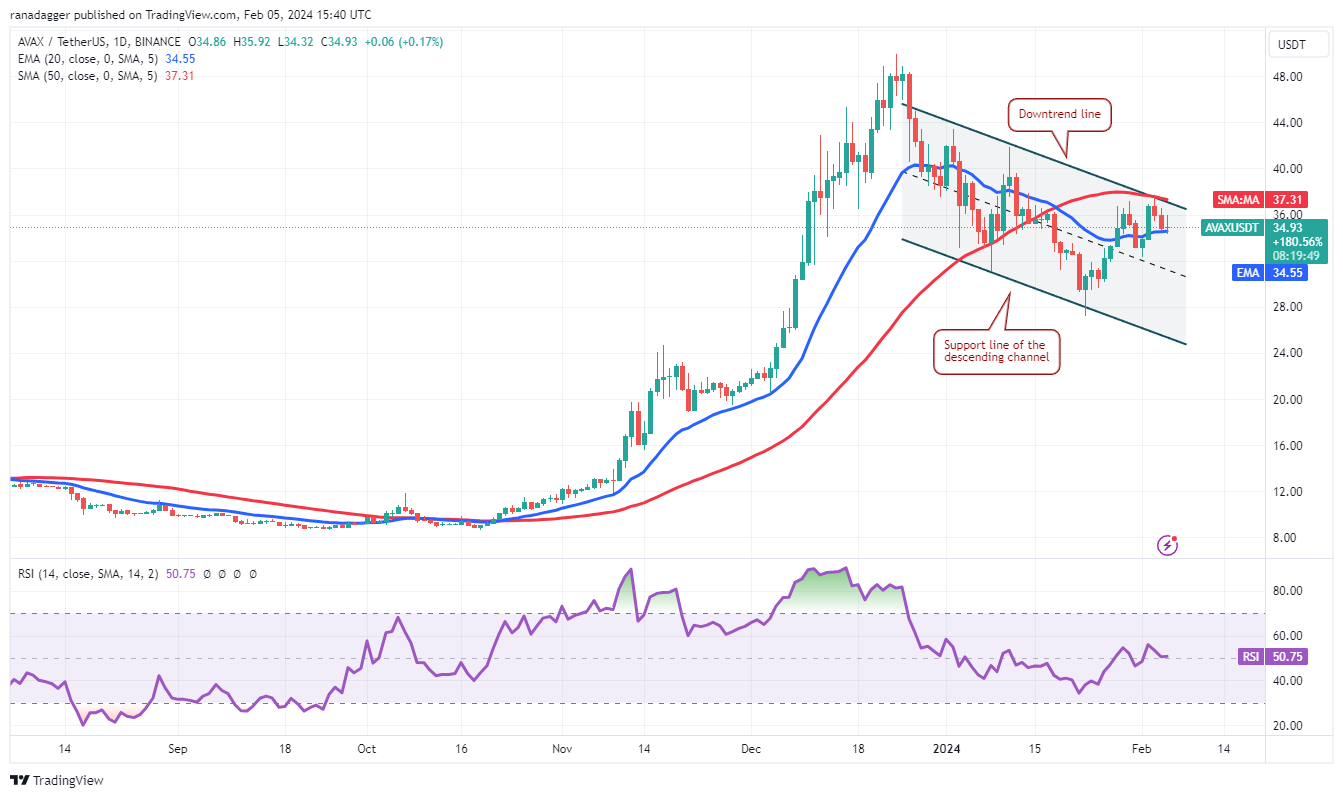
If the price turns up from the current level, it will increase the likelihood of a break above the descending channel. If that happens, the AVAX/USDT pair could climb to $44 and thereafter attempt a rally to the psychologically important level of $50.
価格が現在のレベルから上昇した場合、下降チャネルを上抜ける可能性が高まります。そうなれば、AVAX/USDTペアは44ドルまで上昇し、その後心理的に重要なレベルである50ドルへの上昇を試みる可能性がある。
If bears want to prevent the upward move, they will have to quickly yank the price below the immediate support at $32. If they do that, the pair could slump toward the channel’s support line near $24.
弱気派が上昇を阻止したい場合は、すぐに価格を当面のサポートである32ドル以下に引き下げる必要があるだろう。そうなれば、ペアは24ドル付近のチャネルのサポートラインに向けて下落する可能性がある。
Dogecoin price analysis
ドージコインの価格分析
Dogecoin (DOGE) continues to trade below the 20-day EMA ($0.08), but the bulls have not allowed the price to dip below the uptrend line of the symmetrical triangle pattern.
ドージコイン(DOGE)は引き続き20日間EMA(0.08ドル)を下回って取引されているが、強気派は価格が対称的な三角形パターンの上昇トレンドラインを下回ることを許可していない。
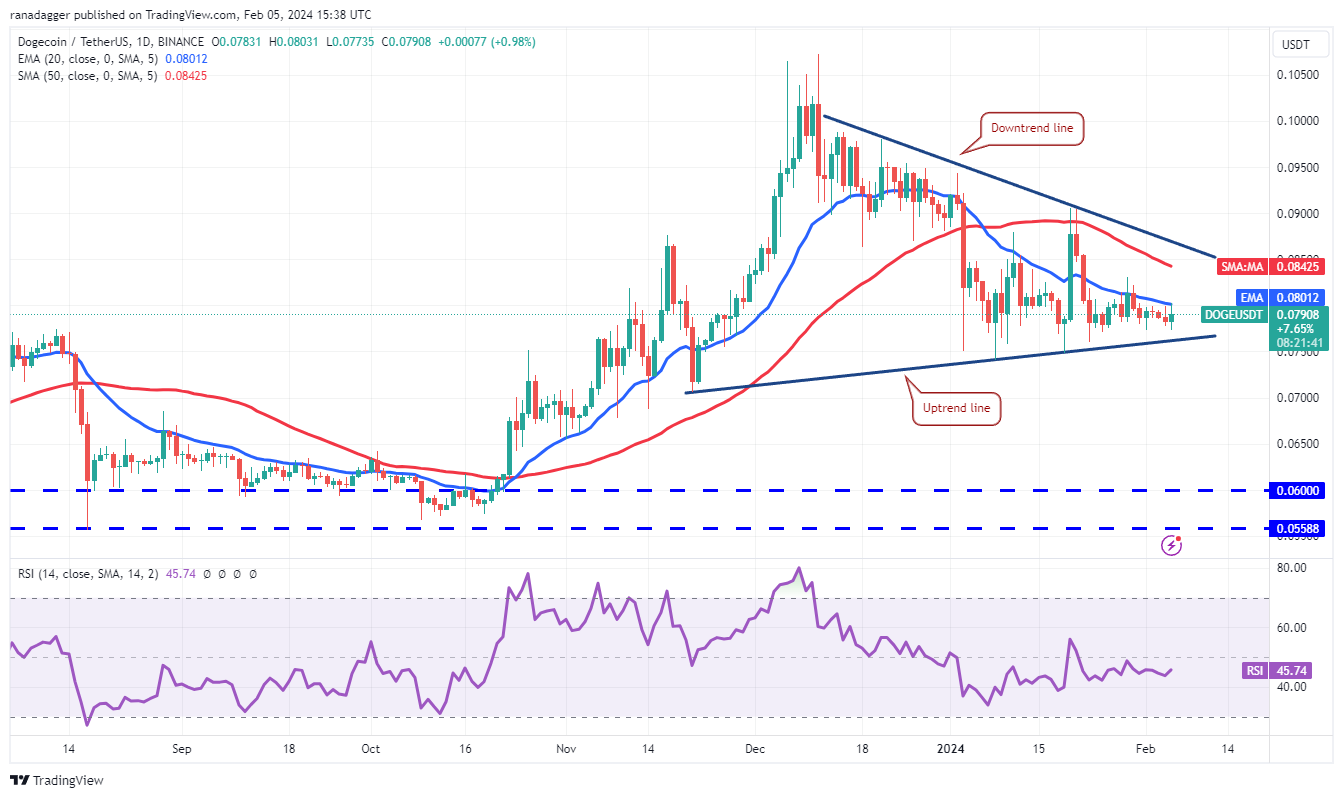
If the price turns up and breaks above the 20-day EMA, it will indicate that the DOGE/USDT pair may extend its stay inside the triangle for a few more days. The pair will try to rise to the downtrend line.
価格が上昇し、20日間EMAを上抜けた場合、DOGE/USDTペアがトライアングル内での滞在をさらに数日間延長する可能性があることを示します。このペアは下降トレンドラインまで上昇しようとします。
The next trending move is likely to begin on a break above or below the triangle. If the price surges above the triangle, the pair could travel to the $0.10 to $0.11 resistance zone. On the contrary, a break below the triangle will open the doors for a fall to $0.07 and then $0.06.
次のトレンドの動きは、トライアングルの上または下のブレイクで始まる可能性があります。価格がトライアングルを超えて急騰した場合、ペアは0.10ドルから0.11ドルのレジスタンスゾーンに移動する可能性があります。逆に、トライアングルを下抜けた場合は、0.07 ドル、さらに 0.06 ドルへの下落の扉が開きます。
This article does not contain investment advice or recommendations. Every investment and trading move involves risk, and readers should conduct their own research when making a decision.
この記事には投資に関するアドバイスや推奨事項は含まれません。あらゆる投資や取引の動きにはリスクが伴うため、読者は決定を下す際に独自の調査を行う必要があります。
 Cryptopolitan
 DogeHome
 crypto.ro English
 Crypto News Land
 ETHNews
 CFN
CFN U_Today
 Thecoinrepublic.com


