

Stock markets in the United States continued their march higher last week, even after the Federal Reserve Chair Jerome Powell dashed hopes of a rate cut in March. However, Powell did say that a rate cut would likely happen this year. Powell reiterated these views during his interview with CBS news show 60 Minutes.
尽管美联储主席杰罗姆·鲍威尔(Jerome Powell)在三月份降息的希望破灭后,美国股市上周仍继续走高。不过,鲍威尔确实表示今年可能会降息。鲍威尔在接受哥伦比亚广播公司新闻节目《60 分钟》采访时重申了这些观点。
Fed comments and strong macroeconomic data reduced expectations of rate cuts by the Fed to 120 basis points in 2024, down from 150 basis points at the end of last year, Fed funds futures showed. This pushed the U.S. dollar Index (DXY) to its highest level in 11 weeks.
联邦基金期货显示,美联储言论和强劲的宏观经济数据将美联储2024年降息预期从去年年底的150个基点下调至120个基点。这推动美元指数(DXY)升至11周以来的最高水平。
Historically, Bitcoin (BTC) moves in inverse correlation with the U.S. dollar. Hence the strength in the greenback could act as a headwind for Bitcoin in the near term. A minor positive in favor of the bulls is the strong inflows into BlackRock and Fidelity’s spot Bitcoin exchange-traded funds (ETFs) in January, totaling about $4.8 billion. Continued inflows into the ETFs could limit the downside.
从历史上看,比特币(BTC)的走势与美元呈负相关。因此,美元的走强可能会在短期内成为比特币的阻力。有利于多头的一个小利好是 1 月份大量资金流入贝莱德和富达的现货比特币交易所交易基金 (ETF),总计约 48 亿美元。持续流入 ETF 可能会限制下跌空间。
Will Bitcoin remain stuck in a range, or is a breakout on the cards? How are the altcoins expected to behave? Let’s analyze the charts to find out.
比特币会继续停留在区间内,还是有望突破?山寨币的预期表现如何?让我们分析一下图表来找出答案。
S&P 500 Index price analysis
标准普尔 500 指数价格分析
The S&P 500 Index rebounded off the 20-day exponential moving average (4,850) on Feb. 1 and soared to a new all-time high on Feb. 2.
标准普尔 500 指数于 2 月 1 日从 20 日指数移动平均线(4,850 点)反弹,并于 2 月 2 日飙升至历史新高。
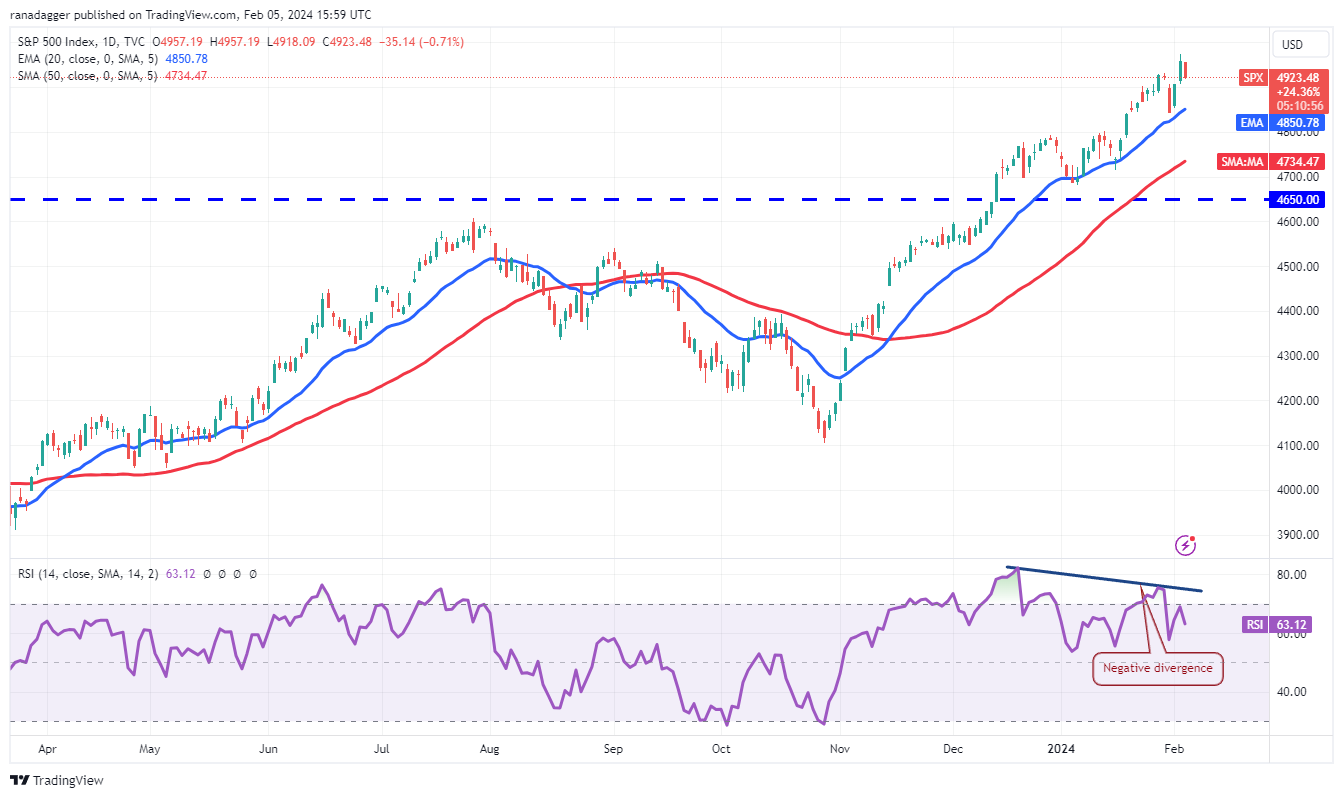
Both moving averages are sloping up, indicating that the bulls are in command, but the negative divergence on the relative strength index (RSI) warrants caution. The up move could face selling at the psychological resistance of 5,000, but if buyers bulldoze their way through, the next stop could be 5,200.
两条移动平均线均向上倾斜,表明多头处于主导地位,但相对强弱指数(RSI)的负背离值得谨慎对待。上涨可能面临 5,000 点心理阻力位的抛售,但如果买家强行突破,下一站可能是 5,200 点。
The crucial support on the downside is the 20-day EMA. A slide below this level will be the first indication that the bulls are rushing to the exit. That may start a fall to the 50-day simple moving average (4,734) and then to 4,650.
下行的关键支撑是20日均线。跌破该水平将是多头急于退出的第一个迹象。这可能会开始下跌至 50 日简单移动平均线 (4,734),然后跌至 4,650。
U.S. dollar Index price analysis
美元指数价格分析
The U.S. dollar Index snapped back sharply from the 50-day SMA (102.84) on Feb. 2 and broke above the neckline of the inverted head-and-shoulders pattern.
2月2日,美元指数从50日移动平均线(102.84)大幅反弹,并突破头肩底形态的颈线。
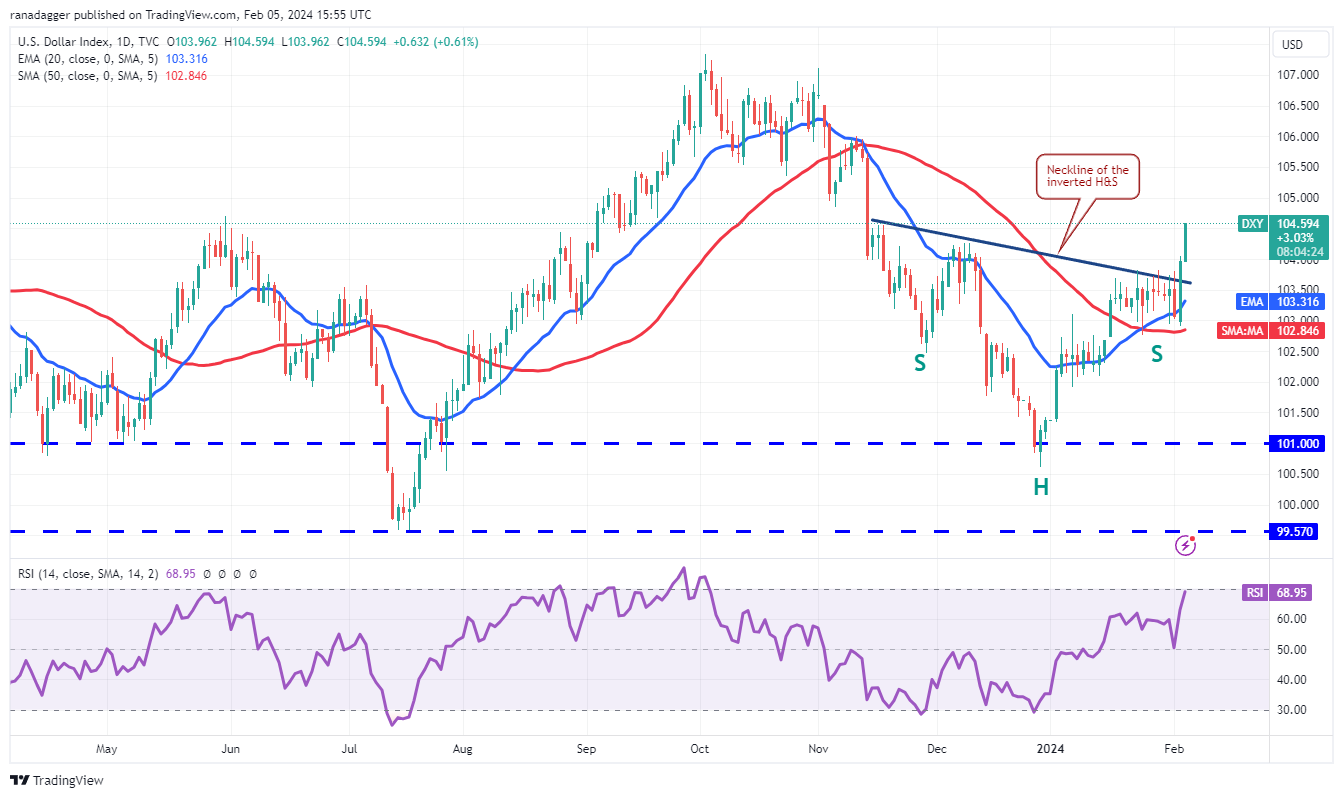
The pattern target of the bullish setup is 107.39, just below the formidable overhead resistance at 108. However, the bears are unlikely to give up easily. They will try to halt the up move near 104.55 and again at 106.
看涨格局的目标是107.39,略低于强大的上方阻力位108。然而,空头不太可能轻易放弃。他们将尝试在 104.55 附近停止上涨,并在 106 附近再次停止。
If bears want to make a comeback, they will have to tug the price below the 50-day SMA to seize control. The index may decline to the vital support zone between 101 and 99.57. The bulls are expected to defend this zone with all their might.
如果空头想要卷土重来,他们将不得不将价格拉低至 50 日移动平均线下方以夺取控制权。该指数可能会跌至101至99.57之间的重要支撑区域。预计多头将竭尽全力保卫该区域。
Bitcoin price analysis
比特币价格分析
The bears have failed to sink Bitcoin below the 20-day EMA ($42,463) even after repeated attempts, suggesting that the bulls are fiercely defending the level.
即使经过多次尝试,空头也未能将比特币跌破 20 日均线(42,463 美元),这表明多头正在激烈捍卫该水平。
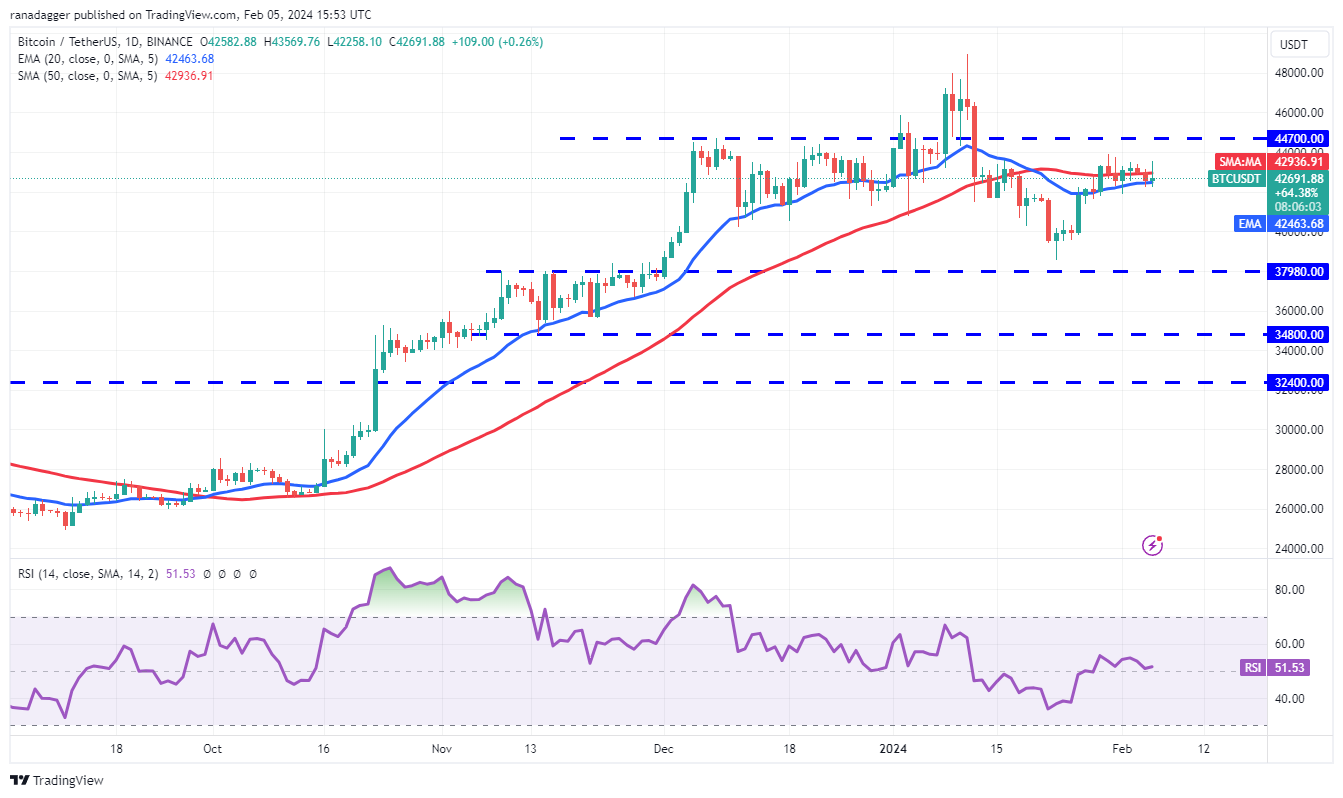
Buyers will try to push the price to the $44,000 to $44,700 overhead resistance zone. This remains the key zone for the bears to defend because if they fail in their endeavor, the BTC/USDT pair could skyrocket to the psychological level of $50,000.
买家将试图将价格推至 44,000 美元至 44,700 美元的上方阻力区。这仍然是空头防守的关键区域,因为如果他们的努力失败,BTC/USDT 货币对可能会飙升至 50,000 美元的心理水平。
On the other hand, if the price turns down from $44,700, the pair may consolidate in a tight range for a while. The bears will be on top if they sink the pair below $41,394. The pair may then slide to $40,000 and eventually to $37,980.
另一方面,如果价格从 44,700 美元下跌,该货币对可能会在一段时间内窄幅盘整。如果空头将货币对跌破 41,394 美元,则空头将占据上风。随后该货币对可能会下滑至 40,000 美元,最终跌至 37,980 美元。
Ether price analysis
以太币价格分析
Ether (ETH) has been trading below the moving averages for several days, but the bears have failed to pull the price to the strong support at $2,100. This suggests buying at lower levels.
以太坊 (ETH) 连续几天都在移动平均线下方交易,但空头未能将价格拉至 2,100 美元的强劲支撑位。这表明在较低水平买入。
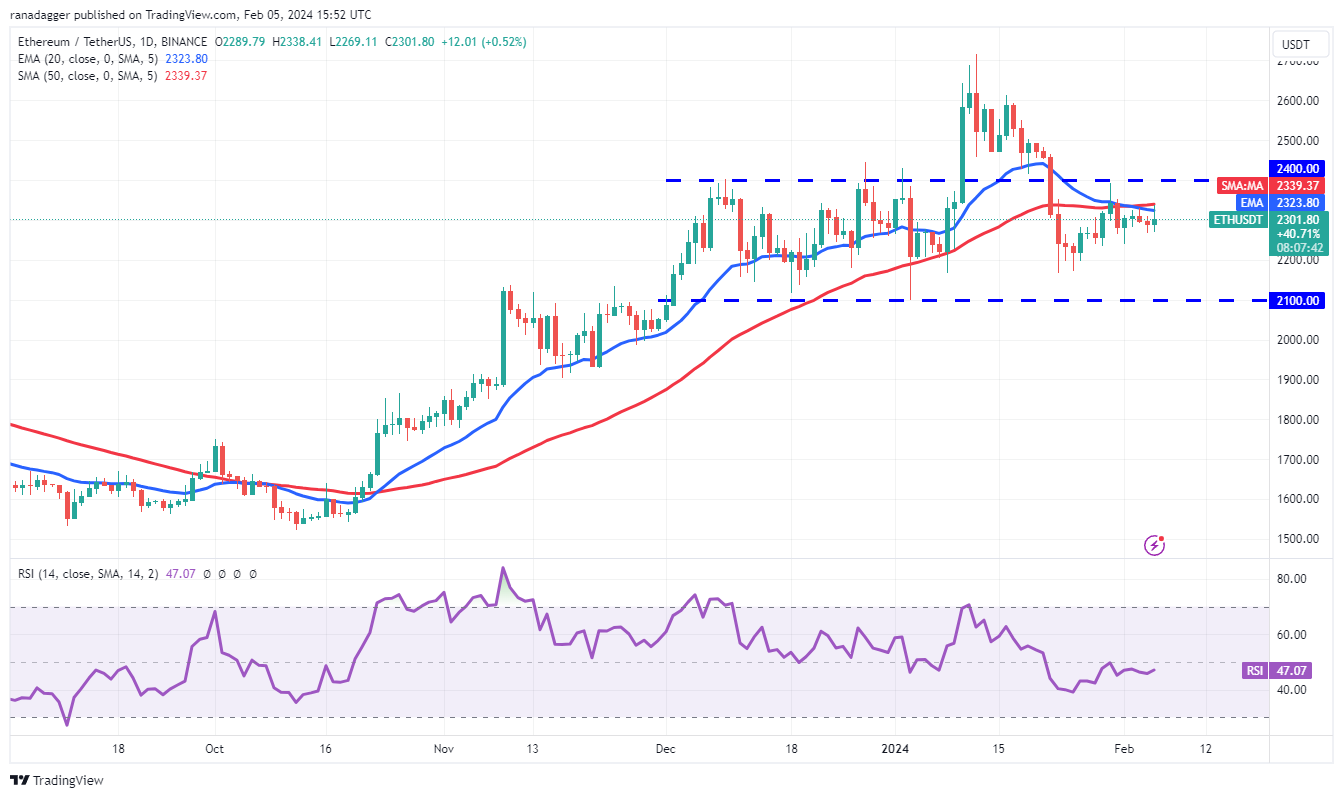
The bulls are trying to push the price above the moving averages. If they do that, the ETH/USDT pair could challenge the $2,400 level. A break and close above this resistance will indicate that bulls have overpowered the bears. The pair may rise to $2,600 and then to the Jan. 12 intraday high of $2,717.
多头正试图将价格推至移动平均线之上。如果他们这样做,ETH/USDT 货币对可能会挑战 2,400 美元的水平。突破并收盘于该阻力之上将表明多头已经压倒了空头。该货币对可能会升至 2,600 美元,然后升至 1 月 12 日盘中高点 2,717 美元。
Conversely, if the price turns down from the overhead resistance, it will signal that the bears are active at higher levels. That may keep the pair stuck inside the $2,100 to $2,400 range for some more time.
相反,如果价格从上方阻力位下跌,则表明空头在较高水平上活跃。这可能会让该货币对在 2,100 美元至 2,400 美元区间内停留一段时间。
BNB price analysis
BNB价格分析
BNB (BNB) bounced off the 50-day SMA ($300) on Feb. 4, but the bulls are struggling to build upon the strength.
BNB (BNB) 于 2 月 4 日从 50 日移动平均线(300 美元)反弹,但多头正在努力巩固这一势头。
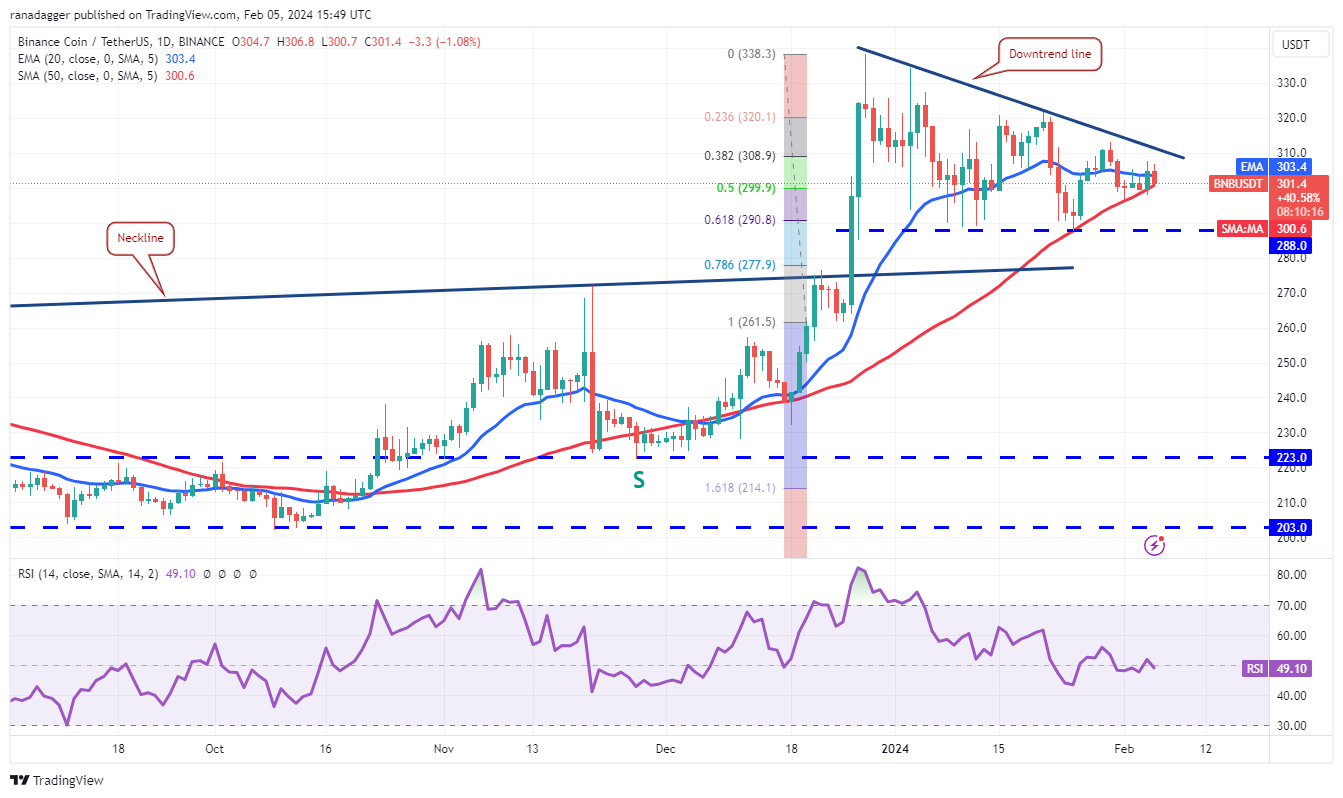
Buyers will have to clear the overhead hurdle at the downtrend line to invalidate the descending triangle pattern. If they succeed, the BNB/USDT pair could rally to $320 and subsequently to $338.
买家必须清除下降趋势线的上方障碍,以使下降三角形模式失效。如果成功,BNB/USDT 货币对可能会反弹至 320 美元,随后升至 338 美元。
Contrary to this assumption, if the price turns down and breaks below the 50-day SMA, it will indicate that the bears continue to sell on minor rallies. The pair may then drop to the strong support at $288. If this level crumbles, the pair will complete the bearish setup, which could start a down move to $260.
与这一假设相反,如果价格下跌并跌破 50 日移动平均线,则表明空头继续在小幅反弹中抛售。随后该货币对可能会跌至 288 美元的强支撑位。如果该水平崩溃,该货币对将完成看跌格局,可能开始下跌至 260 美元。
XRP price analysis
瑞波币价格分析
The bears could not maintain XRP (XRP) below $0.50 on Jan. 31 and Feb. 1, which started a recovery to the 20-day EMA ($0.53) on Feb. 3.
1 月 31 日和 2 月 1 日,空头无法将 XRP (XRP) 维持在 0.50 美元以下,2 月 3 日开始回升至 20 日均线(0.53 美元)。
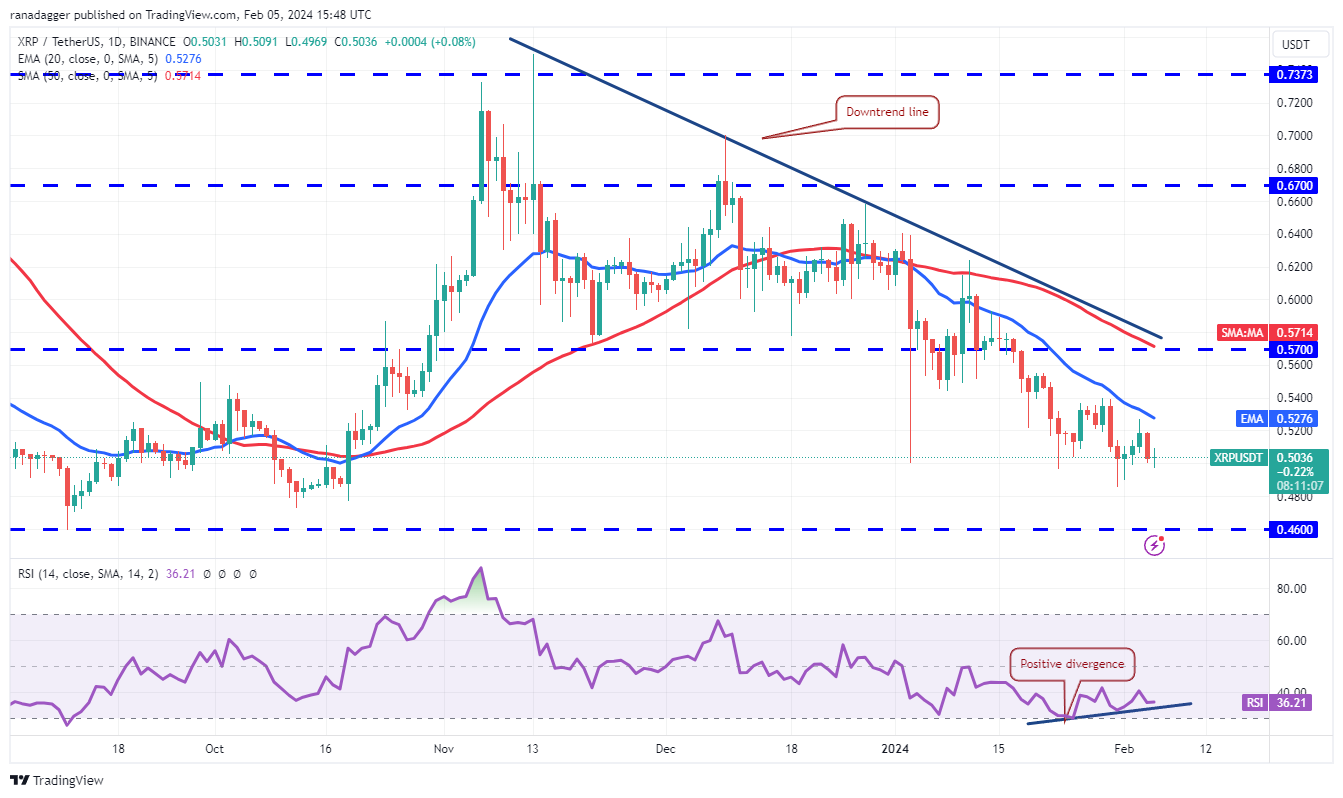
The price turned down from the 20-day EMA on Feb. 4, indicating that the sentiment remains negative and traders are selling on rallies. If the $0.50 support gives way, the XRP/USDT pair could plunge to $0.46.
价格从 2 月 4 日的 20 日均线下跌,表明市场情绪仍然消极,交易者逢高抛售。如果 0.50 美元的支撑位失守,XRP/USDT 货币对可能会暴跌至 0.46 美元。
Contrarily, if the price turns up from the current level and breaks above the 20-day EMA, it will suggest that the bulls are vigorously defending the $0.50 support. The positive divergence on the RSI also points toward a recovery in the near term. If buyers kick the price above the 20-day EMA, the pair may attempt a rally to the downtrend line.
相反,如果价格从当前水平回升并突破20日均线,则表明多头正在大力捍卫0.50美元的支撑位。 RSI 的正背离也表明近期将出现复苏。如果买家将价格推至 20 日均线上方,该货币对可能会尝试反弹至下降趋势线。
Solana price analysis
Solana 价格分析
Solana (SOL) is witnessing a tough battle between the bulls and the bears near the moving averages.
Solana (SOL) 正在见证多头和空头在移动平均线附近进行一场艰苦的战斗。
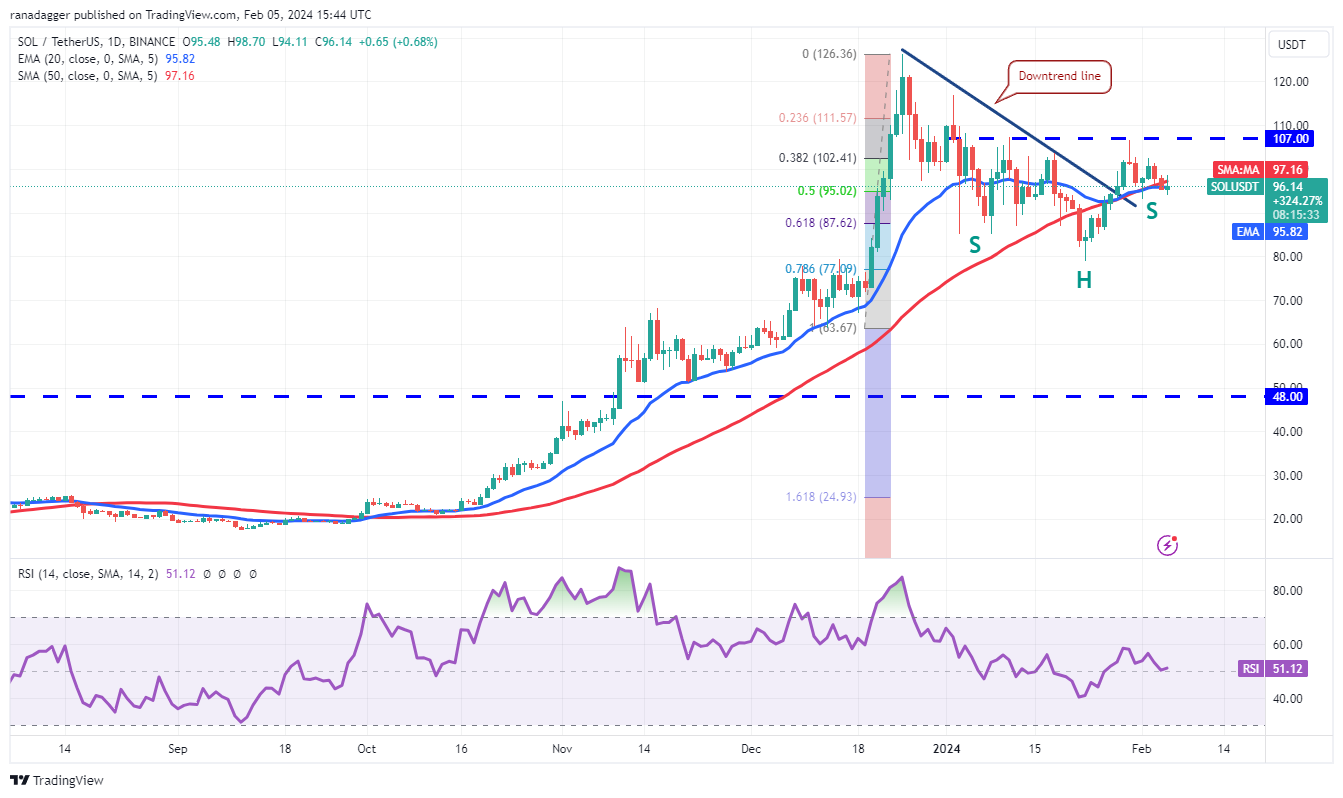
The price action of the past few days is forming an inverse H&S pattern, which will complete on a break and close above $107. This bullish setup has a target objective of $125. There is a minor resistance at $117, but it is likely to be crossed.
过去几天的价格走势正在形成反向 H&S 模式,该模式将在突破时完成并收于 107 美元上方。这种看涨设置的目标是 125 美元。 117 美元有一个小阻力,但很可能会被突破。
Alternatively, if the price breaks and maintains below the moving averages, it will signal that the bulls have given up. The SOL/USDT pair may start a descent to $79, which is an important level for the bulls to guard, because if it cracks, the next stop may be $64.
或者,如果价格突破并维持在移动平均线下方,则表明多头已经放弃。 SOL/USDT 货币对可能会开始下跌至 79 美元,这是多头要守卫的重要水平,因为如果它破裂,下一站可能是 64 美元。
Related: BTC price sets new February high as Bitcoin buyers target faraway $25K
相关:BTC 价格创下 2 月份新高,比特币买家目标远达 2.5 万美元
Cardano price analysis
卡尔达诺价格分析
Cardano (ADA) has been hovering near the 20-day EMA ($0.50) for the past few days, indicating indecision between the bulls and the bears.
卡尔达诺(ADA)过去几天一直徘徊在 20 日均线(0.50 美元)附近,表明多头和空头之间犹豫不决。
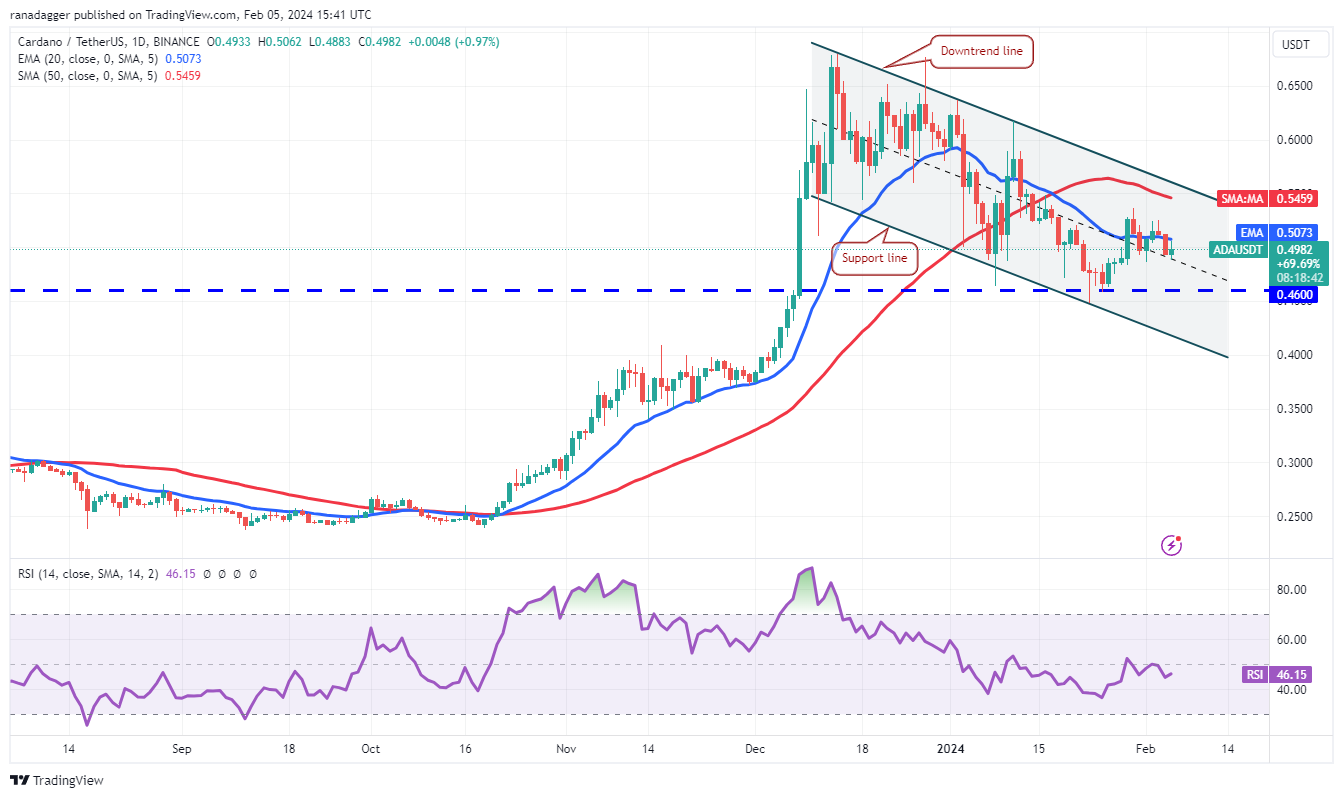
The 20-day EMA has flattened out, and the RSI is just below the midpoint, suggesting a range-bound action in the near term. If buyers drive the price above the 20-day EMA, the ADA/USDT pair could rise to the downtrend line. The bulls will have to overcome this obstacle to signal a potential trend change in the near term.
20 日均线已经趋于平缓,RSI 略低于中点,表明近期将出现区间波动。如果买家将价格推高至 20 日均线上方,ADA/USDT 货币对可能会升至下降趋势线。多头必须克服这一障碍才能发出近期潜在趋势变化的信号。
On the downside, if the price breaks below $0.48, it will indicate that bears are trying to gain the upper hand. The pair may slide to $0.46 and later to the channel’s support line.
不利的一面是,如果价格跌破 0.48 美元,则表明空头正试图占据上风。该货币对可能会滑至 0.46 美元,然后跌至通道支撑线。
Avalanche price analysis
雪崩价格分析
Avalanche (AVAX) reversed direction from the downtrend line on Feb. 3, but a positive sign is that the bulls are attempting to defend the 20-day EMA ($34.55).
Avalanche (AVAX) 从 2 月 3 日的下降趋势线转向,但一个积极的迹象是多头正试图捍卫 20 日均线(34.55 美元)。
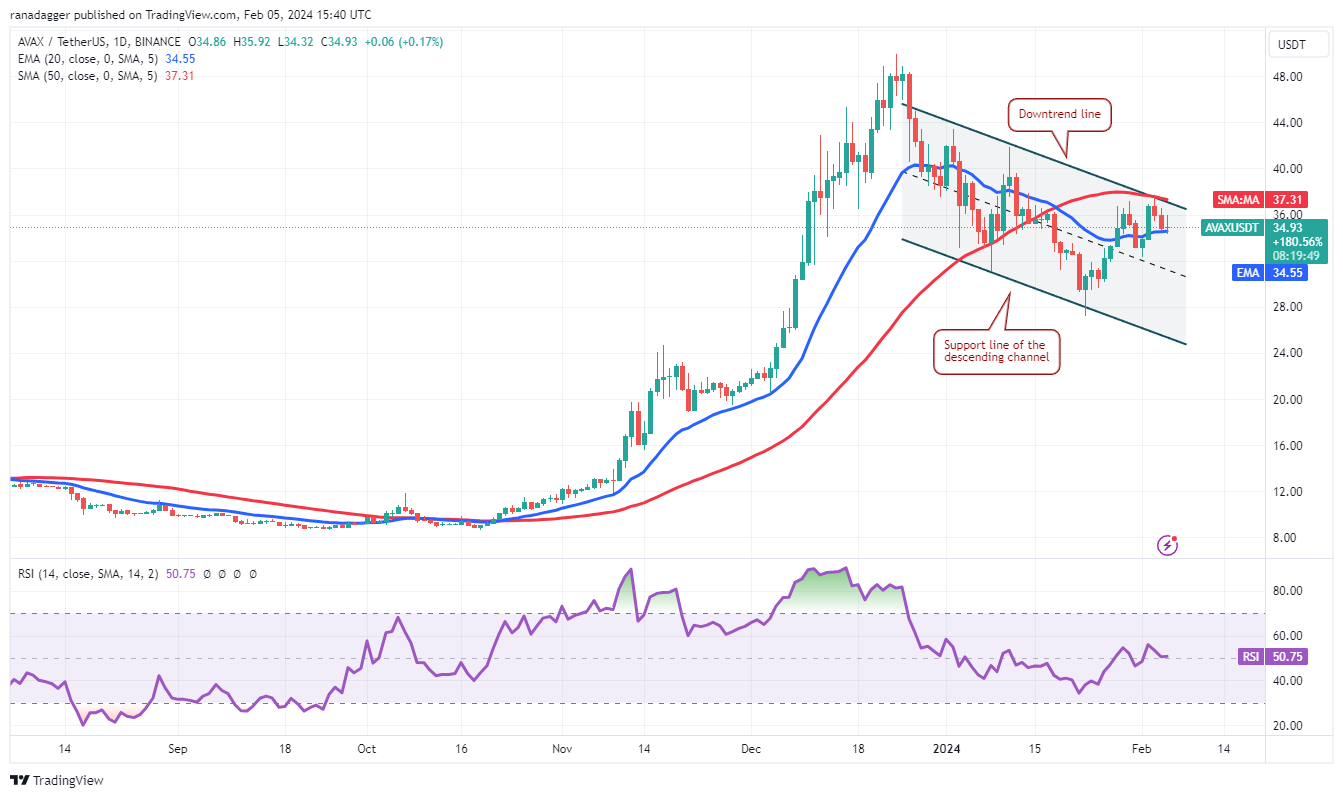
If the price turns up from the current level, it will increase the likelihood of a break above the descending channel. If that happens, the AVAX/USDT pair could climb to $44 and thereafter attempt a rally to the psychologically important level of $50.
如果价格从当前水平上涨,突破下降通道的可能性将增加。如果发生这种情况,AVAX/USDT 货币对可能会攀升至 44 美元,然后尝试反弹至 50 美元的重要心理水平。
If bears want to prevent the upward move, they will have to quickly yank the price below the immediate support at $32. If they do that, the pair could slump toward the channel’s support line near $24.
如果空头想要阻止上涨,他们将不得不迅速将价格拉低至 32 美元的直接支撑位以下。如果他们这样做,该货币对可能会跌向通道支撑线 24 美元附近。
Dogecoin price analysis
狗狗币价格分析
Dogecoin (DOGE) continues to trade below the 20-day EMA ($0.08), but the bulls have not allowed the price to dip below the uptrend line of the symmetrical triangle pattern.
狗狗币 (DOGE) 继续交投于 20 日均线(0.08 美元)下方,但多头不允许价格跌破对称三角形图案的上升趋势线。
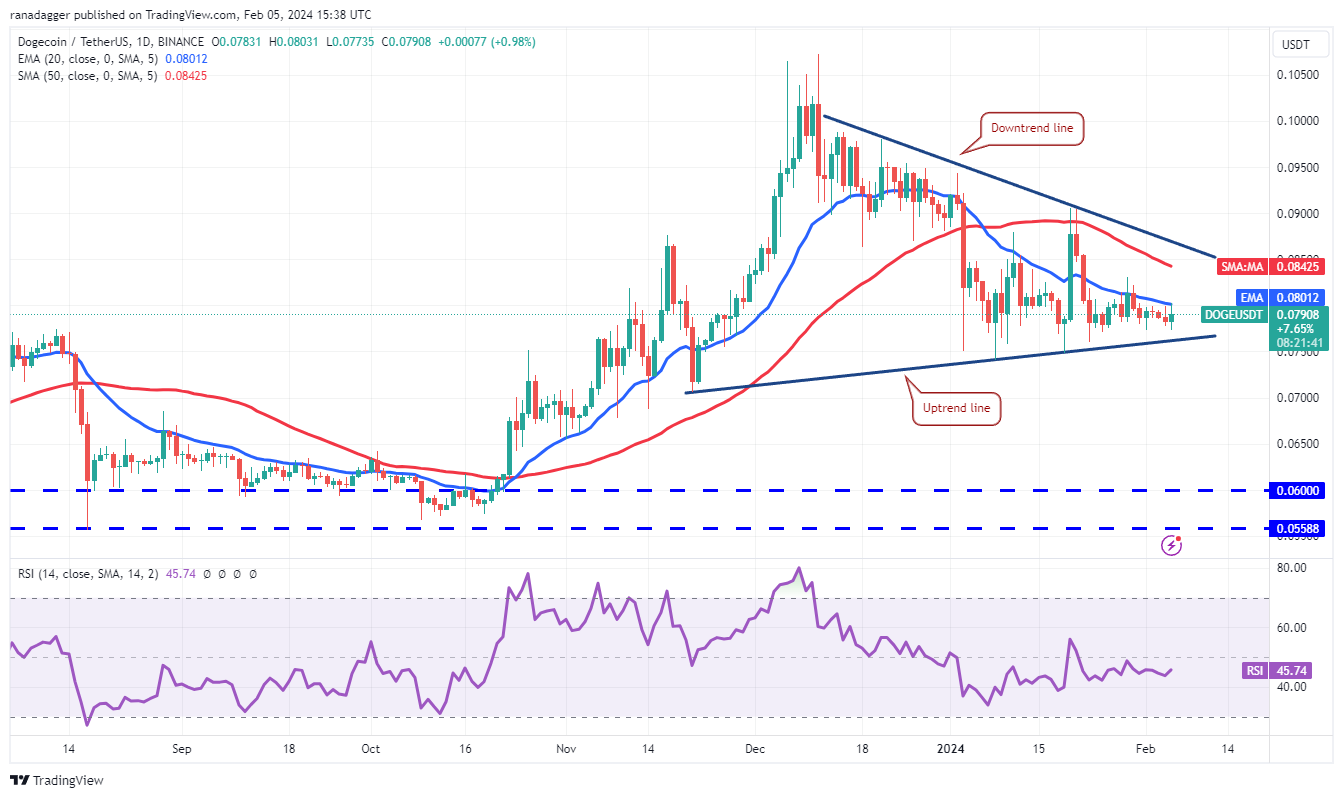
If the price turns up and breaks above the 20-day EMA, it will indicate that the DOGE/USDT pair may extend its stay inside the triangle for a few more days. The pair will try to rise to the downtrend line.
如果价格上涨并突破 20 日均线,则表明 DOGE/USDT 货币对可能会在三角形内再停留几天。该货币对将尝试升至下降趋势线。
The next trending move is likely to begin on a break above or below the triangle. If the price surges above the triangle, the pair could travel to the $0.10 to $0.11 resistance zone. On the contrary, a break below the triangle will open the doors for a fall to $0.07 and then $0.06.
下一个趋势走势可能会从突破三角形上方或下方开始。如果价格飙升至三角形之上,该货币对可能会升至 0.10 美元至 0.11 美元的阻力区。相反,跌破三角形将为下跌至 0.07 美元,然后是 0.06 美元打开大门。
This article does not contain investment advice or recommendations. Every investment and trading move involves risk, and readers should conduct their own research when making a decision.
本文不包含投资建议或建议。每一项投资和交易行为都涉及风险,读者在做出决定时应自行研究。
 crypto.ro English
 DogeHome
 Crypto News Land
 ETHNews
 CFN
CFN U_Today
 Thecoinrepublic.com
 Optimisus


