

Stock markets in the United States continued their march higher last week, even after the Federal Reserve Chair Jerome Powell dashed hopes of a rate cut in March. However, Powell did say that a rate cut would likely happen this year. Powell reiterated these views during his interview with CBS news show 60 Minutes.
미국 증시는 지난 3월 제롬 파월 연준 의장이 금리 인하 기대를 저버린 후에도 지난주 상승세를 이어갔습니다. 그러나 파월 의장은 올해 금리 인하가 이뤄질 가능성이 있다고 말했다. Powell은 CBS 뉴스 쇼 60 Minutes와의 인터뷰에서 이러한 견해를 반복했습니다.
Fed comments and strong macroeconomic data reduced expectations of rate cuts by the Fed to 120 basis points in 2024, down from 150 basis points at the end of last year, Fed funds futures showed. This pushed the U.S. dollar Index (DXY) to its highest level in 11 weeks.
연준의 논평과 강력한 거시경제 데이터는 연준의 금리 인하 기대치를 작년 말 150bp에서 2024년 120bp로 낮추었다고 연방기금 선물이 나타났습니다. 이로 인해 미국 달러 지수(DXY)가 11주 만에 최고 수준으로 상승했습니다.
Historically, Bitcoin (BTC) moves in inverse correlation with the U.S. dollar. Hence the strength in the greenback could act as a headwind for Bitcoin in the near term. A minor positive in favor of the bulls is the strong inflows into BlackRock and Fidelity’s spot Bitcoin exchange-traded funds (ETFs) in January, totaling about $4.8 billion. Continued inflows into the ETFs could limit the downside.
역사적으로 비트코인(BTC)은 미국 달러와 역의 상관관계로 움직였습니다. 따라서 달러의 강세는 단기적으로 비트코인에 역풍으로 작용할 수 있습니다. 강세에 유리한 작은 긍정적인 점은 1월에 BlackRock과 Fidelity의 현물 비트코인 상장지수펀드(ETF)로 총 약 48억 달러에 달하는 강력한 자금 유입이 있다는 것입니다. ETF로의 지속적인 자금 유입은 하락세를 제한할 수 있습니다.
Will Bitcoin remain stuck in a range, or is a breakout on the cards? How are the altcoins expected to behave? Let’s analyze the charts to find out.
비트코인이 계속해서 범위에 머물게 될까요, 아니면 카드에 브레이크아웃이 발생할까요? 알트코인은 어떻게 행동할 것으로 예상되나요? 알아보기 위해 차트를 분석해 보겠습니다.
S&P 500 Index price analysis
S&P 500 지수 가격 분석
The S&P 500 Index rebounded off the 20-day exponential moving average (4,850) on Feb. 1 and soared to a new all-time high on Feb. 2.
S&P 500 지수는 2월 1일 20일 지수 이동 평균(4,850)에서 반등했고, 2월 2일에는 사상 최고치를 경신했습니다.
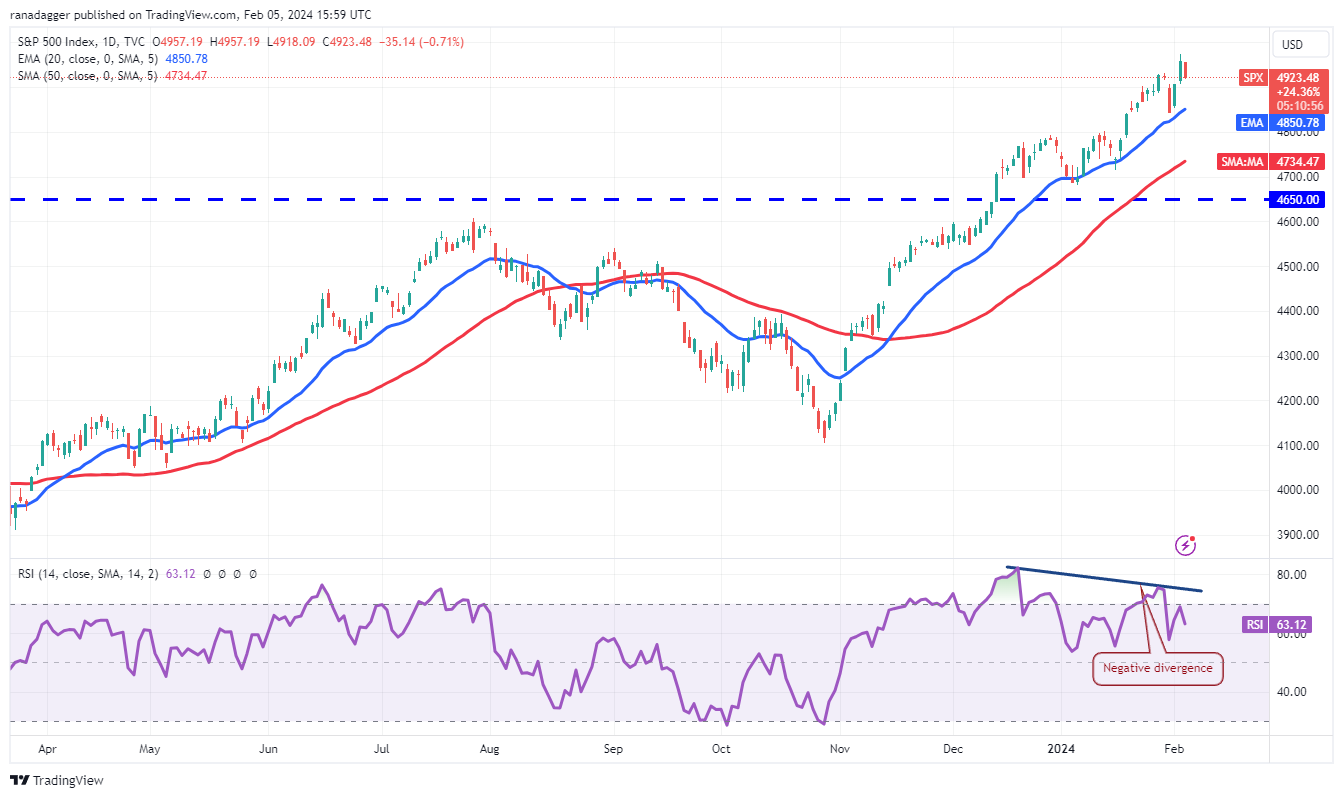
Both moving averages are sloping up, indicating that the bulls are in command, but the negative divergence on the relative strength index (RSI) warrants caution. The up move could face selling at the psychological resistance of 5,000, but if buyers bulldoze their way through, the next stop could be 5,200.
두 이동평균 모두 상승세를 보이고 있어 상승세를 주도하고 있지만 상대강도지수(RSI)의 마이너스 다이버전스로 인해 주의가 필요합니다. 상승세는 심리적 저항선인 5,000에서 매도에 직면할 수 있지만, 구매자가 강세를 보이면 다음 정지점은 5,200이 될 수 있습니다.
The crucial support on the downside is the 20-day EMA. A slide below this level will be the first indication that the bulls are rushing to the exit. That may start a fall to the 50-day simple moving average (4,734) and then to 4,650.
하락세에 대한 중요한 지지는 20일 EMA입니다. 이 수준 아래로 미끄러지는 것은 황소가 출구로 돌진하고 있다는 첫 번째 징후가 될 것입니다. 이는 50일 단순 이동 평균(4,734)으로 하락한 다음 4,650으로 하락할 수 있습니다.
U.S. dollar Index price analysis
미국 달러 지수 가격 분석
The U.S. dollar Index snapped back sharply from the 50-day SMA (102.84) on Feb. 2 and broke above the neckline of the inverted head-and-shoulders pattern.
미국 달러 지수는 2월 2일 50일 SMA(102.84)에서 급격히 반등하여 역헤드앤숄더 패턴의 네크라인을 넘어섰습니다.
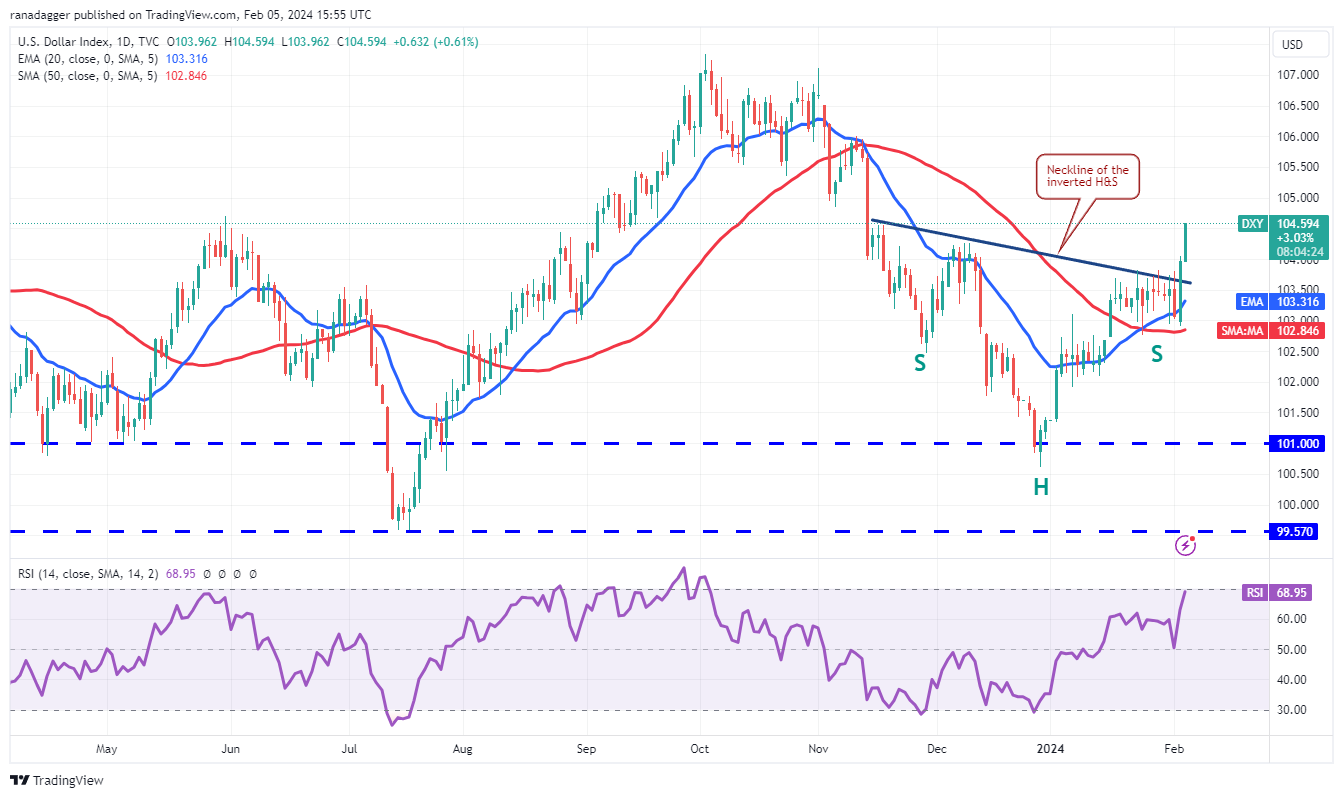
The pattern target of the bullish setup is 107.39, just below the formidable overhead resistance at 108. However, the bears are unlikely to give up easily. They will try to halt the up move near 104.55 and again at 106.
강세 설정의 패턴 목표는 107.39로, 무시무시한 머리 위 저항선인 108 바로 아래에 있습니다. 그러나 하락세가 쉽게 포기할 것 같지는 않습니다. 그들은 104.55 근처와 106에서 다시 상승 움직임을 멈추려고 할 것입니다.
If bears want to make a comeback, they will have to tug the price below the 50-day SMA to seize control. The index may decline to the vital support zone between 101 and 99.57. The bulls are expected to defend this zone with all their might.
하락세가 반등하려면 통제권을 잡기 위해 가격을 50일 SMA 아래로 끌어내야 합니다. 지수는 101에서 99.57 사이의 필수 지지대까지 하락할 수 있습니다. 강세론자들은 온 힘을 다해 이 지역을 방어할 것으로 예상됩니다.
Bitcoin price analysis
비트코인 가격 분석
The bears have failed to sink Bitcoin below the 20-day EMA ($42,463) even after repeated attempts, suggesting that the bulls are fiercely defending the level.
하락세는 반복적인 시도에도 불구하고 비트코인을 20일 EMA(42,463달러) 아래로 낮추는 데 실패했으며 이는 상승세력이 치열하게 이 수준을 방어하고 있음을 시사합니다.
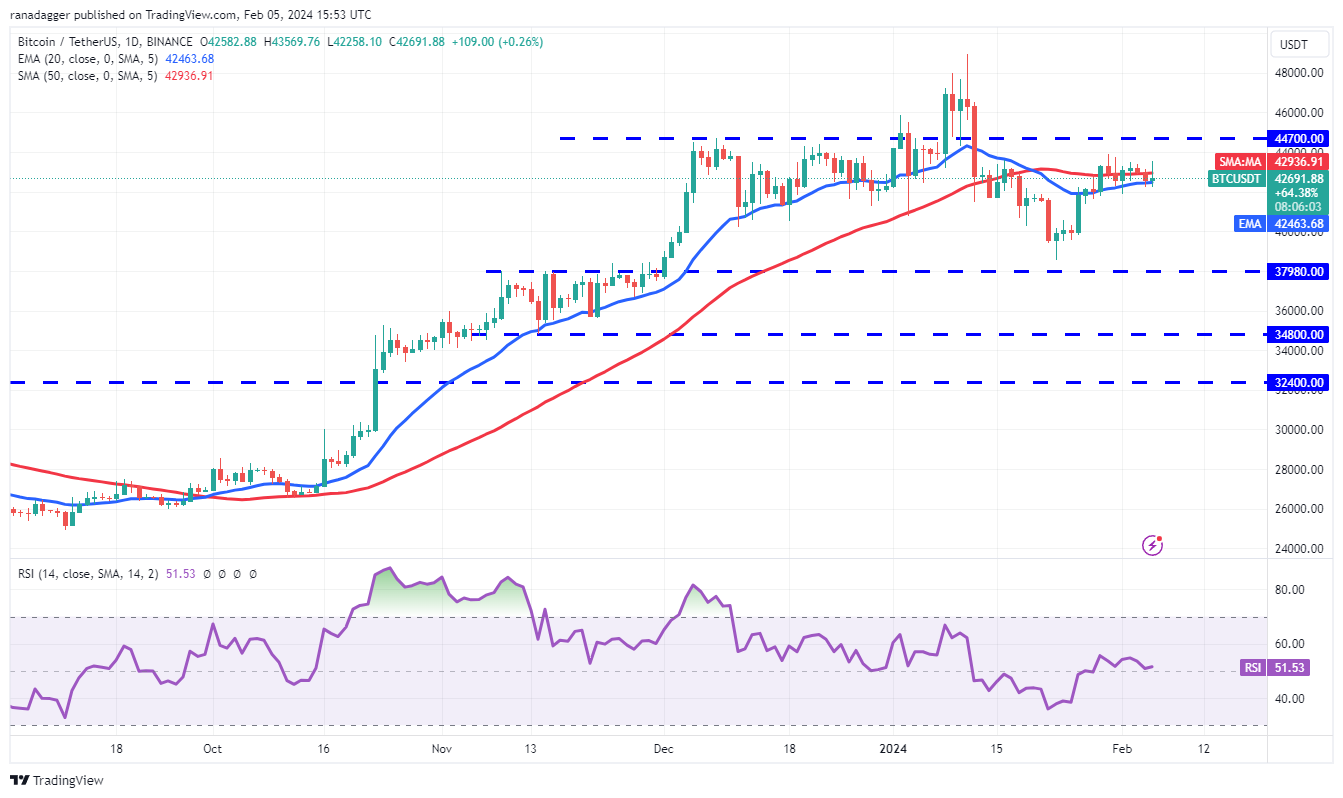
Buyers will try to push the price to the $44,000 to $44,700 overhead resistance zone. This remains the key zone for the bears to defend because if they fail in their endeavor, the BTC/USDT pair could skyrocket to the psychological level of $50,000.
구매자는 가격을 $44,000~$44,700의 오버헤드 저항 영역까지 끌어올리려고 노력할 것입니다. 이것은 곰들이 방어해야 할 핵심 영역으로 남아 있습니다. 왜냐하면 그들이 노력에 실패할 경우 BTC/USDT 쌍은 심리적 수준인 $50,000까지 치솟을 수 있기 때문입니다.
On the other hand, if the price turns down from $44,700, the pair may consolidate in a tight range for a while. The bears will be on top if they sink the pair below $41,394. The pair may then slide to $40,000 and eventually to $37,980.
반면에 가격이 $44,700에서 하락하면 한동안 그 쌍은 좁은 범위에 통합될 수 있습니다. 하락세가 $41,394 아래로 떨어지면 하락세는 정상에 오를 것입니다. 그런 다음 쌍은 $40,000까지 하락하고 결국 $37,980까지 하락할 수 있습니다.
Ether price analysis
이더 가격 분석
Ether (ETH) has been trading below the moving averages for several days, but the bears have failed to pull the price to the strong support at $2,100. This suggests buying at lower levels.
이더리움(ETH)은 며칠 동안 이동평균선 아래에서 거래되었지만 하락세는 가격을 2,100달러의 강력한 지지선까지 끌어올리지 못했습니다. 이는 낮은 수준에서 구매하는 것을 의미합니다.
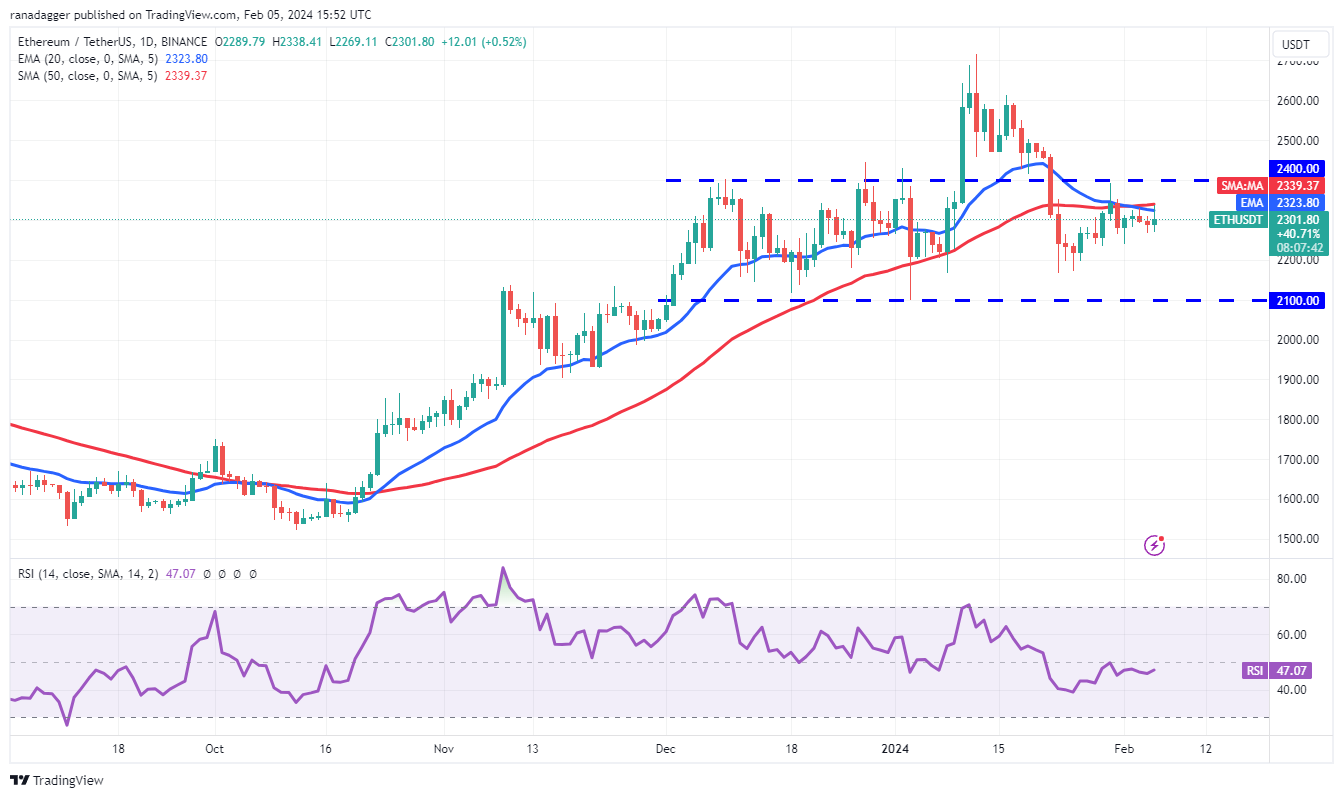
The bulls are trying to push the price above the moving averages. If they do that, the ETH/USDT pair could challenge the $2,400 level. A break and close above this resistance will indicate that bulls have overpowered the bears. The pair may rise to $2,600 and then to the Jan. 12 intraday high of $2,717.
강세론자들은 가격을 이동 평균 이상으로 끌어올리려고 노력하고 있습니다. 그렇게 하면 ETH/USDT 쌍이 2,400달러 수준에 도전할 수 있습니다. 이 저항선 위의 돌파 및 종가는 황소가 하락세를 압도했음을 나타냅니다. 이 쌍은 $2,600까지 상승한 다음 1월 12일 장중 최고 $2,717까지 상승할 수 있습니다.
Conversely, if the price turns down from the overhead resistance, it will signal that the bears are active at higher levels. That may keep the pair stuck inside the $2,100 to $2,400 range for some more time.
반대로 가격이 오버헤드 저항으로 인해 하락한다면 하락세가 더 높은 수준에서 활성화되고 있다는 신호가 됩니다. 이로 인해 가격은 한동안 2,100~2,400달러 범위에 머물게 될 수 있습니다.
BNB price analysis
BNB 가격 분석
BNB (BNB) bounced off the 50-day SMA ($300) on Feb. 4, but the bulls are struggling to build upon the strength.
BNB(BNB)는 2월 4일 50일 SMA($300)에서 반등했지만 상승세는 강세를 유지하기 위해 고군분투하고 있습니다.
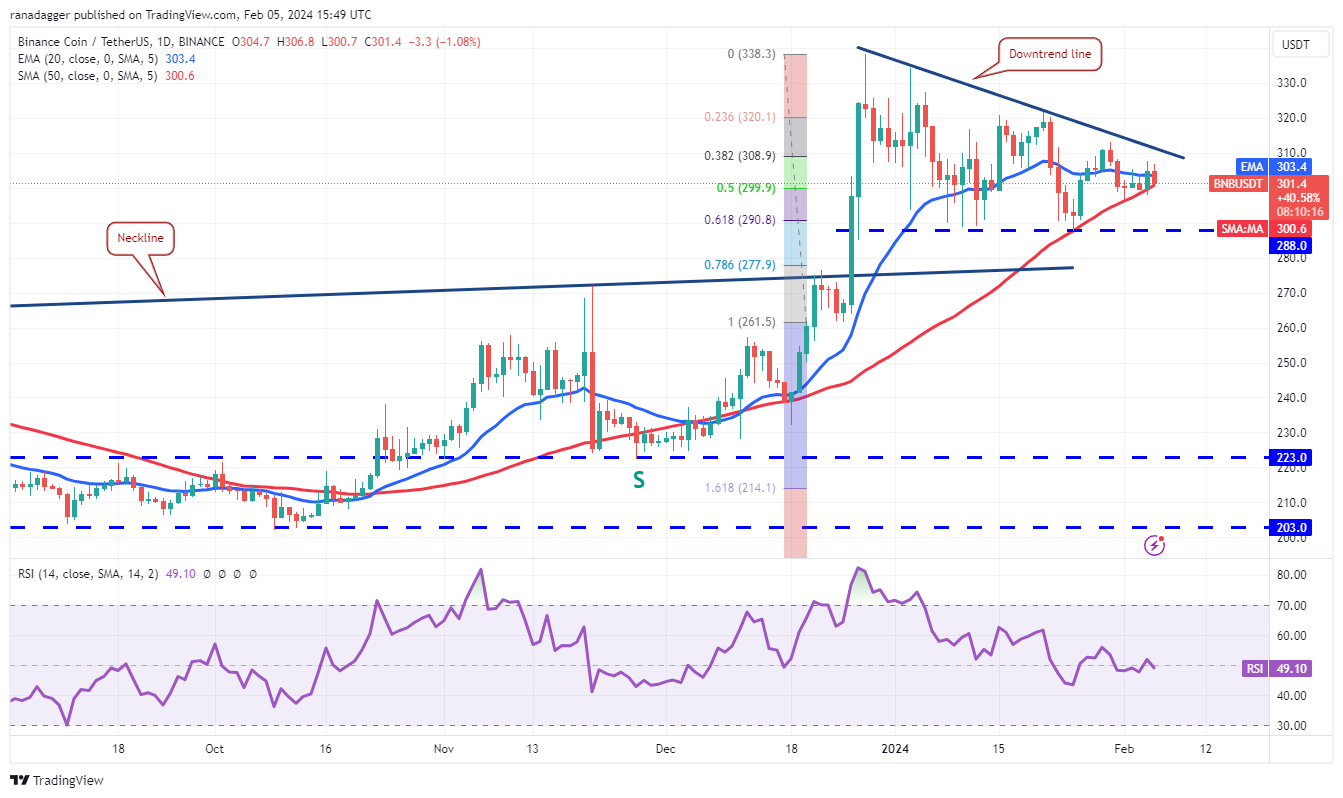
Buyers will have to clear the overhead hurdle at the downtrend line to invalidate the descending triangle pattern. If they succeed, the BNB/USDT pair could rally to $320 and subsequently to $338.
구매자는 하강 삼각형 패턴을 무효화하려면 하락 추세선에서 오버헤드 장애물을 제거해야 합니다. 성공하면 BNB/USDT 쌍은 320달러까지 상승한 후 338달러까지 상승할 수 있습니다.
Contrary to this assumption, if the price turns down and breaks below the 50-day SMA, it will indicate that the bears continue to sell on minor rallies. The pair may then drop to the strong support at $288. If this level crumbles, the pair will complete the bearish setup, which could start a down move to $260.
이 가정과 반대로 가격이 하락하고 50일 SMA 아래로 떨어지면 약세는 소규모 랠리에서 계속 매도한다는 것을 나타냅니다. 그러면 그 쌍은 $288의 강력한 지지선으로 떨어질 수 있습니다. 이 수준이 무너지면 쌍은 약세 설정을 완료하여 $260까지 하락할 수 있습니다.
XRP price analysis
XRP 가격 분석
The bears could not maintain XRP (XRP) below $0.50 on Jan. 31 and Feb. 1, which started a recovery to the 20-day EMA ($0.53) on Feb. 3.
하락세는 1월 31일과 2월 1일 XRP(XRP)를 0.50달러 미만으로 유지할 수 없었고, 이로 인해 2월 3일 20일 EMA(0.53달러)로 회복되기 시작했습니다.
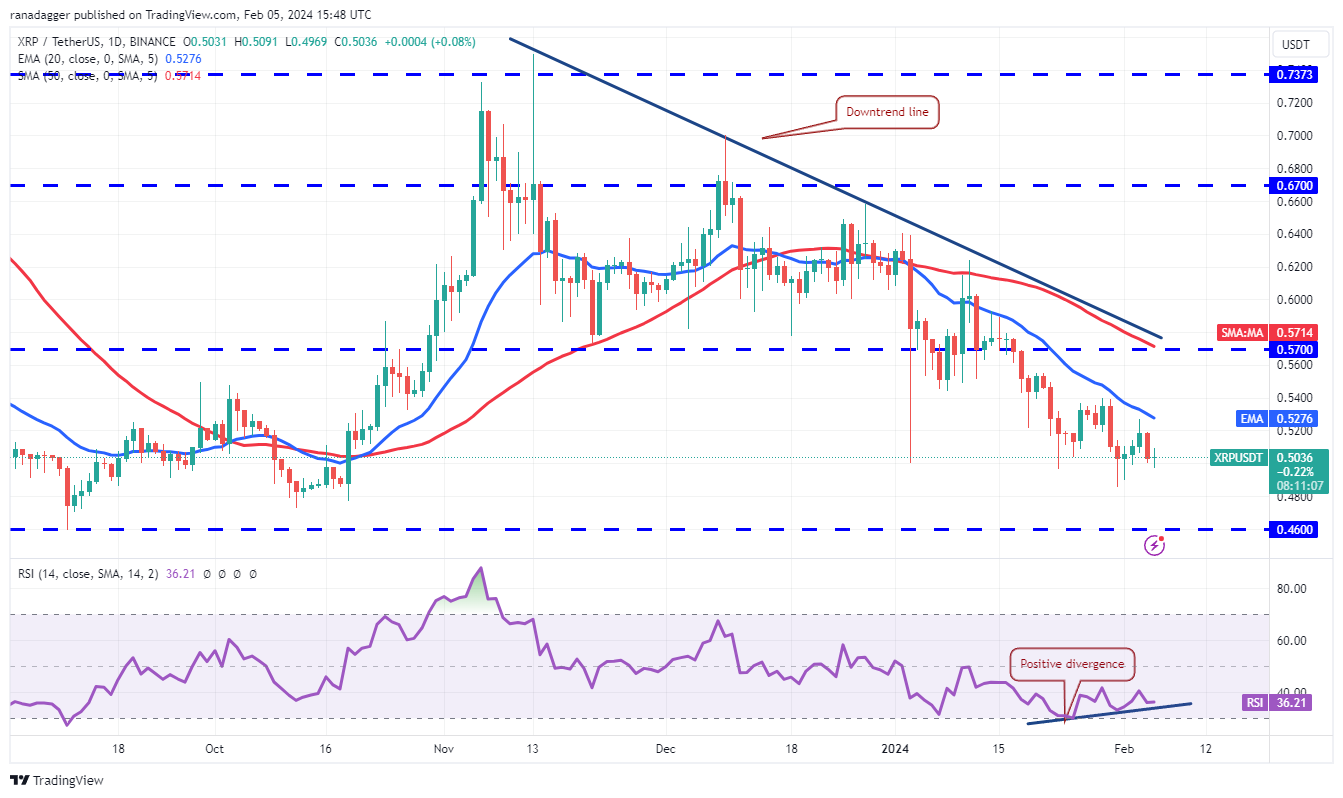
The price turned down from the 20-day EMA on Feb. 4, indicating that the sentiment remains negative and traders are selling on rallies. If the $0.50 support gives way, the XRP/USDT pair could plunge to $0.46.
가격은 2월 4일 20일 EMA에서 하락했는데, 이는 정서가 여전히 부정적이며 거래자들이 반등에 매도하고 있음을 나타냅니다. 0.50달러 지지가 무너지면 XRP/USDT 쌍은 0.46달러로 급락할 수 있습니다.
Contrarily, if the price turns up from the current level and breaks above the 20-day EMA, it will suggest that the bulls are vigorously defending the $0.50 support. The positive divergence on the RSI also points toward a recovery in the near term. If buyers kick the price above the 20-day EMA, the pair may attempt a rally to the downtrend line.
반대로 가격이 현재 수준에서 상승하여 20일 EMA를 넘어선다면 상승세가 $0.50 지지선을 적극적으로 방어하고 있음을 의미합니다. RSI의 긍정적인 다이버전스는 또한 단기적인 회복을 시사합니다. 구매자가 20일 EMA 이상으로 가격을 높이면 해당 쌍은 하락 추세선으로 랠리를 시도할 수 있습니다.
Solana price analysis
솔라나 가격 분석
Solana (SOL) is witnessing a tough battle between the bulls and the bears near the moving averages.
솔라나(SOL)는 이동 평균 근처에서 황소와 곰 사이의 치열한 전투를 목격하고 있습니다.
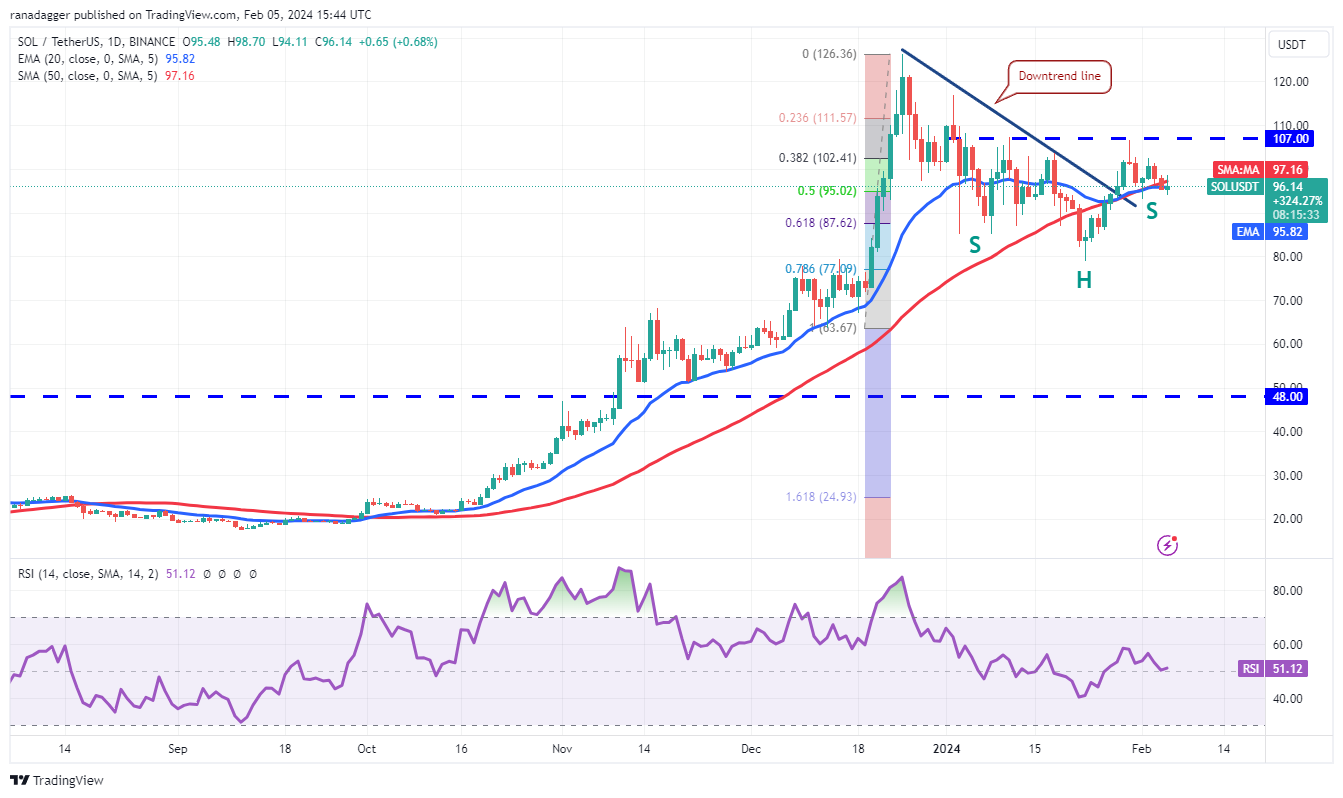
The price action of the past few days is forming an inverse H&S pattern, which will complete on a break and close above $107. This bullish setup has a target objective of $125. There is a minor resistance at $117, but it is likely to be crossed.
지난 며칠 동안의 가격 움직임은 역 H&S 패턴을 형성하고 있으며, 이는 휴식기에 완료되고 $107 이상으로 마감됩니다. 이 강세 설정의 목표 목표는 $125입니다. $117에 약간의 저항이 있지만 교차할 가능성이 높습니다.
Alternatively, if the price breaks and maintains below the moving averages, it will signal that the bulls have given up. The SOL/USDT pair may start a descent to $79, which is an important level for the bulls to guard, because if it cracks, the next stop may be $64.
또는 가격이 이동 평균 아래로 유지되고 유지된다면 황소가 포기했다는 신호가 될 것입니다. SOL/USDT 쌍은 79달러까지 하락을 시작할 수 있는데, 이는 황소가 지켜야 할 중요한 수준입니다. 왜냐하면 그것이 깨지면 다음 중지점은 64달러가 될 수 있기 때문입니다.
Related: BTC price sets new February high as Bitcoin buyers target faraway $25K
관련 항목: 비트코인 구매자가 25,000달러를 목표로 함에 따라 BTC 가격이 2월 최고치를 기록했습니다.
Cardano price analysis
카르다노 가격 분석
Cardano (ADA) has been hovering near the 20-day EMA ($0.50) for the past few days, indicating indecision between the bulls and the bears.
카르다노(ADA)는 지난 며칠 동안 20일 EMA($0.50) 근처를 맴돌고 있어 황소와 곰 사이에 우유부단함을 나타냅니다.
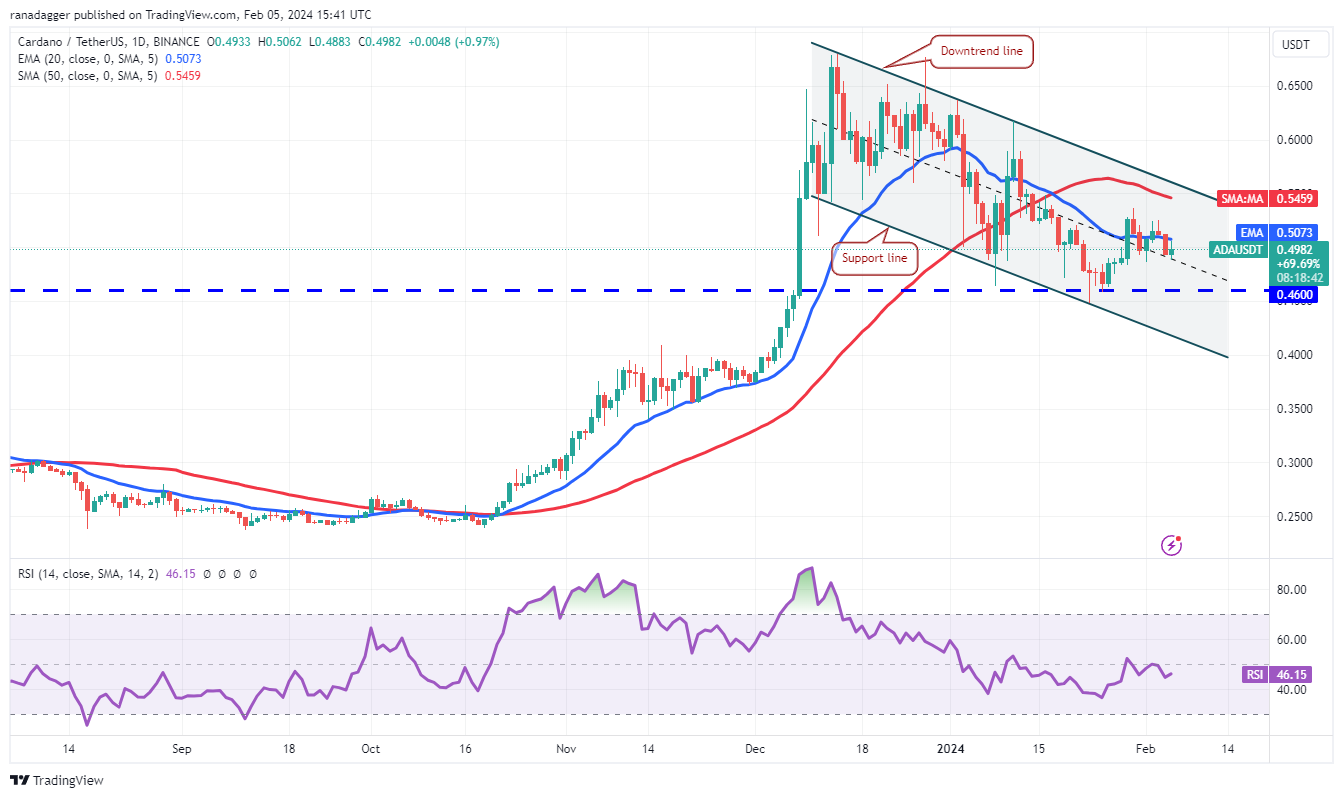
The 20-day EMA has flattened out, and the RSI is just below the midpoint, suggesting a range-bound action in the near term. If buyers drive the price above the 20-day EMA, the ADA/USDT pair could rise to the downtrend line. The bulls will have to overcome this obstacle to signal a potential trend change in the near term.
20일 EMA는 평준화되었고 RSI는 중간점 바로 아래에 있어 단기적으로 범위 제한 조치를 제안합니다. 구매자가 20일 EMA 위로 가격을 올리면 ADA/USDT 쌍이 하락 추세선으로 올라갈 수 있습니다. 황소는 단기적으로 잠재적 추세 변화를 알리기 위해 이러한 장애물을 극복해야 합니다.
On the downside, if the price breaks below $0.48, it will indicate that bears are trying to gain the upper hand. The pair may slide to $0.46 and later to the channel’s support line.
단점은 가격이 0.48달러 아래로 떨어지면 하락세가 우위를 점하려고 한다는 의미입니다. 쌍은 $0.46까지 하락하고 나중에 채널의 지지선까지 하락할 수 있습니다.
Avalanche price analysis
눈사태 가격 분석
Avalanche (AVAX) reversed direction from the downtrend line on Feb. 3, but a positive sign is that the bulls are attempting to defend the 20-day EMA ($34.55).
Avalanche(AVAX)는 2월 3일 하락 추세선에서 방향을 바꾸었지만 상승세가 20일 EMA($34.55)를 방어하려고 시도하고 있다는 점은 긍정적인 신호입니다.
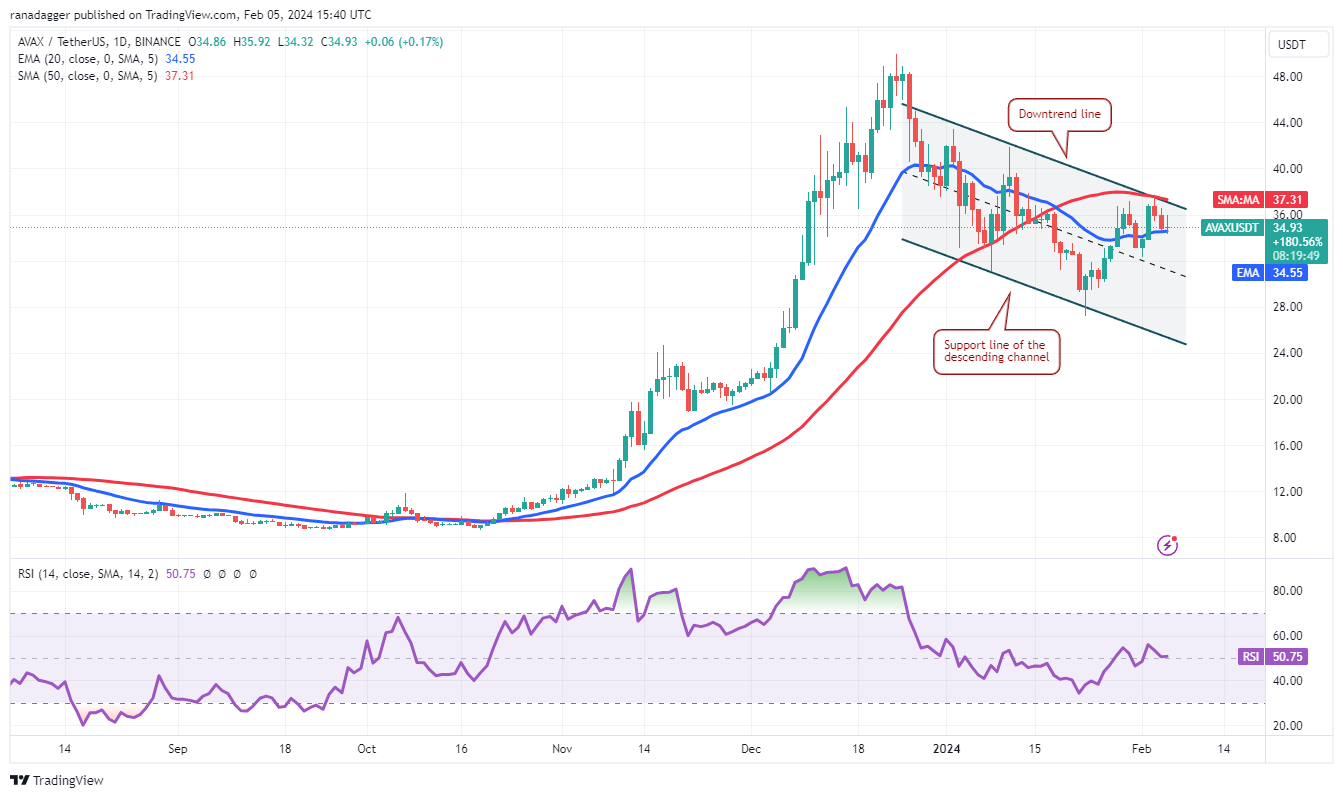
If the price turns up from the current level, it will increase the likelihood of a break above the descending channel. If that happens, the AVAX/USDT pair could climb to $44 and thereafter attempt a rally to the psychologically important level of $50.
가격이 현재 수준에서 상승하면 하락 채널을 넘어설 가능성이 높아집니다. 그렇게 되면 AVAX/USDT 쌍은 44달러까지 상승한 후 심리적으로 중요한 수준인 50달러까지 상승을 시도할 수 있습니다.
If bears want to prevent the upward move, they will have to quickly yank the price below the immediate support at $32. If they do that, the pair could slump toward the channel’s support line near $24.
하락세가 상승세를 막고 싶다면 즉시 지지선인 32달러 아래로 가격을 빠르게 낮춰야 합니다. 그렇게 할 경우 해당 쌍은 $24 부근의 채널 지지선을 향해 하락할 수 있습니다.
Dogecoin price analysis
도지코인 가격 분석
Dogecoin (DOGE) continues to trade below the 20-day EMA ($0.08), but the bulls have not allowed the price to dip below the uptrend line of the symmetrical triangle pattern.
Dogecoin(DOGE)은 20일 EMA($0.08) 아래에서 계속 거래되고 있지만 상승세는 가격이 대칭 삼각형 패턴의 상승 추세선 아래로 떨어지는 것을 허용하지 않았습니다.
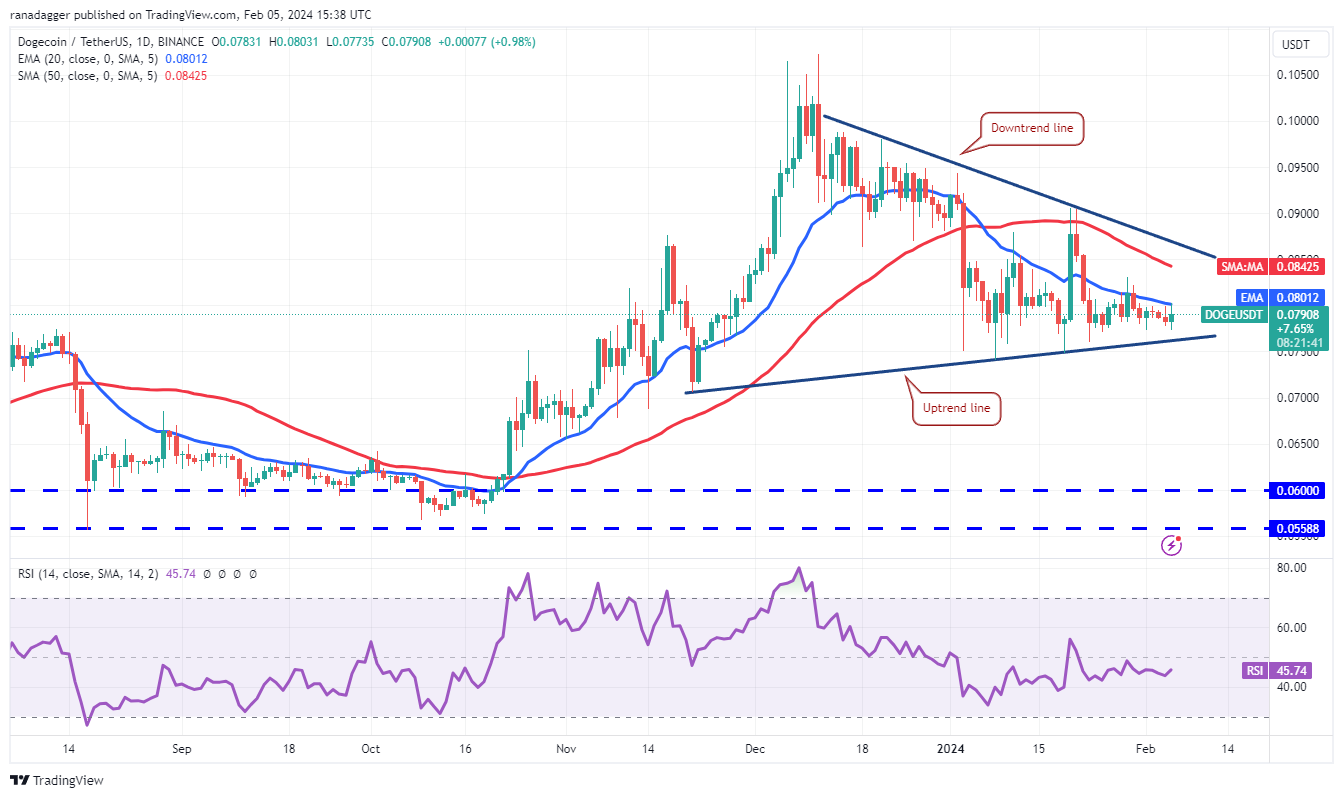
If the price turns up and breaks above the 20-day EMA, it will indicate that the DOGE/USDT pair may extend its stay inside the triangle for a few more days. The pair will try to rise to the downtrend line.
가격이 상승하여 20일 EMA를 넘어서면 DOGE/USDT 쌍이 며칠 더 삼각형 내부에 머물 수 있음을 나타냅니다. 통화쌍은 하락 추세선으로 상승하려고 시도할 것입니다.
The next trending move is likely to begin on a break above or below the triangle. If the price surges above the triangle, the pair could travel to the $0.10 to $0.11 resistance zone. On the contrary, a break below the triangle will open the doors for a fall to $0.07 and then $0.06.
다음 추세 움직임은 삼각형 위 또는 아래에서 시작될 가능성이 높습니다. 가격이 삼각형 위로 급등하면 해당 쌍은 $0.10에서 $0.11 저항 영역으로 이동할 수 있습니다. 반대로, 삼각형 아래로 돌파하면 $0.07, $0.06까지 하락할 수 있는 문이 열릴 것입니다.
This article does not contain investment advice or recommendations. Every investment and trading move involves risk, and readers should conduct their own research when making a decision.
이 글에는 투자 조언이나 추천이 포함되어 있지 않습니다. 모든 투자 및 거래 활동에는 위험이 수반되므로 독자는 결정을 내릴 때 스스로 조사해야 합니다.
 Cryptopolitan
 DogeHome
 crypto.ro English
 Crypto News Land
 ETHNews
 CFN
CFN U_Today
 Thecoinrepublic.com


