

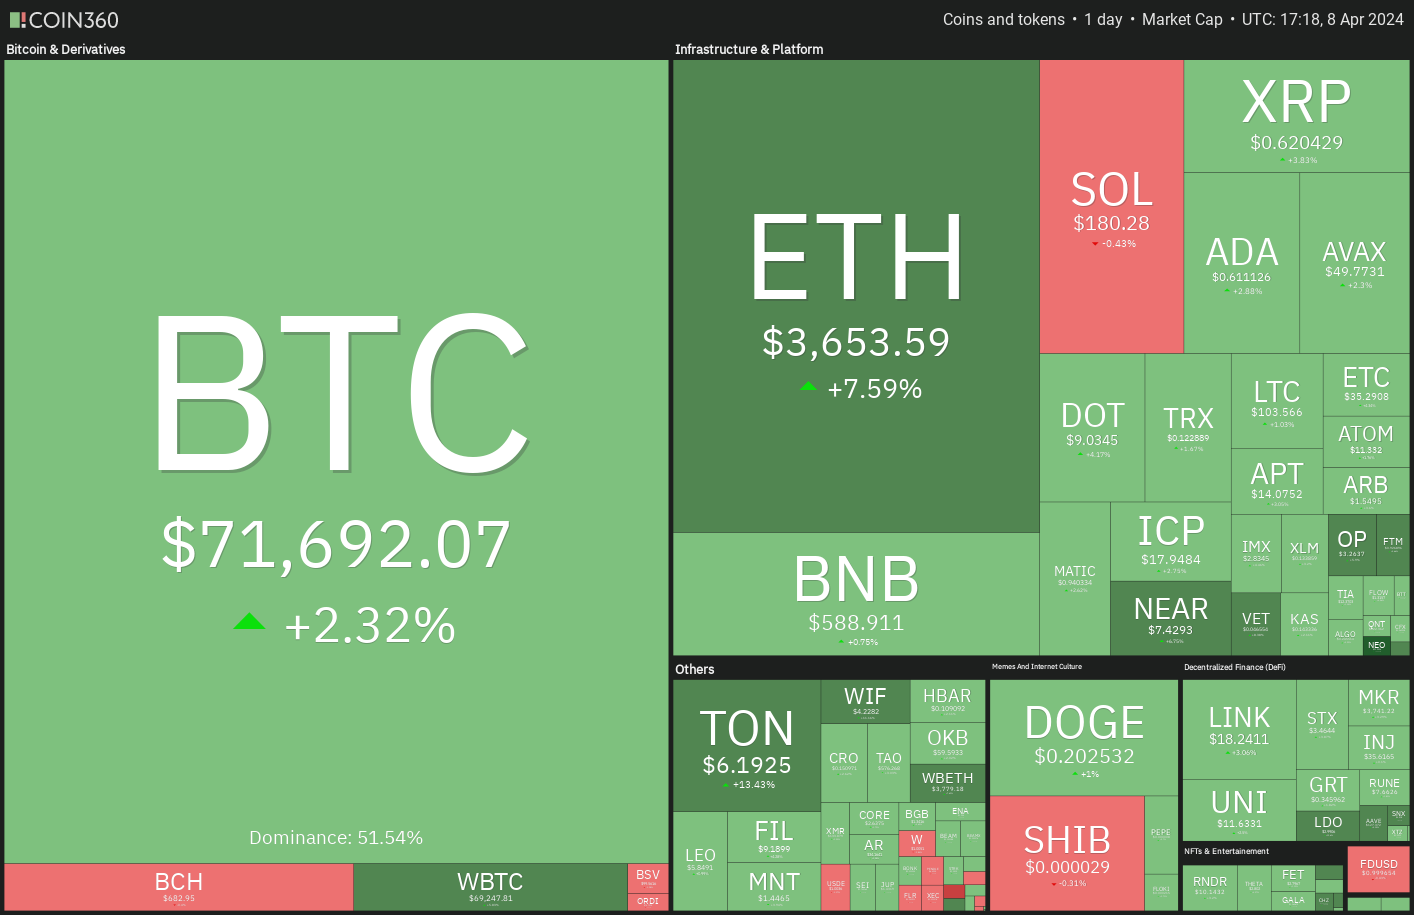
The Bitcoin halving is less than 11 days away and Bitcoin (BTC) is approaching the event with strength. This shows that the sentiment remains positive, and traders are buying on dips. CoinShares data shows digital investment products saw $646 million in inflows last week. That takes the year-to-date inflows to $13.8 billion, far higher than the $10.6 billion in 2021.
Faltan menos de 11 días para que Bitcoin se reduzca a la mitad y Bitcoin (BTC) se acerca al evento con fuerza. Esto muestra que el sentimiento sigue siendo positivo y los operadores están comprando en las caídas. Los datos de CoinShares muestran que los productos de inversión digital registraron entradas de 646 millones de dólares la semana pasada. Eso eleva las entradas en lo que va del año a 13.800 millones de dólares, muy por encima de los 10.600 millones de dólares de 2021.
On-chain analytics firm Santiment said in a X post that inflows into spot Bitcoin exchange-traded funds (ETFs) are likely to remain high until the Bitcoin halving. However, the firm added “it will be interesting to see whether a drop-off in ETF volume and on-chain volume will occur directly afterward.”
La firma de análisis en cadena Santiment dijo en una publicación de X que es probable que las entradas a fondos cotizados en bolsa (ETF) de Bitcoin al contado se mantengan altas hasta que Bitcoin se reduzca a la mitad. Sin embargo, la empresa añadió que "será interesante ver si se producirá una caída en el volumen de ETF y en el volumen en cadena inmediatamente después".
It is difficult to determine how the markets will behave just after halving, but analysts remain bullish on the long term. SkyBridge Capital CEO Anthony Scaramucci said in an interview with CNBC that Bitcoin could soar to $170,000 during the cycle. Eventually, he expects Bitcoin to trade at “half the valuation of gold” but warns of volatility en route.
Es difícil determinar cómo se comportarán los mercados justo después del halving, pero los analistas siguen siendo optimistas a largo plazo. El director ejecutivo de SkyBridge Capital, Anthony Scaramucci, dijo en una entrevista con CNBC que Bitcoin podría dispararse a 170.000 dólares durante el ciclo. Con el tiempo, espera que Bitcoin se negocie a "la mitad de la valoración del oro", pero advierte sobre la volatilidad en el camino.
What are the important resistance levels to watch out for in Bitcoin and altcoins? Let’s analyze the charts to find out.
¿Cuáles son los niveles de resistencia importantes a tener en cuenta en Bitcoin y altcoins? Analicemos los gráficos para averiguarlo.
S&P 500 Index price analysis
Análisis de precios del índice S&P 500
The S&P 500 Index made an outside-day candlestick pattern on April 4 and an inside-day candlestick pattern on April 5, indicating uncertainty about the next directional move.
El índice S&P 500 formó un patrón de velas exteriores el 4 de abril y un patrón de velas interiores el 5 de abril, lo que indica incertidumbre sobre el próximo movimiento direccional.
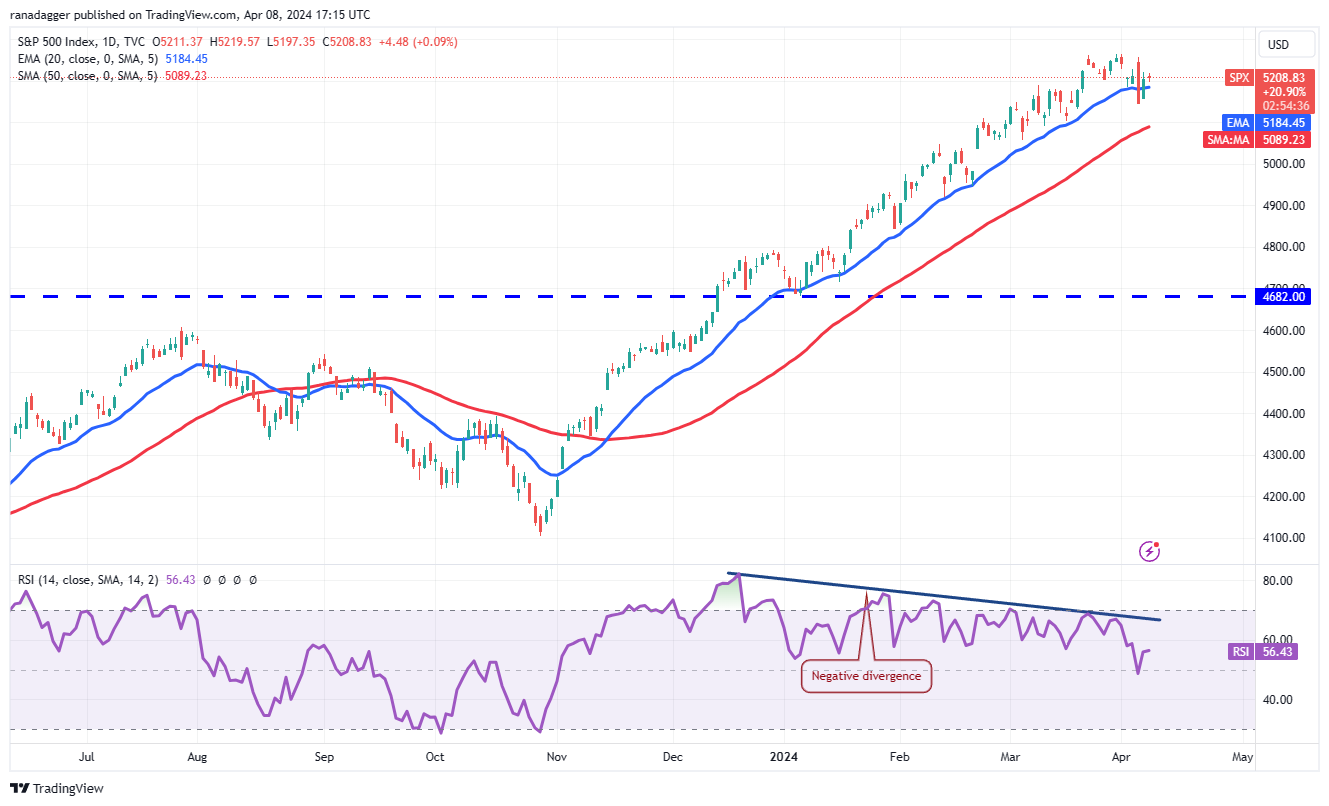
The 20-day exponential moving average (5,184) has flattened out, and the relative strength index (RSI) is in the positive zone, indicating a balance between supply and demand.
El promedio móvil exponencial de 20 días (5184) se ha estabilizado y el índice de fuerza relativa (RSI) está en la zona positiva, lo que indica un equilibrio entre la oferta y la demanda.
If the price turns lower and breaks below 5,146, it will signal the start of a corrective phase. The 50-day simple moving average (5,089) may try to arrest the decline, but it is likely to be broken.
Si el precio baja y cae por debajo de 5.146, señalará el inicio de una fase correctiva. La media móvil simple de 50 días (5.089) puede intentar detener la caída, pero es probable que se rompa.
Conversely, if the price continues higher and breaks above the all-time high of 5,265, the index will resume its uptrend. The next stop is likely to be 5,450.
Por el contrario, si el precio continúa subiendo y supera el máximo histórico de 5.265, el índice reanudará su tendencia alcista. Es probable que la próxima parada sea 5.450.
U.S. Dollar Index price analysis
Análisis de precios del índice del dólar estadounidense
The U.S. Dollar Index (DXY) turned down sharply from the 105 overhead resistance level on April 2, signaling that the bears are active at higher levels.
El índice del dólar estadounidense (DXY) bajó bruscamente desde el nivel de resistencia superior de 105 el 2 de abril, lo que indica que los bajistas están activos en niveles más altos.
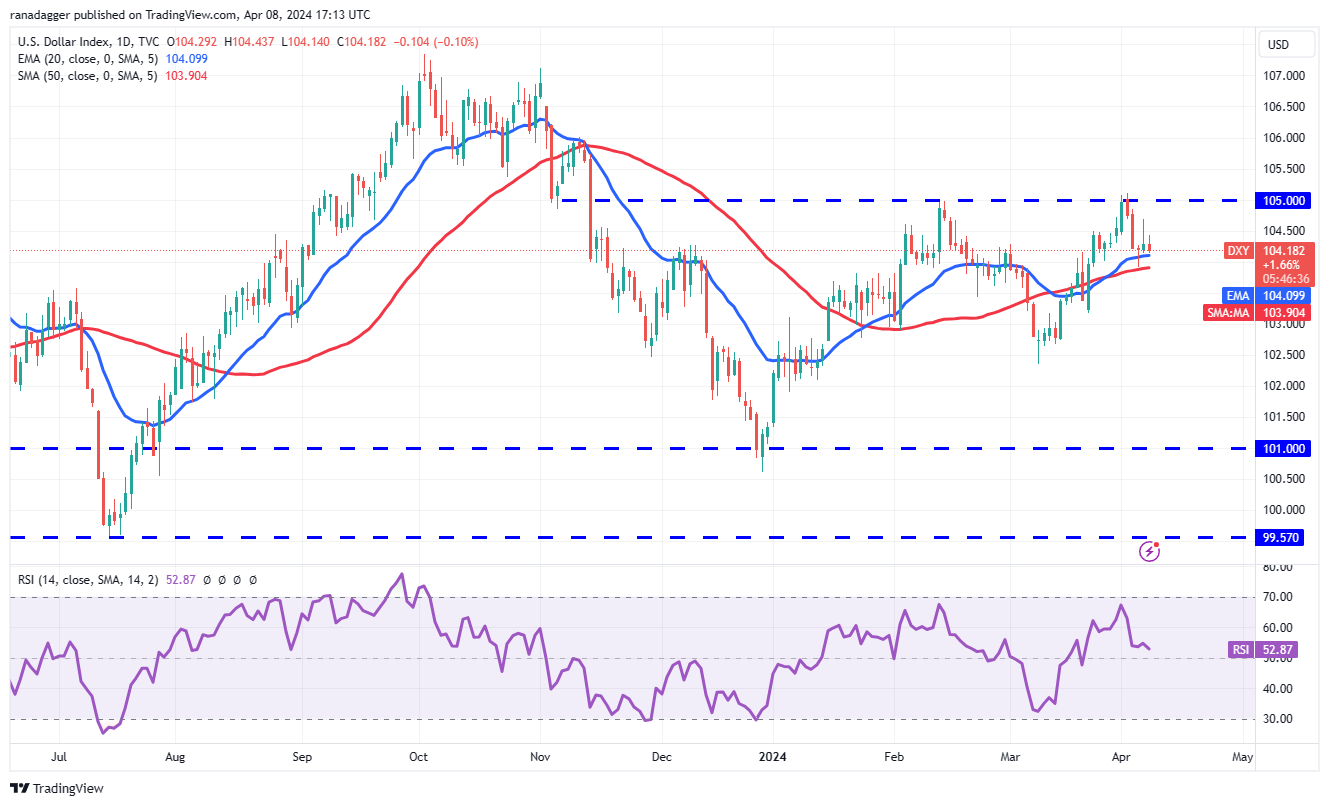
However, a minor advantage in favor of the bulls is that they did not allow the index to slide below the moving averages. This suggests that lower levels are being purchased. Selling at higher levels and buying on dips signals a possible range-bound action in the near term. The index may swing between the 50-day SMA (104) and 105 for some time.
Sin embargo, una pequeña ventaja a favor de los alcistas es que no permitieron que el índice cayera por debajo de las medias móviles. Esto sugiere que se están comprando niveles más bajos. Vender a niveles más altos y comprar en las caídas indica una posible acción dentro del rango en el corto plazo. El índice puede oscilar entre la SMA de 50 días (104) y 105 durante algún tiempo.
A break and close above 105 clears the path for a potential rally to 106 and then 107. On the contrary, a drop below the 50-day SMA could sink the index to 103 and subsequently to 102.
Una ruptura y un cierre por encima de 105 despeja el camino para un posible repunte a 106 y luego a 107. Por el contrario, una caída por debajo de la SMA de 50 días podría hundir el índice a 103 y posteriormente a 102.
Bitcoin price analysis
Análisis de precios de Bitcoin
Bitcoin broke above the symmetrical triangle pattern on April 8, indicating that the bulls have overpowered the bears.
Bitcoin superó el patrón de triángulo simétrico el 8 de abril, lo que indica que los alcistas han dominado a los bajistas.
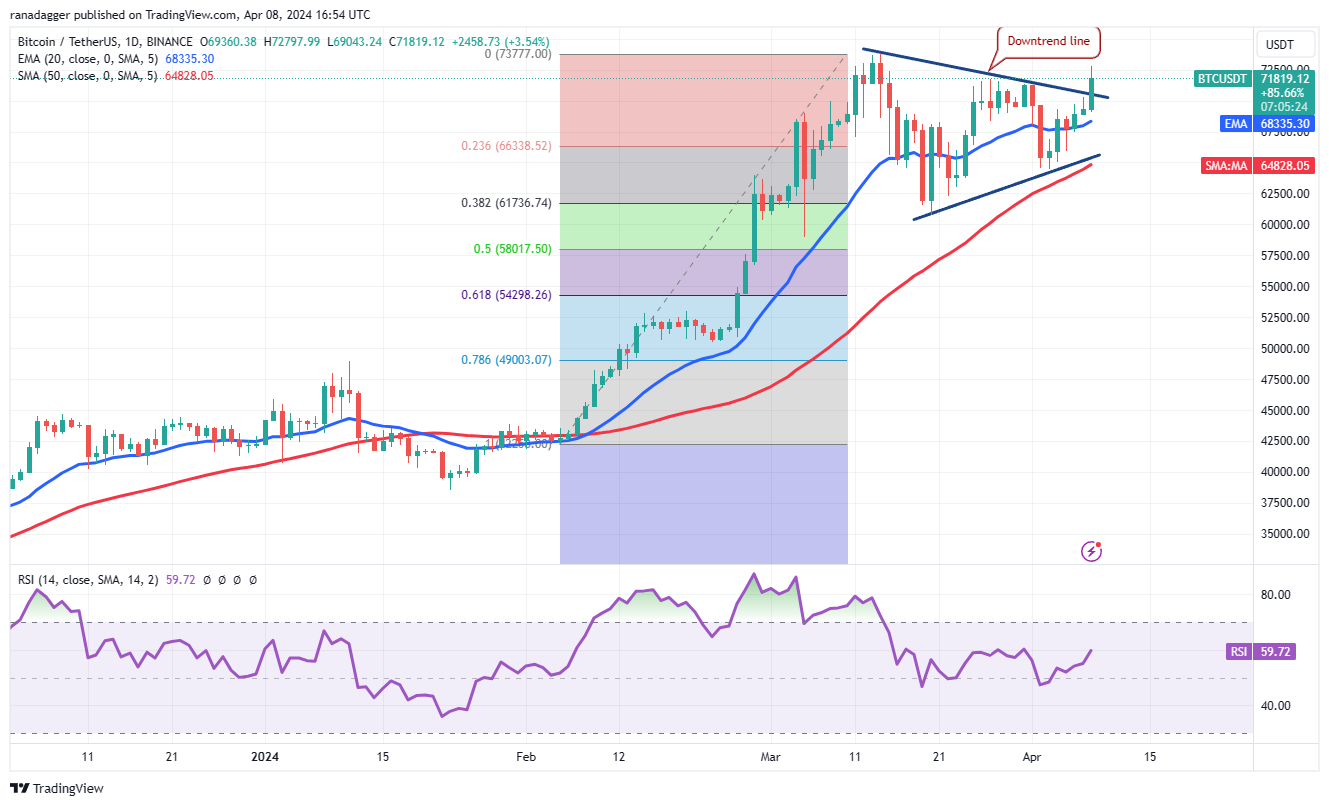
The BTC/USDT pair is likely to retest the all-time high of $73,777. This level may act as a significant barrier, but if the bulls overcome it, the pair could start the next leg of the uptrend toward the pattern target of $84,000.
Es probable que el par BTC/USDT vuelva a probar el máximo histórico de $73,777. Este nivel puede actuar como una barrera importante, pero si los alcistas lo superan, el par podría comenzar el siguiente tramo de la tendencia alcista hacia el objetivo del patrón de $84,000.
Time is running out for the bears. If they want to make a comeback, they will have to quickly pull the price back below the 20-day EMA ($68,335). If that happens, the pair may plunge to the 50-day SMA ($64,828).
A los osos se les acaba el tiempo. Si quieren regresar, tendrán que bajar rápidamente el precio por debajo de la EMA de 20 días ($68,335). Si eso sucede, el par puede caer hasta la SMA de 50 días ($64,828).
Ether price analysis
Análisis de precios de éter
Ether (ETH) has been trading between $3,056 and $3,679 for several days, indicating indecision between the bulls and the bears.
Ether (ETH) ha estado cotizando entre $3,056 y $3,679 durante varios días, lo que indica indecisión entre los alcistas y los bajistas.
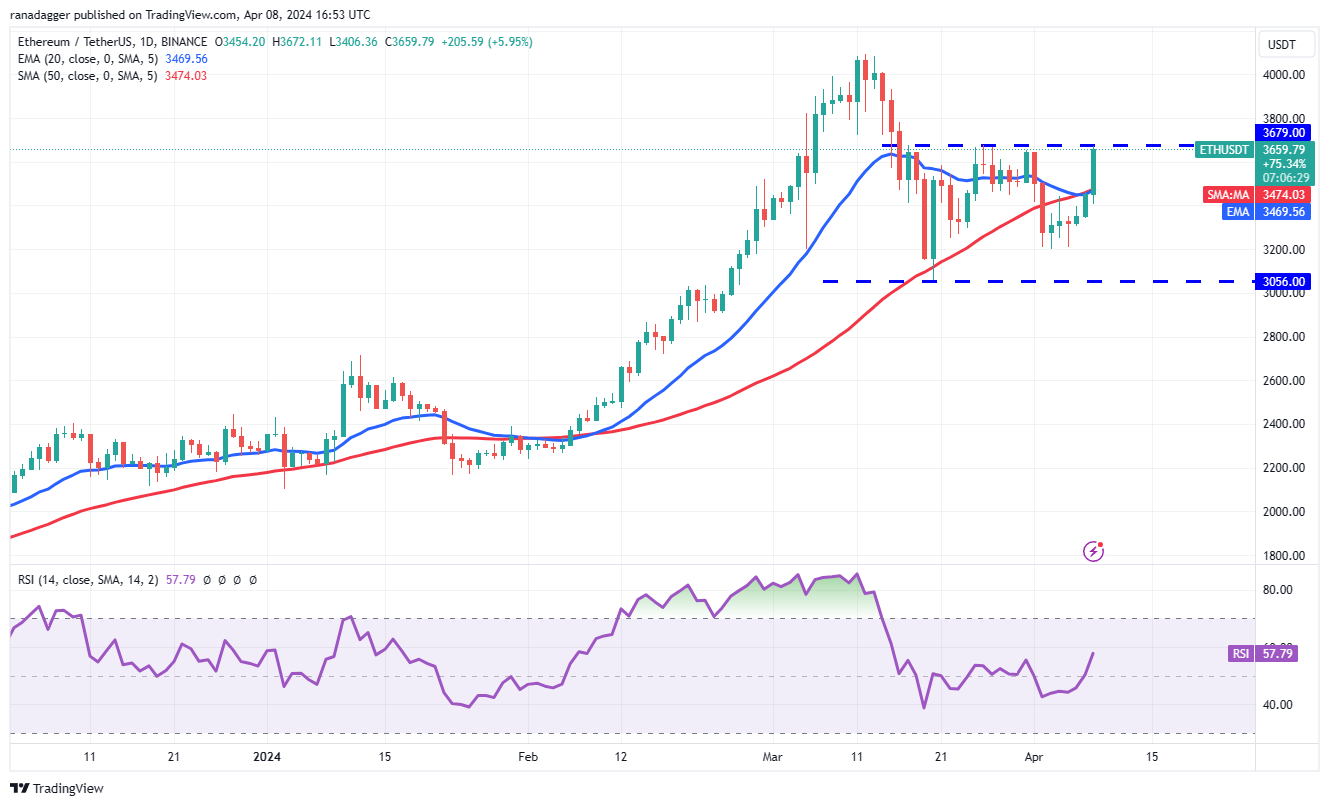
The ETH/USDT pair has reached the overhead resistance of $3,679, an important level to keep an eye on. If buyers overcome this obstacle, the pair could pick up momentum and rally to $4,093. The bears are expected to fiercely defend this level, but if the bulls prevail, the pair could start the next leg of the uptrend toward $4,488.
El par ETH/USDT ha alcanzado la resistencia superior de $3,679, un nivel importante al que hay que prestar atención. Si los compradores superan este obstáculo, el par podría cobrar impulso y subir a 4.093 dólares. Se espera que los bajistas defiendan ferozmente este nivel, pero si los alcistas prevalecen, el par podría comenzar el siguiente tramo de la tendencia alcista hacia los USD 4,488.
Contrary to this assumption, if the price turns down sharply from $3,679 and breaks below the 20-day EMA, it will indicate that the range-bound action may continue for a while longer.
Contrariamente a esta suposición, si el precio cae bruscamente desde $ 3,679 y cae por debajo de la EMA de 20 días, indicará que la acción dentro del rango puede continuar por un tiempo más.
BNB price analysis
Análisis de precios de BNB
BNB (BNB) continues to trade inside the symmetrical triangle pattern, indicating a balance between supply and demand.
BNB (BNB) continúa operando dentro del patrón de triángulo simétrico, lo que indica un equilibrio entre oferta y demanda.
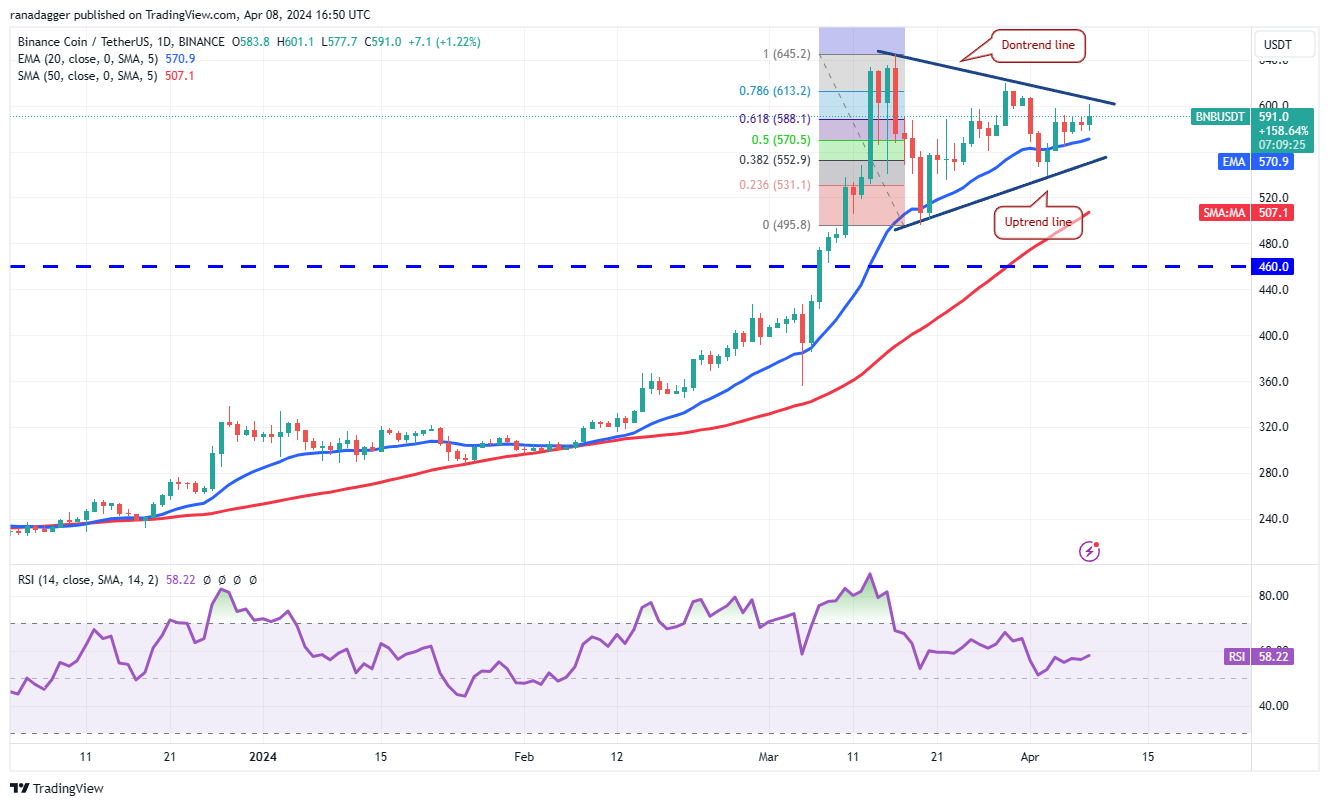
The 20-day EMA ($570) is moving up gradually, and the RSI is in the positive territory, indicating that the bulls are at a minor advantage. The BNB/USDT pair has reached the downtrend line of the triangle. If this resistance is overcome, the pair could retest the March 16 high at $645.
La EMA de 20 días ($570) está subiendo gradualmente y el RSI está en territorio positivo, lo que indica que los alcistas tienen una ventaja menor. El par BNB/USDT ha alcanzado la línea de tendencia bajista del triángulo. Si se supera esta resistencia, el par podría volver a probar el máximo del 16 de marzo en 645 dólares.
On the contrary, if the price turns down from the downtrend line, it will suggest that the pair may remain inside the triangle for a few more days. The bears will be in a commanding position if the price plunges below the triangle.
Por el contrario, si el precio baja desde la línea de tendencia bajista, sugerirá que el par puede permanecer dentro del triángulo durante unos días más. Los bajistas estarán en una posición dominante si el precio cae por debajo del triángulo.
Solana price analysis
Análisis de precios de Solana
The bulls are struggling to sustain Solana (SOL) above the 20-day EMA ($181), indicating that the bears are defending the level.
Los alcistas están luchando por mantener a Solana (SOL) por encima de la EMA de 20 días (USD 181), lo que indica que los bajistas están defendiendo el nivel.
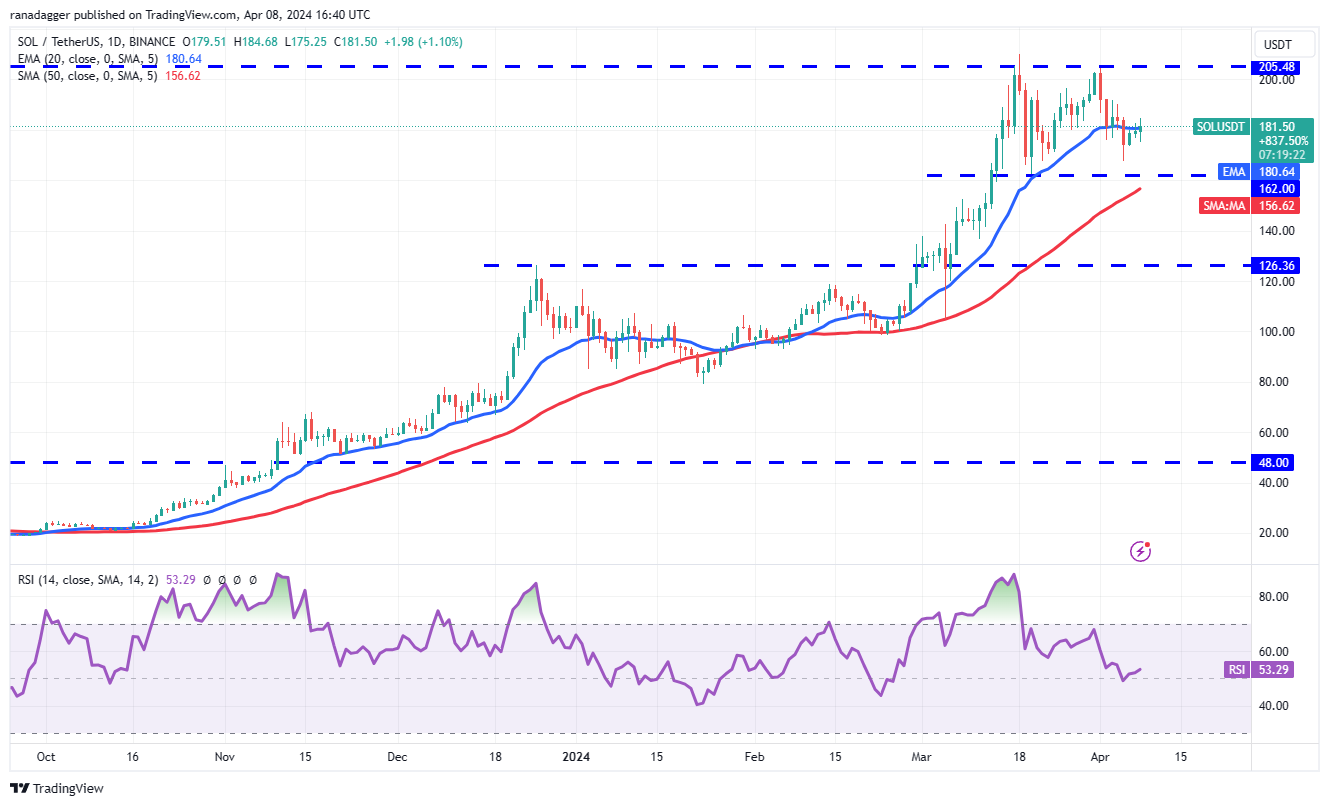
If the price turns down from the current level, the SOL/USDT pair could drop to the critical support at $162. The bulls are expected to vigorously protect this level because failing to do that could open the gates for a fall to $126.
Si el precio baja desde el nivel actual, el par SOL/USDT podría caer al soporte crítico de $162. Se espera que los alcistas protejan vigorosamente este nivel porque, de no hacerlo, se podrían abrir las puertas a una caída a 126 dólares.
Alternatively, if the price rebounds off $162 and rises above the 20-day EMA, it will signal that the pair may extend its stay inside the $162 to $205 range for some more time. The next leg of the uptrend could begin on a break above $205.
Alternativamente, si el precio rebota en $162 y sube por encima de la EMA de 20 días, indicará que el par puede extender su permanencia dentro del rango de $162 a $205 por algún tiempo más. El siguiente tramo de la tendencia alcista podría comenzar con una ruptura por encima de 205 dólares.
XRP price analysis
Análisis de precios XRP
The failure of the bears to capitalize on XRP’s (XRP) fall below the uptrend line may have attracted buyers who pushed the price above the moving averages on April 8.
El hecho de que los bajistas no capitalizaran la caída de XRP (XRP) por debajo de la línea de tendencia alcista puede haber atraído a compradores que empujaron el precio por encima de los promedios móviles el 8 de abril.
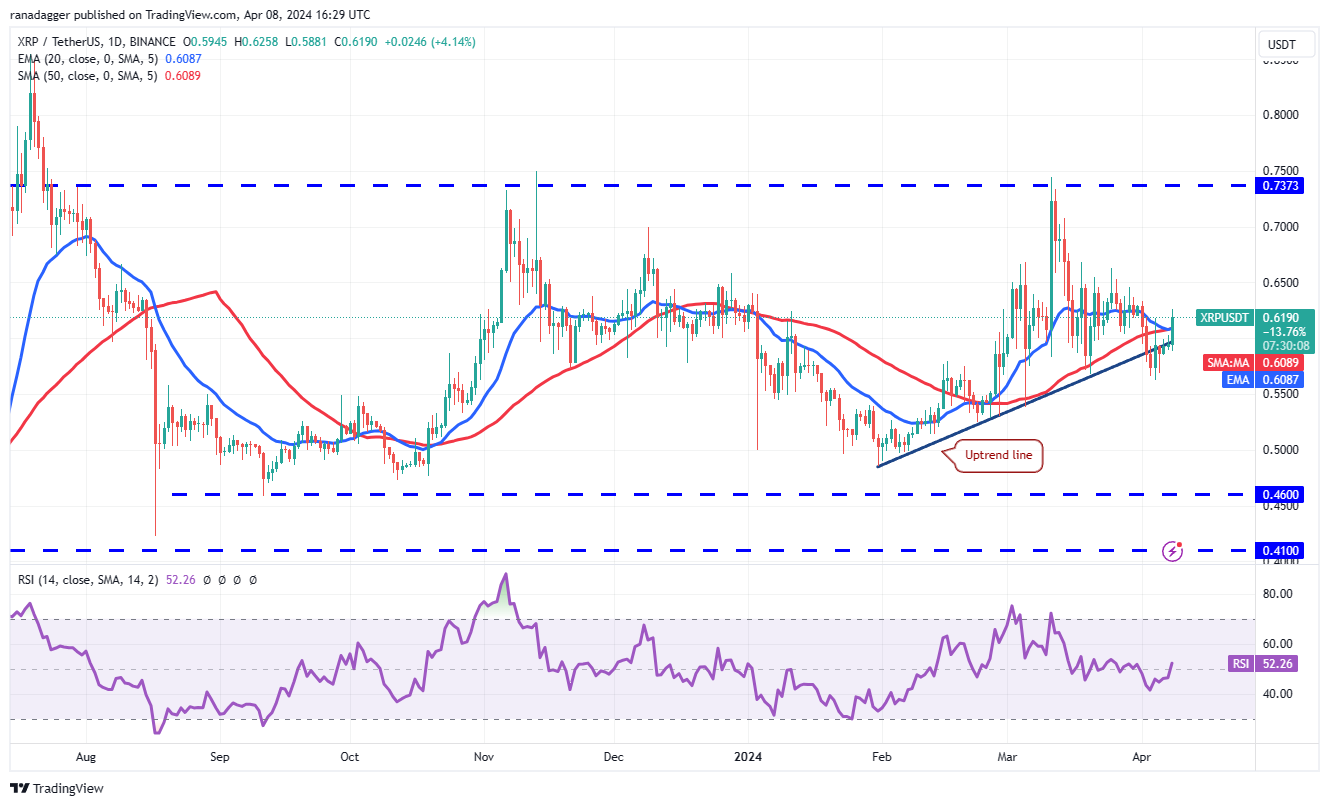
The flattish moving averages and the RSI just above the midpoint suggest a range-bound action in the near term. The XRP/USDT pair could swing between $0.56 and $0.69 for a few more days.
Los promedios móviles planos y el RSI justo por encima del punto medio sugieren una acción dentro del rango en el corto plazo. El par XRP/USDT podría oscilar entre $0,56 y $0,69 durante unos días más.
Buyers will have to kick the price above $0.69 to enhance the prospects of a rally to the formidable resistance at $0.74. Instead, if bears want to take charge, they will have to sink and sustain the price below $0.56. The pair may then plunge to $0.52 and subsequently to $0.48.
Los compradores tendrán que elevar el precio por encima de 0,69 dólares para mejorar las perspectivas de un repunte hasta la formidable resistencia de 0,74 dólares. En cambio, si los bajistas quieren tomar el control, tendrán que hundirse y mantener el precio por debajo de 0,56 dólares. Luego, el par puede caer a 0,52 dólares y posteriormente a 0,48 dólares.
Related: Here’s what happened in crypto today
Relacionado: Esto es lo que sucedió hoy en las criptomonedas
Dogecoin price analysis
Análisis de precios de Dogecoin
Dogecoin (DOGE) jumped back above the 20-day EMA ($0.18) on April 6 and continued the move higher to rise above $0.19 on April 7.
Dogecoin (DOGE) volvió a saltar por encima de la EMA de 20 días ($0,18) el 6 de abril y continuó el movimiento hacia arriba para superar los $0,19 el 7 de abril.
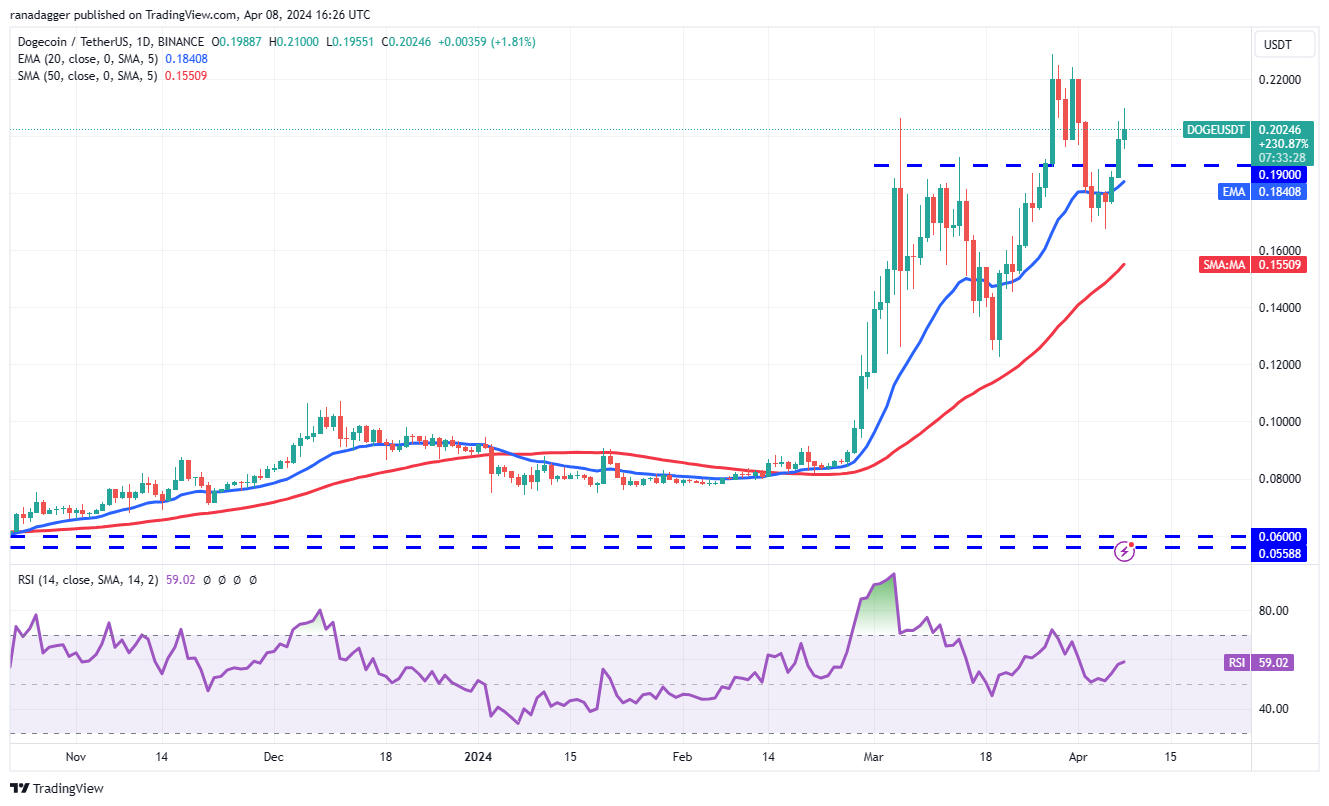
The bulls will try to maintain the momentum and push the price toward the overhead resistance at $0.23. A break and close above this level will signal the resumption of the uptrend. The DOGE/USDT pair will then attempt a rally to $0.30.
Los alcistas intentarán mantener el impulso y empujar el precio hacia la resistencia superior de 0,23 dólares. Una ruptura y un cierre por encima de este nivel señalarán la reanudación de la tendencia alcista. El par DOGE/USDT intentará subir a USD 0,30.
On the contrary, if the price slips back below the 20-day EMA, it will suggest that bears remain active at higher levels. That will increase the likelihood of a drop to the 50-day SMA ($0.15).
Por el contrario, si el precio vuelve a caer por debajo de la EMA de 20 días, sugerirá que los bajistas permanecen activos en niveles más altos. Eso aumentará la probabilidad de una caída a la SMA de 50 días ($0,15).
Cardano price analysis
Análisis de precios de Cardano
The bulls successfully held Cardano (ADA) above $0.57 in the past few days and pushed the price to the 20-day EMA ($0.62) on April 8.
Los alcistas mantuvieron con éxito a Cardano (ADA) por encima de 0,57 dólares en los últimos días y llevaron el precio a la EMA de 20 días (0,62 dólares) el 8 de abril.
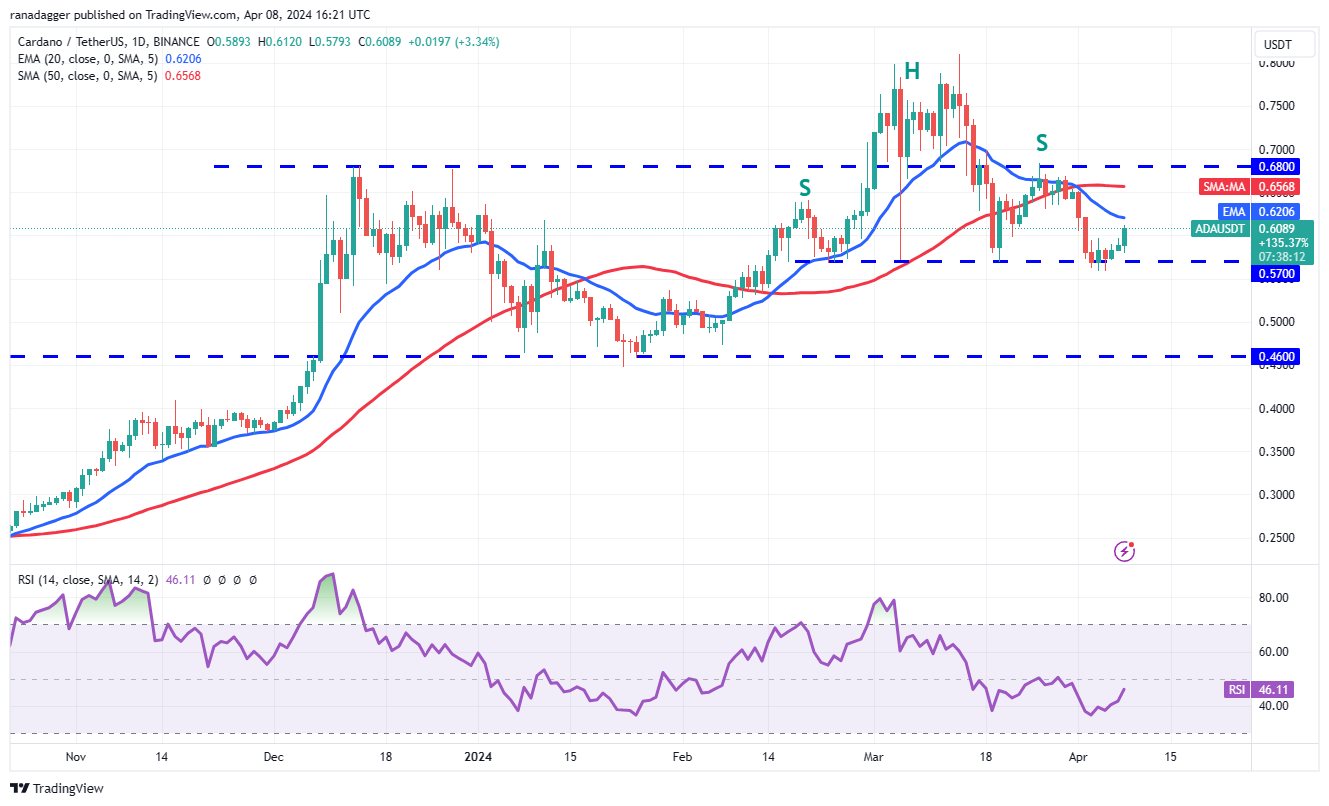
If the price turns down from the 20-day EMA, it will signal that the bears are in command. The sellers will try to sink the price below $0.57. If they manage to do that, the ADA/USDT pair will complete a bearish head-and-shoulders pattern. That could start a downward move toward the next major support at $0.46.
Si el precio baja desde la EMA de 20 días, indicará que los bajistas están al mando. Los vendedores intentarán bajar el precio por debajo de 0,57 dólares. Si logran hacer eso, el par ADA/USDT completará un patrón bajista de cabeza y hombros. Eso podría iniciar un movimiento a la baja hacia el próximo soporte importante en 0,46 dólares.
The first sign of strength will be a break and close above the 20-day EMA. That will open the doors for a rise to $0.68. Buyers will have to overcome this barrier to increase the possibility of a rally to $0.81.
La primera señal de fortaleza será una ruptura y un cierre por encima de la EMA de 20 días. Eso abrirá las puertas a una subida a 0,68 dólares. Los compradores tendrán que superar esta barrera para aumentar la posibilidad de un repunte a 0,81 dólares.
Toncoin price analysis
Análisis de precios de Toncoin
Toncoin (TON) skyrocketed above the $5.50 to $5.69 overhead resistance zone on April 8, indicating the start of the next leg of the uptrend.
Toncoin (TON) se disparó por encima de la zona de resistencia superior de $ 5,50 a $ 5,69 el 8 de abril, lo que indica el inicio del siguiente tramo de la tendencia alcista.
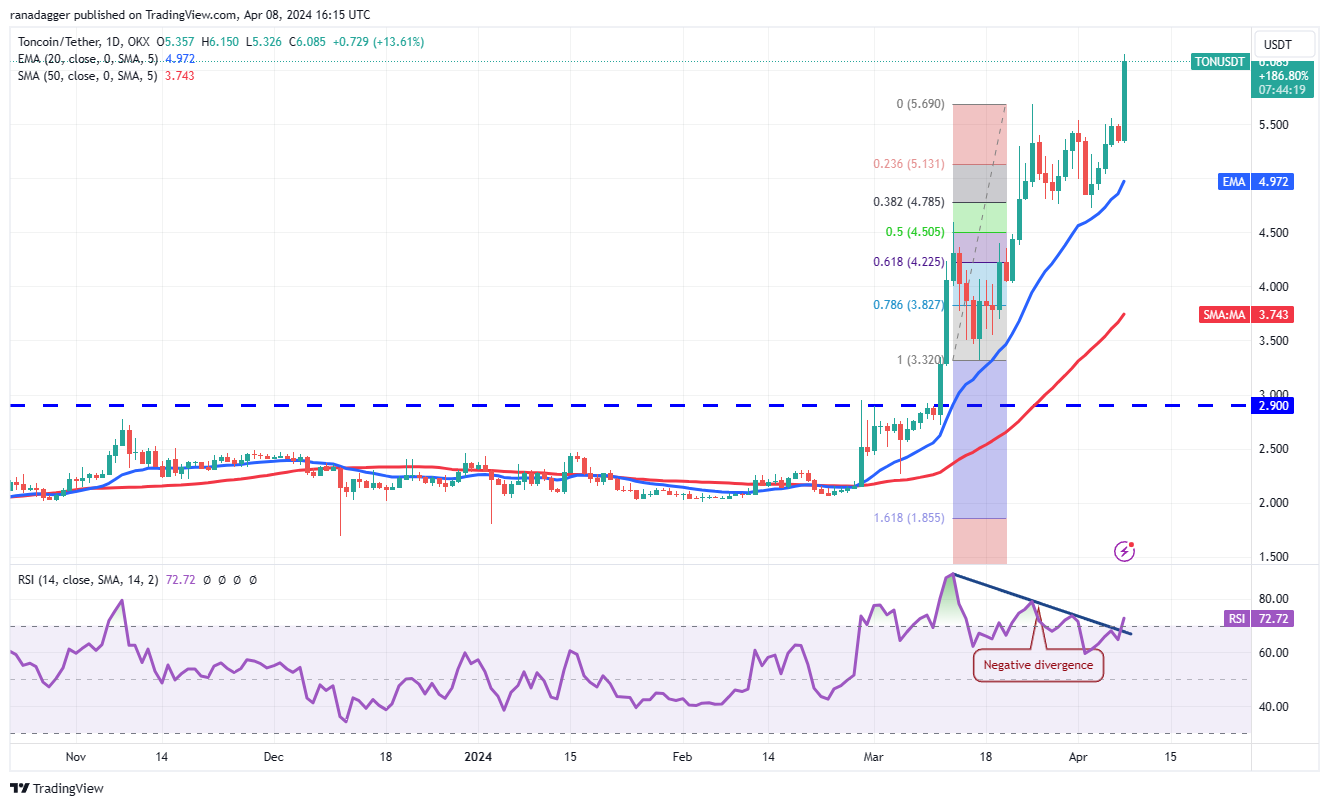
If buyers maintain the price above $5.69, the TON/USDT pair could rally to the next target objective at $7.09. The upsloping moving averages and the RSI in the overbought zone indicate that the bulls are in control.
Si los compradores mantienen el precio por encima de USD 5,69, el par TON/USDT podría subir al siguiente objetivo en USD 7,09. Las medias móviles ascendentes y el RSI en la zona de sobrecompra indican que los alcistas tienen el control.
The bears will have to tug the price below $5.50 to trap the aggressive bulls. That could result in long liquidation, threatening the 20-day EMA ($4.97). If this level gives way, the pair may slump to $4.72 and then to the 61.8% Fibonacci retracement level of $4.22.
Los bajistas tendrán que bajar el precio por debajo de 5,50 dólares para atrapar a los alcistas agresivos. Eso podría resultar en una liquidación larga, amenazando a la EMA de 20 días ($4,97). Si este nivel cede, el par puede caer a 4,72 dólares y luego al nivel de retroceso de Fibonacci del 61,8% de 4,22 dólares.
This article does not contain investment advice or recommendations. Every investment and trading move involves risk, and readers should conduct their own research when making a decision.
Este artículo no contiene consejos ni recomendaciones de inversión. Cada movimiento de inversión y comercio implica riesgos, y los lectores deben realizar su propia investigación al tomar una decisión.
 U_Today
 Thecoinrepublic.com
 DogeHome
 Optimisus
 Optimisus
 DeFi Planet
 Crypto Daily™
 BlockchainReporter
 TheCoinrise Media


