

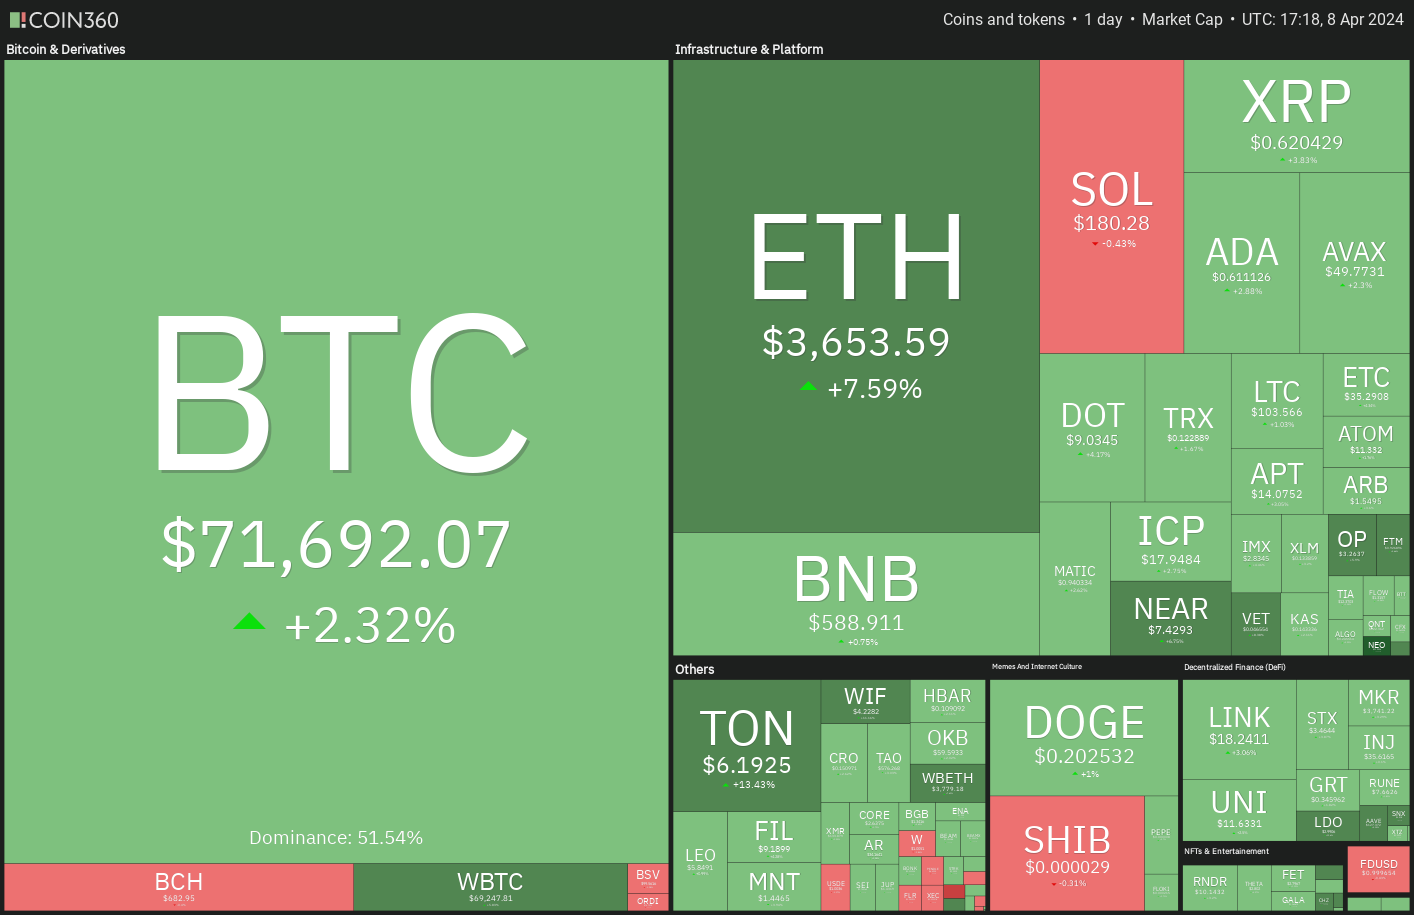
The Bitcoin halving is less than 11 days away and Bitcoin (BTC) is approaching the event with strength. This shows that the sentiment remains positive, and traders are buying on dips. CoinShares data shows digital investment products saw $646 million in inflows last week. That takes the year-to-date inflows to $13.8 billion, far higher than the $10.6 billion in 2021.
距離比特幣減半還有不到 11 天的時間,比特幣 (BTC) 正在強勢接近這一事件。這顯示市場情緒依然樂觀,交易員逢低買進。 CoinShares 數據顯示,數位投資產品上週流入 6.46 億美元。這使得年初至今的資金流入達到 138 億美元,遠高於 2021 年的 106 億美元。
On-chain analytics firm Santiment said in a X post that inflows into spot Bitcoin exchange-traded funds (ETFs) are likely to remain high until the Bitcoin halving. However, the firm added “it will be interesting to see whether a drop-off in ETF volume and on-chain volume will occur directly afterward.”
鏈上分析公司 Santiment 在 X 貼文中表示,在比特幣減半之前,流入現貨比特幣交易所交易基金(ETF)的資金可能會保持在較高水準。然而,該公司補充說,“看看 ETF 交易量和鏈上交易量是否會在之後立即出現下降,將會很有趣。”
It is difficult to determine how the markets will behave just after halving, but analysts remain bullish on the long term. SkyBridge Capital CEO Anthony Scaramucci said in an interview with CNBC that Bitcoin could soar to $170,000 during the cycle. Eventually, he expects Bitcoin to trade at “half the valuation of gold” but warns of volatility en route.
很難確定減半後市場將如何表現,但分析師仍看好長期前景。 SkyBridge Capital 執行長 Anthony Scaramucci 在接受 CNBC 採訪時表示,比特幣在周期內可能飆升至 17 萬美元。最終,他預計比特幣的交易價格將是“黃金估值的一半”,但警告比特幣的波動性。
What are the important resistance levels to watch out for in Bitcoin and altcoins? Let’s analyze the charts to find out.
比特幣和山寨幣需要注意哪些重要阻力位?讓我們分析一下圖表來找出答案。
S&P 500 Index price analysis
標普 500 指數價格分析
The S&P 500 Index made an outside-day candlestick pattern on April 4 and an inside-day candlestick pattern on April 5, indicating uncertainty about the next directional move.
標準普爾 500 指數在 4 月 4 日形成了日外燭台形態,並在 4 月 5 日形成了日內燭台形態,顯示下一步走勢存在不確定性。
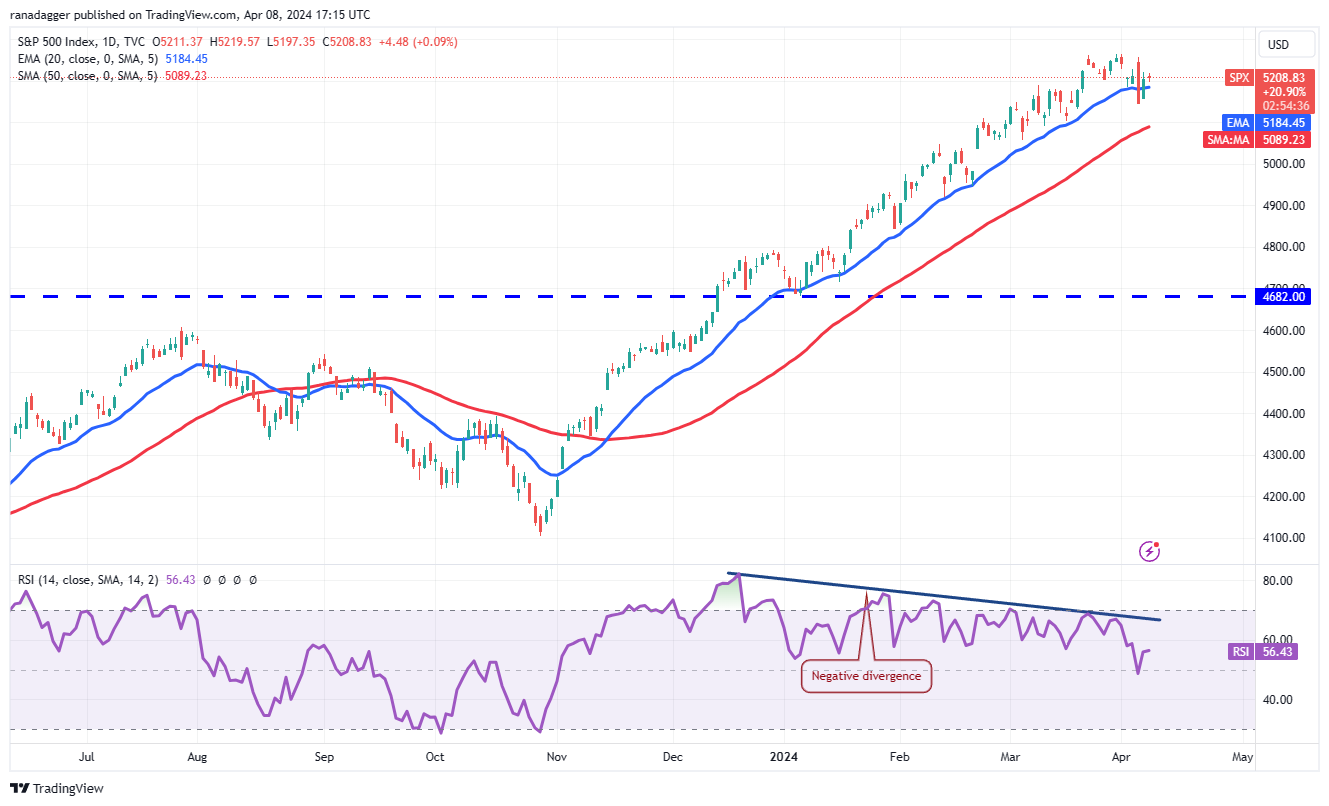
The 20-day exponential moving average (5,184) has flattened out, and the relative strength index (RSI) is in the positive zone, indicating a balance between supply and demand.
20日指數移動平均線(5,184)已趨於平緩,相對強弱指數(RSI)為正值區域,顯示供需平衡。
If the price turns lower and breaks below 5,146, it will signal the start of a corrective phase. The 50-day simple moving average (5,089) may try to arrest the decline, but it is likely to be broken.
如果價格下跌並跌破 5,146,則將標誌著調整階段的開始。 50日簡單移動平均線(5,089)可能會試圖阻止跌勢,但很可能會被突破。
Conversely, if the price continues higher and breaks above the all-time high of 5,265, the index will resume its uptrend. The next stop is likely to be 5,450.
相反,如果價格繼續走高並突破歷史高點5,265,則該指數將恢復上升趨勢。下一站很可能是5,450。
U.S. Dollar Index price analysis
美元指數價格分析
The U.S. Dollar Index (DXY) turned down sharply from the 105 overhead resistance level on April 2, signaling that the bears are active at higher levels.
美元指數 (DXY) 從 4 月 2 日的 105 上方阻力位大幅下跌,顯示空頭在更高水平上活躍。
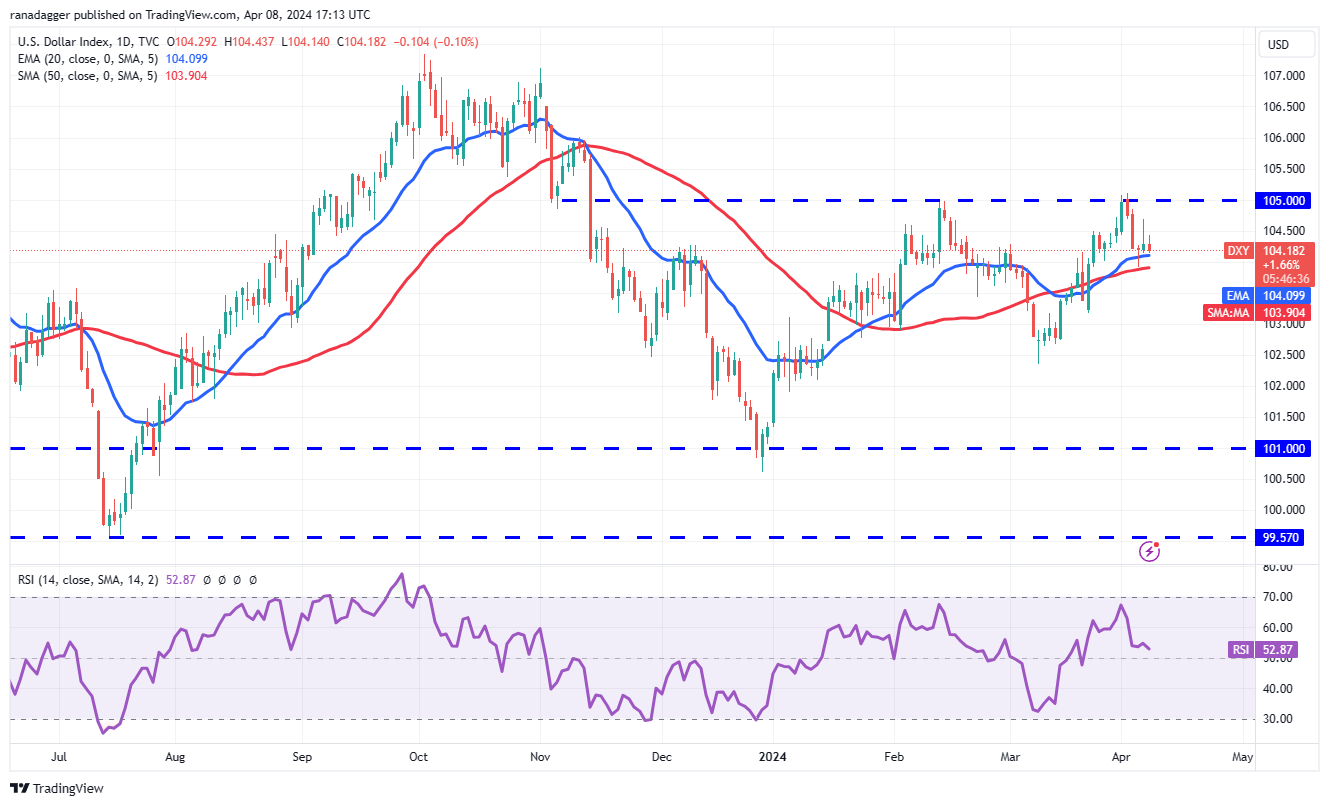
However, a minor advantage in favor of the bulls is that they did not allow the index to slide below the moving averages. This suggests that lower levels are being purchased. Selling at higher levels and buying on dips signals a possible range-bound action in the near term. The index may swing between the 50-day SMA (104) and 105 for some time.
然而,有利於多頭的一個小優勢是,他們不允許指數跌破移動平均線。這表明正在購買較低水平的產品。高位賣出和逢低買入預示著近期可能出現區間波動。該指數可能會在50日移動平均線(104)和105之間波動一段時間。
A break and close above 105 clears the path for a potential rally to 106 and then 107. On the contrary, a drop below the 50-day SMA could sink the index to 103 and subsequently to 102.
突破並收盤於 105 上方,將為潛在反彈至 106 和 107 掃清道路。相反,跌破 50 日移動平均線可能會使該指數跌至 103,隨後跌至 102。
Bitcoin price analysis
比特幣價格分析
Bitcoin broke above the symmetrical triangle pattern on April 8, indicating that the bulls have overpowered the bears.
4 月 8 日,比特幣突破對稱三角形形態,顯示多頭戰勝了空頭。
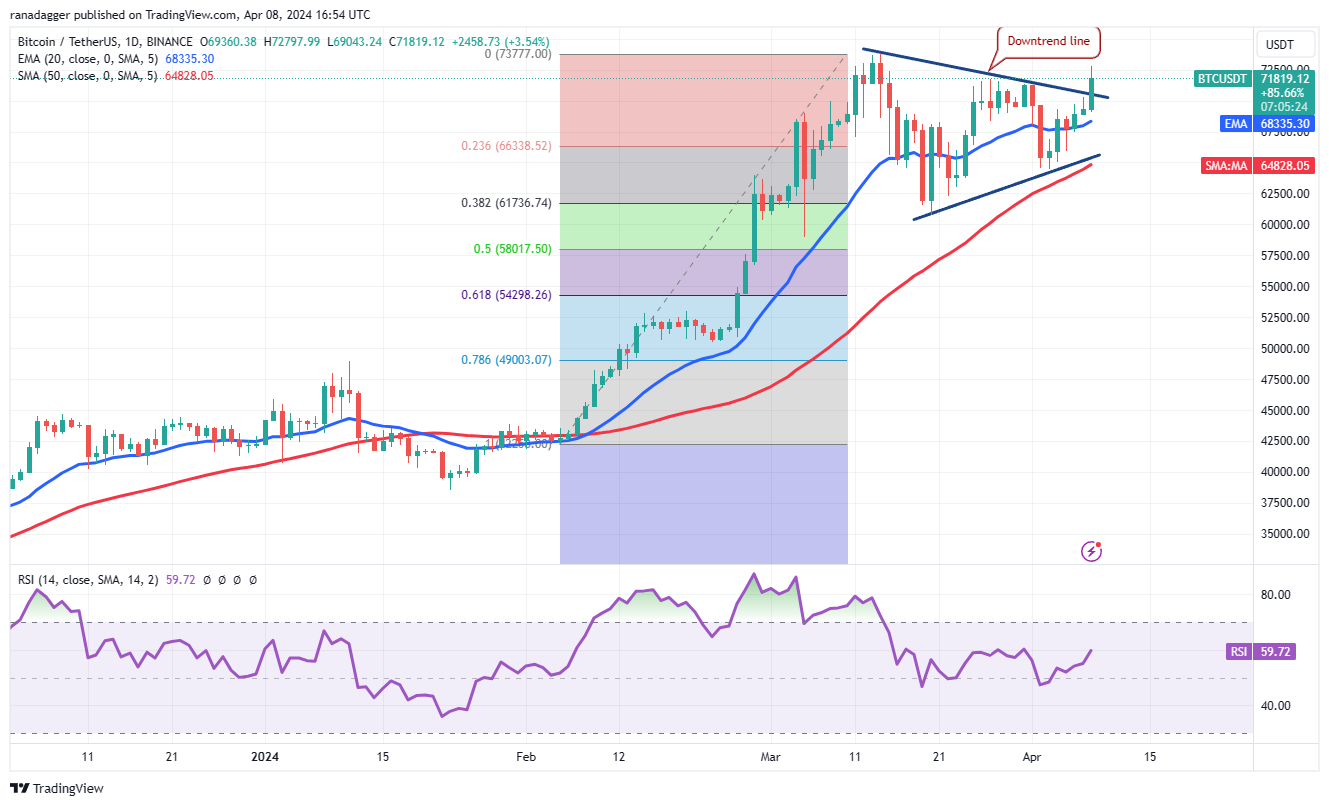
The BTC/USDT pair is likely to retest the all-time high of $73,777. This level may act as a significant barrier, but if the bulls overcome it, the pair could start the next leg of the uptrend toward the pattern target of $84,000.
BTC/USDT 貨幣對可能會重新測試 73,777 美元的歷史高點。該水平可能是一個重要的障礙,但如果多頭克服它,該貨幣對可能會開始下一階段的上升趨勢,朝向 84,000 美元的模式目標。
Time is running out for the bears. If they want to make a comeback, they will have to quickly pull the price back below the 20-day EMA ($68,335). If that happens, the pair may plunge to the 50-day SMA ($64,828).
留給熊的時間已經不多了。如果他們想東山再起,就必須迅速將價格拉回 20 日均線(68,335 美元)以下。如果發生這種情況,該貨幣對可能會暴跌至 50 日移動平均線(64,828 美元)。
Ether price analysis
以太幣價格分析
Ether (ETH) has been trading between $3,056 and $3,679 for several days, indicating indecision between the bulls and the bears.
以太坊(ETH)連續幾天在 3,056 美元至 3,679 美元之間交易,表明多頭和空頭之間猶豫不決。
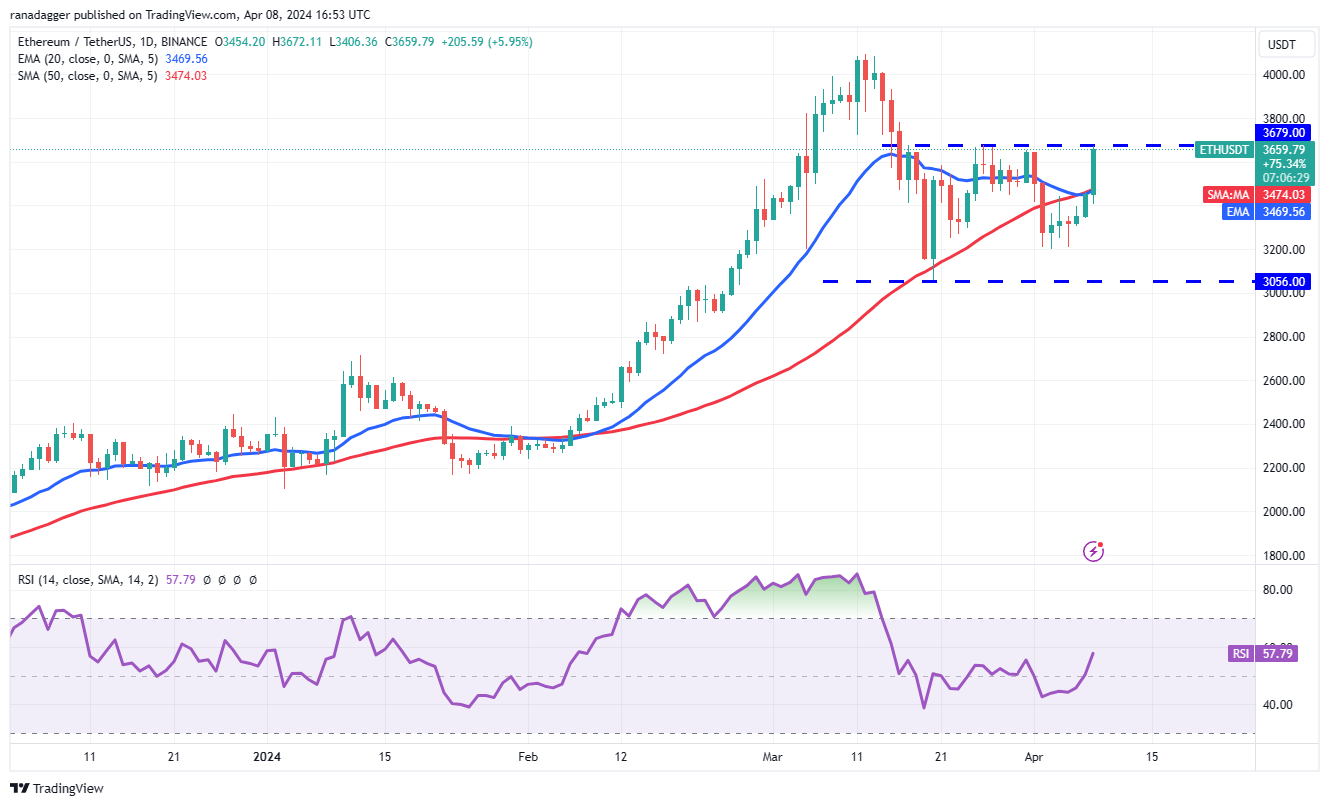
The ETH/USDT pair has reached the overhead resistance of $3,679, an important level to keep an eye on. If buyers overcome this obstacle, the pair could pick up momentum and rally to $4,093. The bears are expected to fiercely defend this level, but if the bulls prevail, the pair could start the next leg of the uptrend toward $4,488.
ETH/USDT 貨幣對已達到上方阻力位 3,679 美元,這是一個值得關注的重要水平。如果買家克服這一障礙,該貨幣對可能會加速上漲至 4,093 美元。預計空頭將激烈捍衛這一水平,但如果多頭獲勝,該貨幣對可能會開始下一階段的上升趨勢,升至 4,488 美元。
Contrary to this assumption, if the price turns down sharply from $3,679 and breaks below the 20-day EMA, it will indicate that the range-bound action may continue for a while longer.
與這一假設相反,如果價格從 3,679 美元大幅下跌並跌破 20 日均線,則表明區間波動可能會持續一段時間。
BNB price analysis
BNB價格分析
BNB (BNB) continues to trade inside the symmetrical triangle pattern, indicating a balance between supply and demand.
BNB(BNB)繼續在對稱三角形格局內交易,顯示供需平衡。
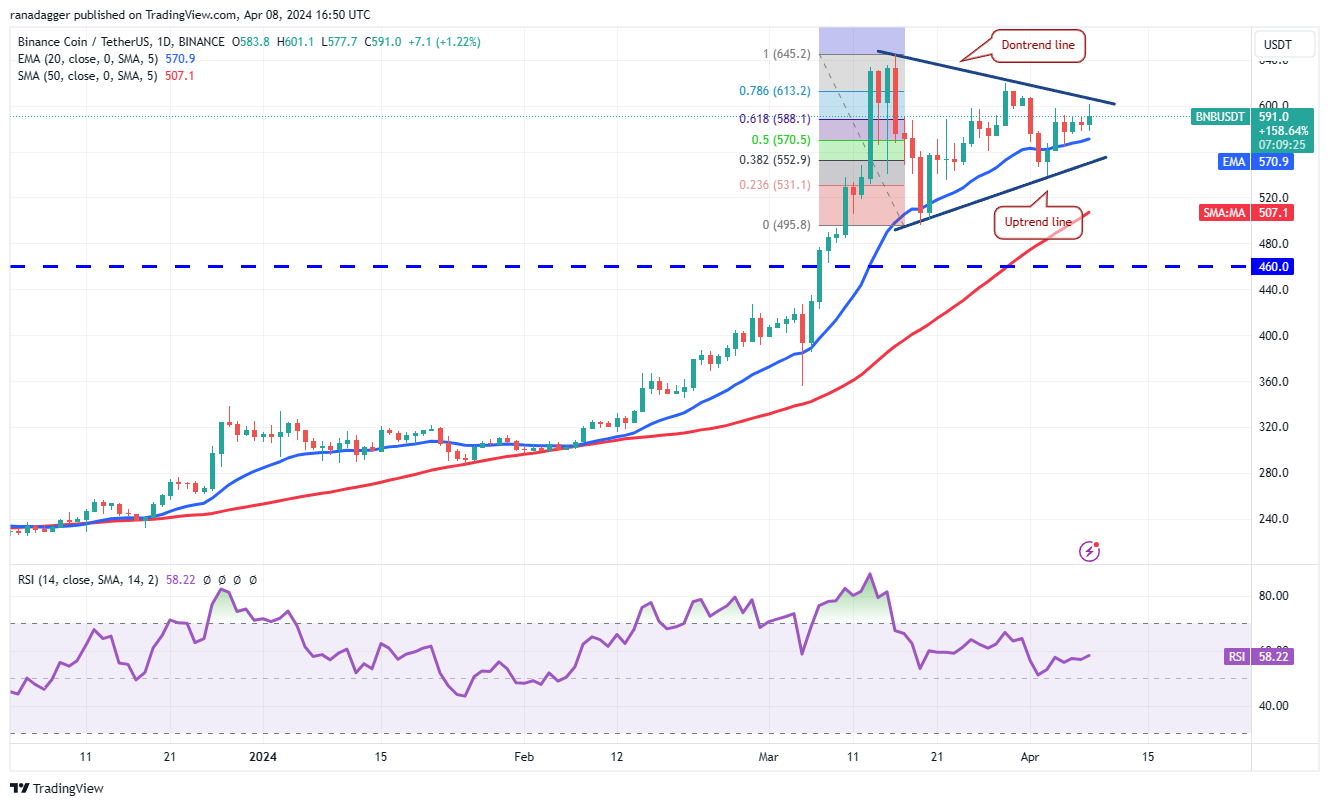
The 20-day EMA ($570) is moving up gradually, and the RSI is in the positive territory, indicating that the bulls are at a minor advantage. The BNB/USDT pair has reached the downtrend line of the triangle. If this resistance is overcome, the pair could retest the March 16 high at $645.
20 日均線(570 美元)逐漸上升,RSI 處於正值區域,表明多頭處於較小優勢。 BNB/USDT 貨幣對已到達三角形的下降趨勢線。如果克服這一阻力,該貨幣對可能會重新測試 3 月 16 日的高點 645 美元。
On the contrary, if the price turns down from the downtrend line, it will suggest that the pair may remain inside the triangle for a few more days. The bears will be in a commanding position if the price plunges below the triangle.
相反,如果價格從下降趨勢線轉向下跌,則表示該貨幣對可能會在三角形內停留幾天。如果價格跌破三角形,空頭將處於主導地位。
Solana price analysis
Solana 價格分析
The bulls are struggling to sustain Solana (SOL) above the 20-day EMA ($181), indicating that the bears are defending the level.
多頭正在努力將 Solana (SOL) 維持在 20 日均線(181 美元)之上,這表明空頭正在捍衛該水平。
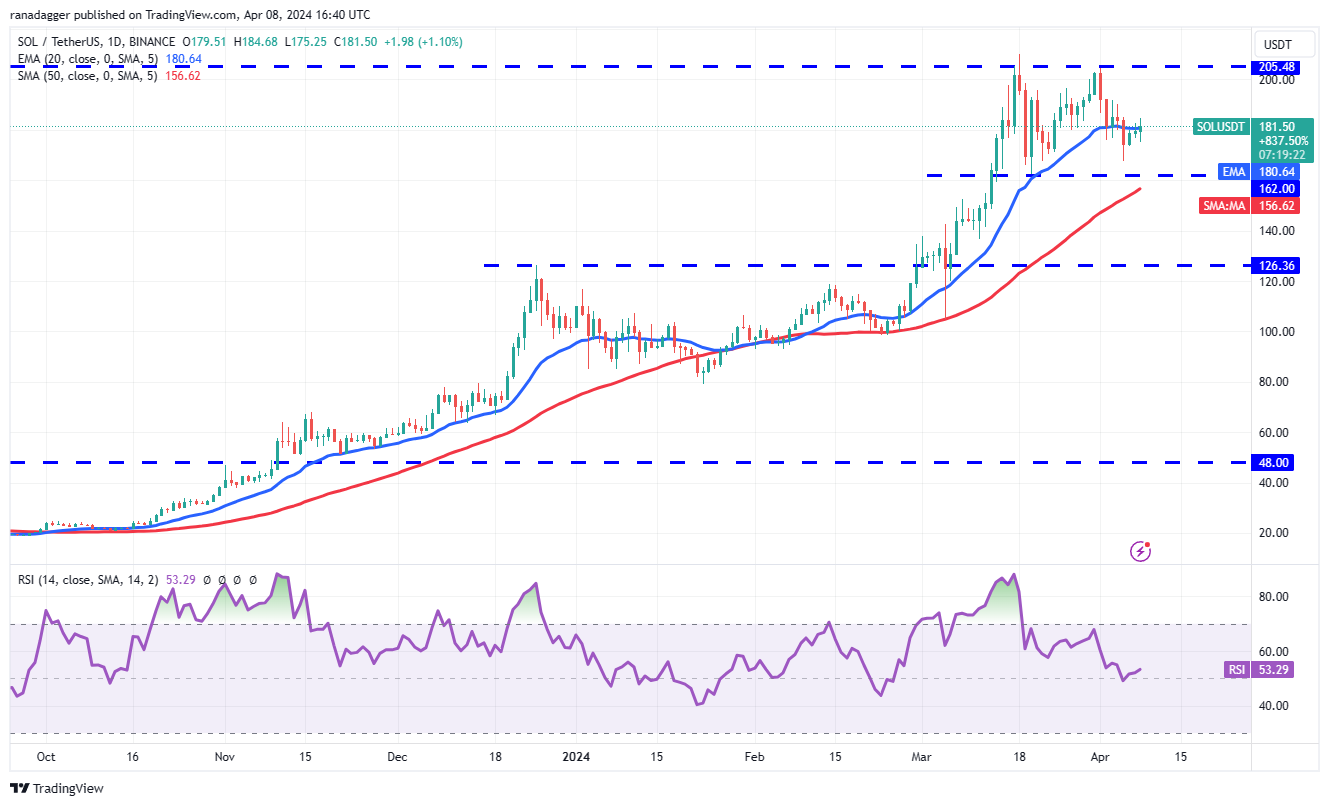
If the price turns down from the current level, the SOL/USDT pair could drop to the critical support at $162. The bulls are expected to vigorously protect this level because failing to do that could open the gates for a fall to $126.
如果價格從目前水準下跌,SOL/USDT 貨幣對可能會跌至 162 美元的關鍵支撐位。預計多頭將大力保護這一水平,因為如果不這樣做,可能會打開跌至 126 美元的大門。
Alternatively, if the price rebounds off $162 and rises above the 20-day EMA, it will signal that the pair may extend its stay inside the $162 to $205 range for some more time. The next leg of the uptrend could begin on a break above $205.
或者,如果價格從 162 美元反彈併升至 20 日均線上方,則將表明該貨幣對可能會在 162 美元至 205 美元區間內停留一段時間。下一階段的上升趨勢可能會在突破 205 美元時開始。
XRP price analysis
瑞波幣價格分析
The failure of the bears to capitalize on XRP’s (XRP) fall below the uptrend line may have attracted buyers who pushed the price above the moving averages on April 8.
空頭未能利用 XRP (XRP) 跌破上升趨勢線的機會,可能吸引了買家,他們在 4 月 8 日將價格推高至移動平均線之上。
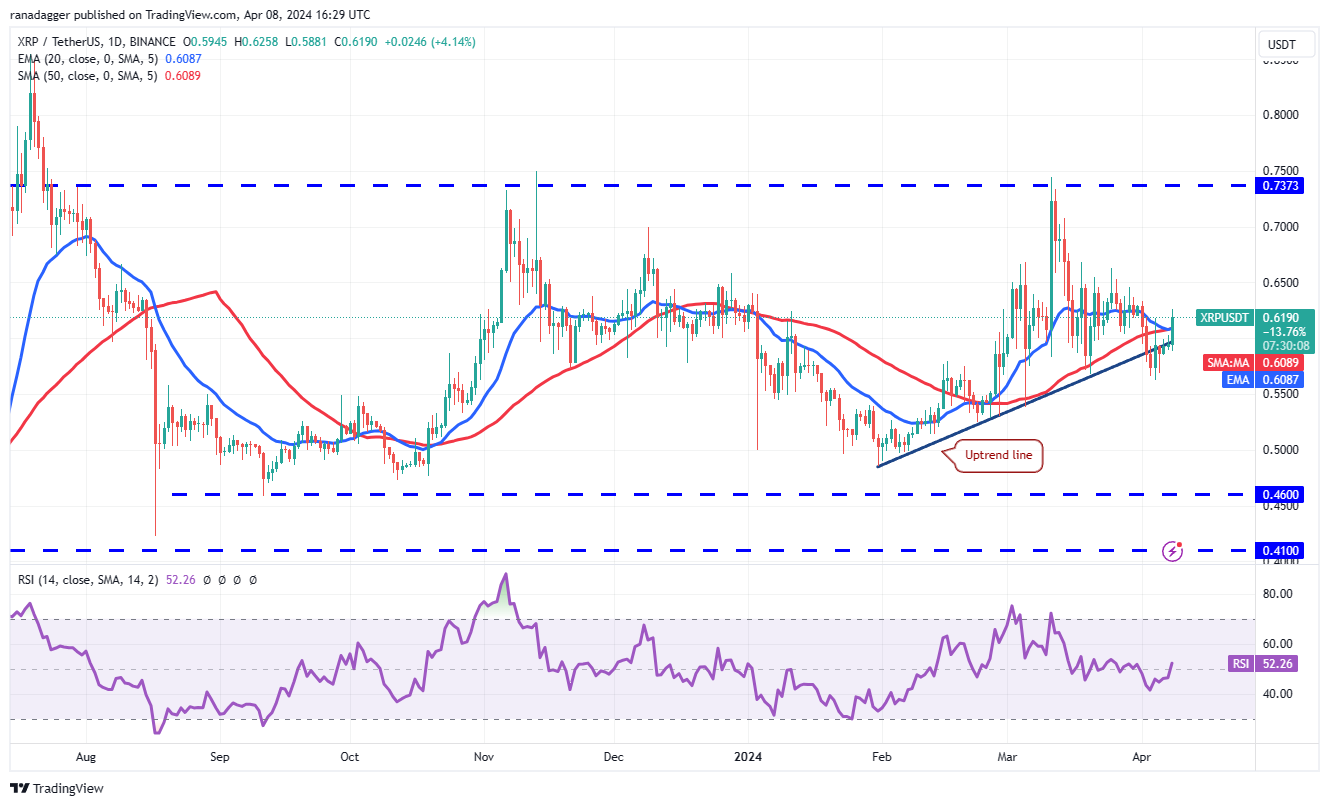
The flattish moving averages and the RSI just above the midpoint suggest a range-bound action in the near term. The XRP/USDT pair could swing between $0.56 and $0.69 for a few more days.
平坦的移動平均線和略高於中點的 RSI 顯示近期將出現區間波動。 XRP/USDT 貨幣對可能在接下來的幾天內在 0.56 美元至 0.69 美元之間波動。
Buyers will have to kick the price above $0.69 to enhance the prospects of a rally to the formidable resistance at $0.74. Instead, if bears want to take charge, they will have to sink and sustain the price below $0.56. The pair may then plunge to $0.52 and subsequently to $0.48.
買家必須將價格推至 0.69 美元以上,以增強反彈至 0.74 美元強大阻力位的前景。相反,如果空頭想要掌控局面,他們就必須將價格壓低並維持在 0.56 美元以下。隨後該貨幣對可能會暴跌至 0.52 美元,隨後跌至 0.48 美元。
Related: Here’s what happened in crypto today
相關:這是今天加密貨幣領域發生的事情
Dogecoin price analysis
狗狗幣價格分析
Dogecoin (DOGE) jumped back above the 20-day EMA ($0.18) on April 6 and continued the move higher to rise above $0.19 on April 7.
狗狗幣 (DOGE) 於 4 月 6 日跳回 20 日均線(0.18 美元)上方,並於 4 月 7 日繼續走高,升至 0.19 美元上方。
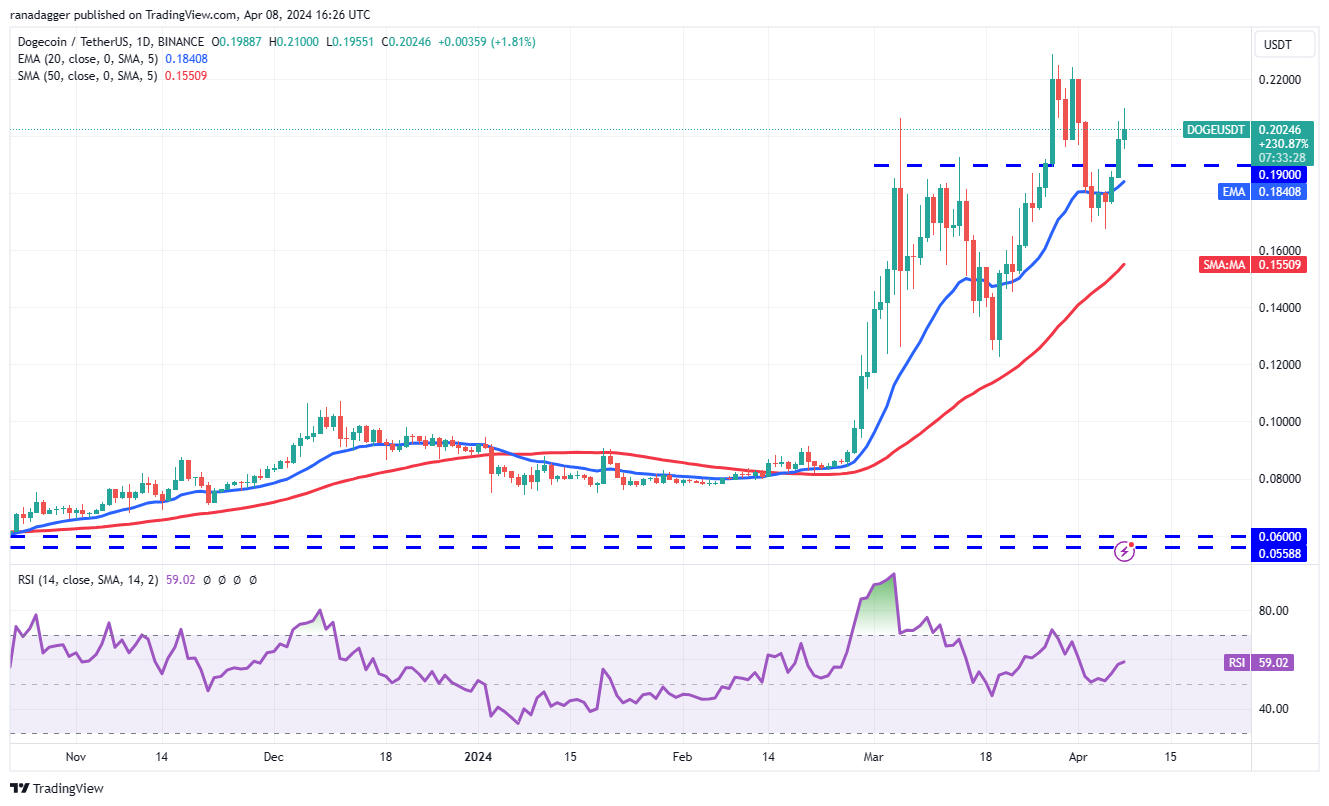
The bulls will try to maintain the momentum and push the price toward the overhead resistance at $0.23. A break and close above this level will signal the resumption of the uptrend. The DOGE/USDT pair will then attempt a rally to $0.30.
多頭將努力保持勢頭並將價格推向上方阻力位 0.23 美元。突破並收於該水平之上將標誌著上升趨勢的恢復。隨後 DOGE/USDT 貨幣對將嘗試反彈至 0.30 美元。
On the contrary, if the price slips back below the 20-day EMA, it will suggest that bears remain active at higher levels. That will increase the likelihood of a drop to the 50-day SMA ($0.15).
相反,如果價格回落至 20 日均線下方,則表示空頭在較高水準仍保持活躍。這將增加跌至 50 日移動平均線(0.15 美元)的可能性。
Cardano price analysis
卡爾達諾價格分析
The bulls successfully held Cardano (ADA) above $0.57 in the past few days and pushed the price to the 20-day EMA ($0.62) on April 8.
過去幾天,多頭成功將卡爾達諾 (ADA) 維持在 0.57 美元上方,並於 4 月 8 日將價格推至 20 日均線(0.62 美元)。
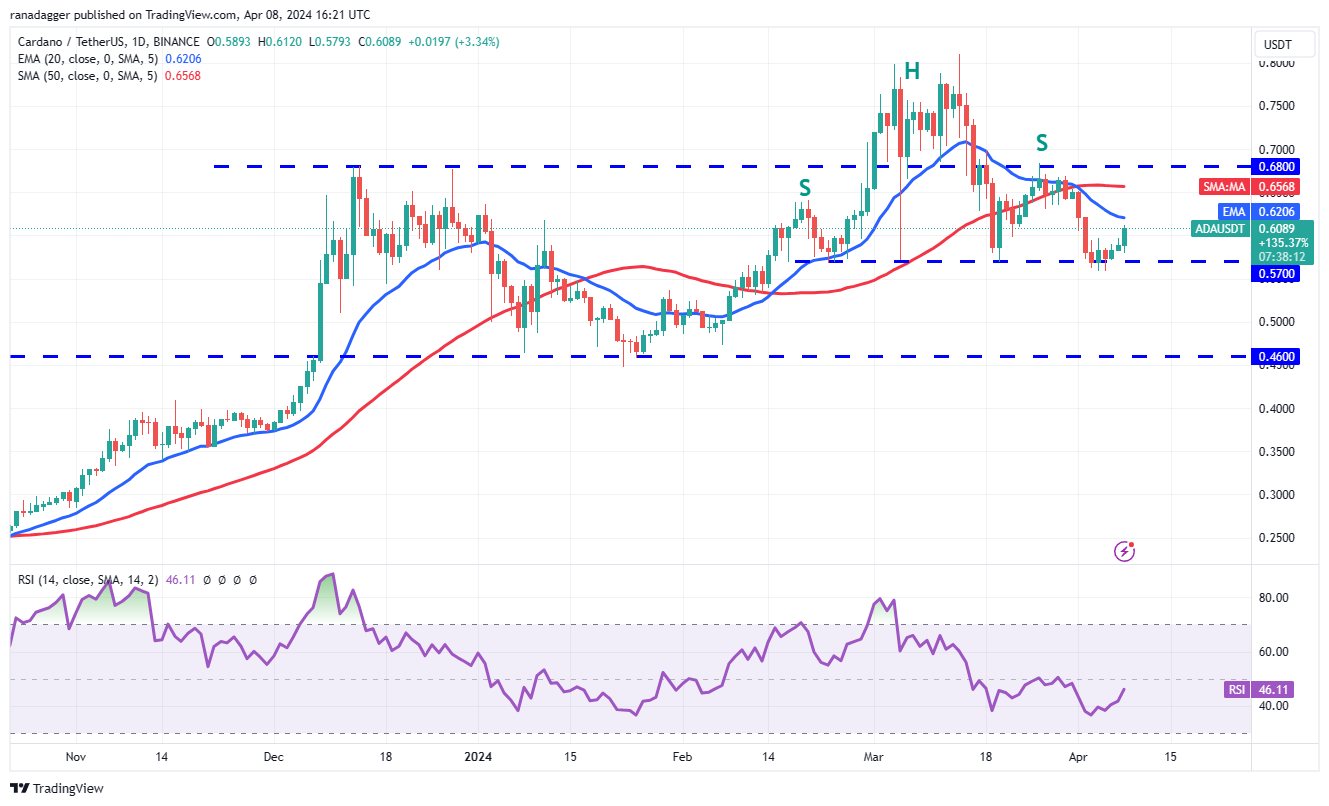
If the price turns down from the 20-day EMA, it will signal that the bears are in command. The sellers will try to sink the price below $0.57. If they manage to do that, the ADA/USDT pair will complete a bearish head-and-shoulders pattern. That could start a downward move toward the next major support at $0.46.
如果價格從 20 日均線下跌,則表示空頭佔據主導地位。賣家將嘗試將價格壓低至 0.57 美元以下。如果他們成功做到這一點,ADA/USDT 貨幣對將完成看跌的頭肩形態。這可能會開始向下移動至下一個主要支撐位 0.46 美元。
The first sign of strength will be a break and close above the 20-day EMA. That will open the doors for a rise to $0.68. Buyers will have to overcome this barrier to increase the possibility of a rally to $0.81.
強勢的第一個跡象將是突破並收於 20 日均線上方。這將為上漲至 0.68 美元打開大門。買家必須克服這一障礙才能將上漲至 0.81 美元的可能性增加。
Toncoin price analysis
通幣價格分析
Toncoin (TON) skyrocketed above the $5.50 to $5.69 overhead resistance zone on April 8, indicating the start of the next leg of the uptrend.
Toncoin (TON) 於 4 月 8 日飆升至 5.50 美元至 5.69 美元上方阻力區之上,顯示下一階段上升趨勢的開始。
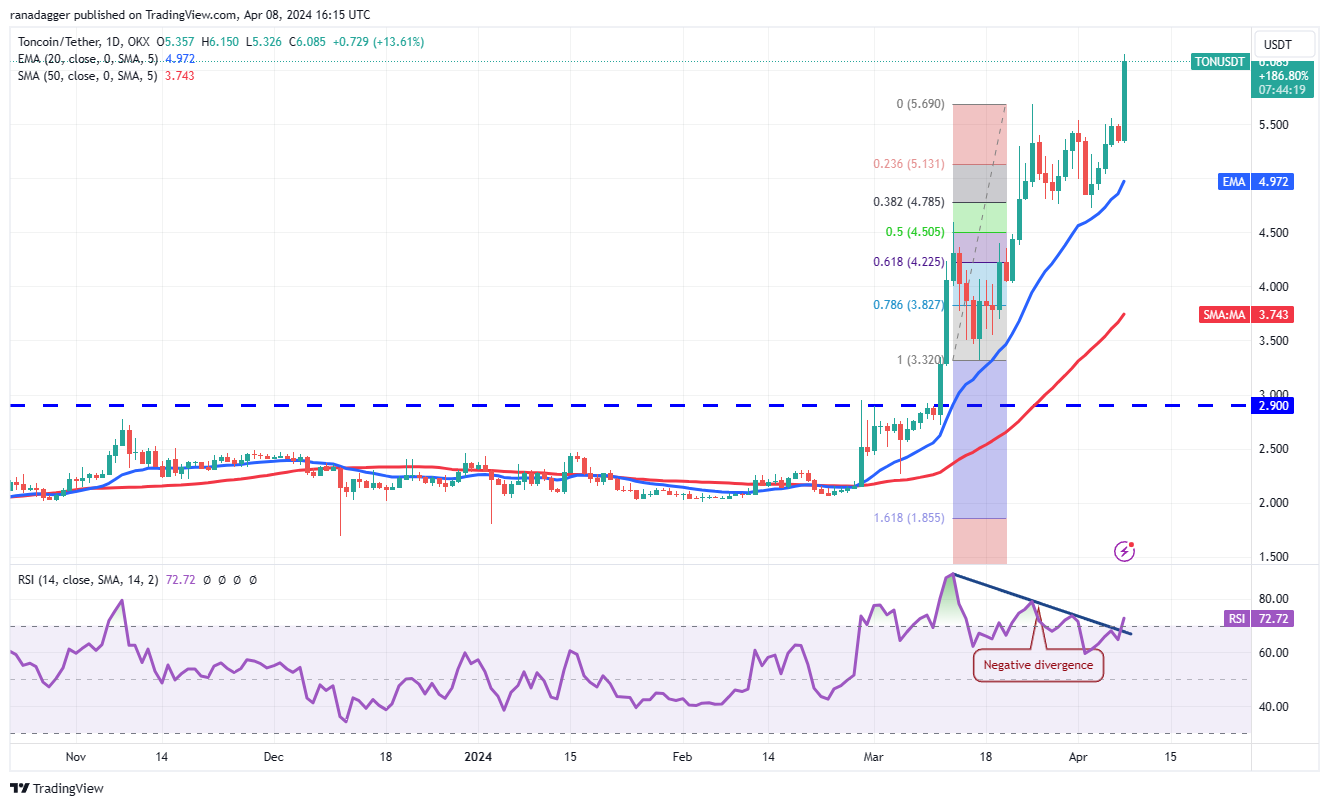
If buyers maintain the price above $5.69, the TON/USDT pair could rally to the next target objective at $7.09. The upsloping moving averages and the RSI in the overbought zone indicate that the bulls are in control.
如果買家將價格維持在 5.69 美元以上,TON/USDT 貨幣對可能會反彈至下一個目標 7.09 美元。向上傾斜的移動平均線和超買區域的 RSI 表明多頭處於控制之中。
The bears will have to tug the price below $5.50 to trap the aggressive bulls. That could result in long liquidation, threatening the 20-day EMA ($4.97). If this level gives way, the pair may slump to $4.72 and then to the 61.8% Fibonacci retracement level of $4.22.
空頭必須將價格拉低至 5.50 美元以下,才能困住激進的多頭。這可能會導致多頭清算,威脅 20 日均線(4.97 美元)。如果該水準失守,該貨幣對可能會跌至 4.72 美元,然後跌至 61.8% 斐波那契回檔位 4.22 美元。
This article does not contain investment advice or recommendations. Every investment and trading move involves risk, and readers should conduct their own research when making a decision.
本文不包含投資建議或建議。每一項投資和交易行為都涉及風險,讀者在做決定時應自行研究。
 DogeHome
 Inside Bitcoins
 CoinPedia News
 CoinPedia News
 CFN
CFN CoinPedia News
 Cointelegraph


