

The Bitcoin halving is less than 11 days away and Bitcoin (BTC) is approaching the event with strength. This shows that the sentiment remains positive, and traders are buying on dips. CoinShares data shows digital investment products saw $646 million in inflows last week. That takes the year-to-date inflows to $13.8 billion, far higher than the $10.6 billion in 2021.
비트코인 반감기가 11일도 채 남지 않았으며 비트코인(BTC)이 힘차게 반감기를 앞두고 있습니다. 이는 정서가 여전히 긍정적이고 거래자들이 하락세에 매수하고 있음을 보여줍니다. CoinShares 데이터에 따르면 지난주 디지털 투자 상품에 6억 4,600만 달러가 유입되었습니다. 이는 연간 유입액이 138억 달러로 2021년의 106억 달러보다 훨씬 높은 수치입니다.
On-chain analytics firm Santiment said in a X post that inflows into spot Bitcoin exchange-traded funds (ETFs) are likely to remain high until the Bitcoin halving. However, the firm added “it will be interesting to see whether a drop-off in ETF volume and on-chain volume will occur directly afterward.”
온체인 분석 회사인 산티멘트(Santiment)는 비트코인 현물 상장지수펀드(ETF)로 유입되는 X 포스트에서 비트코인이 반감될 때까지 높은 수준을 유지할 가능성이 높다고 밝혔습니다. 그러나 회사는 "ETF 거래량과 온체인 거래량이 곧바로 감소할지는 지켜보는 것이 흥미로울 것"이라고 덧붙였다.
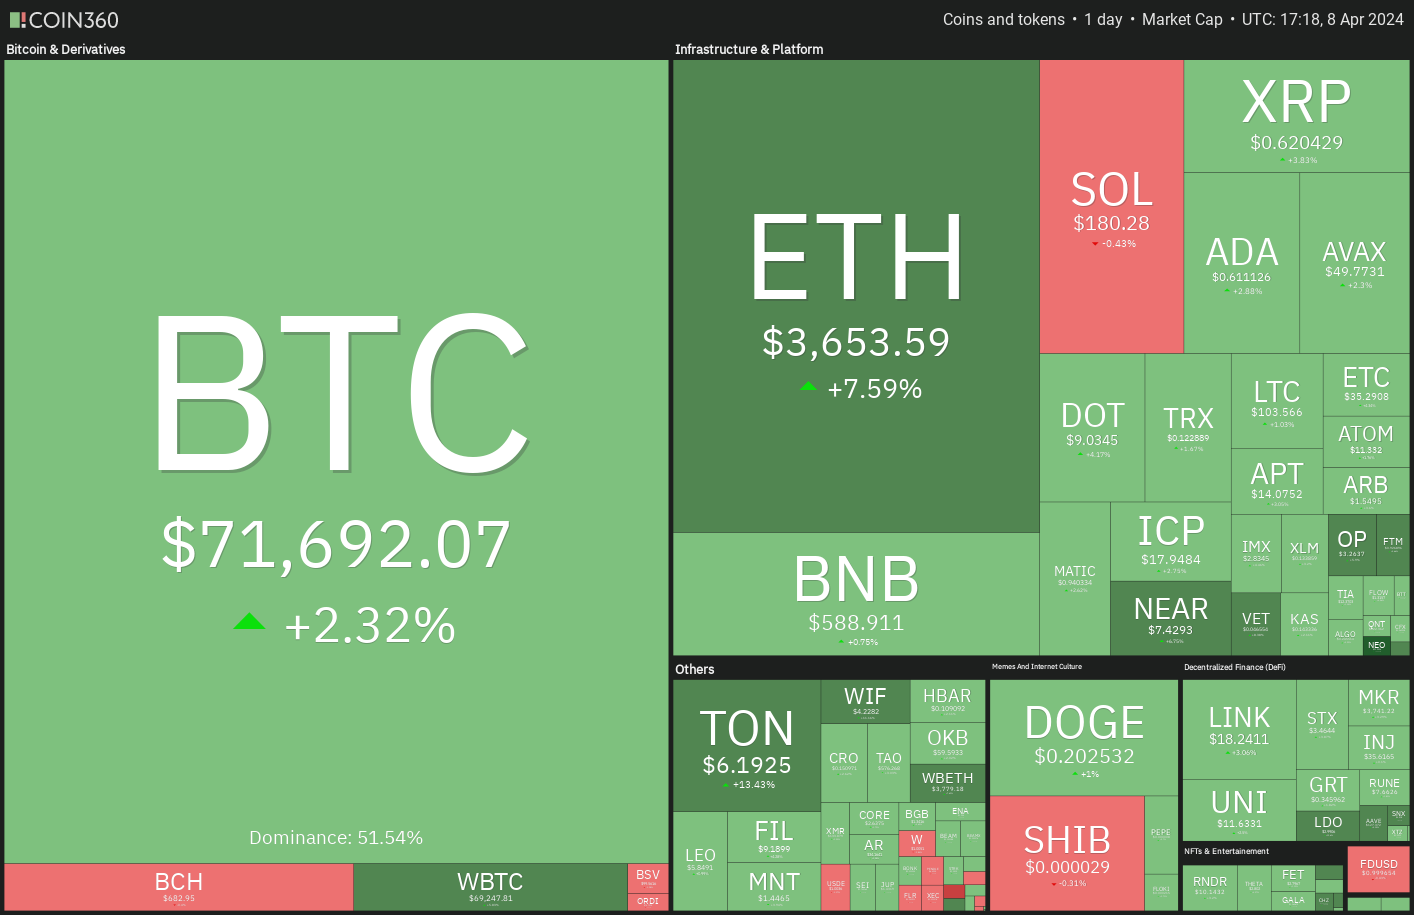
It is difficult to determine how the markets will behave just after halving, but analysts remain bullish on the long term. SkyBridge Capital CEO Anthony Scaramucci said in an interview with CNBC that Bitcoin could soar to $170,000 during the cycle. Eventually, he expects Bitcoin to trade at “half the valuation of gold” but warns of volatility en route.
반감기 직후 시장이 어떻게 움직일지 판단하기는 어렵지만 분석가들은 장기적으로 낙관적인 입장을 유지합니다. 스카이브릿지 캐피탈(SkyBridge Capital) CEO 앤서니 스카라무치(Anthony Scaramucci)는 CNBC와의 인터뷰에서 비트코인이 이 주기 동안 17만 달러까지 치솟을 수 있다고 말했습니다. 결국 그는 비트코인이 "금 가치의 절반"으로 거래될 것으로 예상하지만 그 과정에서 변동성이 발생할 수 있다고 경고합니다.
What are the important resistance levels to watch out for in Bitcoin and altcoins? Let’s analyze the charts to find out.
비트코인과 알트코인에서 주의해야 할 중요한 저항 수준은 무엇입니까? 알아보기 위해 차트를 분석해 보겠습니다.
S&P 500 Index price analysis
S&P 500 지수 가격 분석
The S&P 500 Index made an outside-day candlestick pattern on April 4 and an inside-day candlestick pattern on April 5, indicating uncertainty about the next directional move.
S&P 500 지수는 4월 4일 장외 캔들 패턴을, 4월 5일 장중 캔들 패턴을 만들어 다음 방향 움직임에 대한 불확실성을 나타냈습니다.
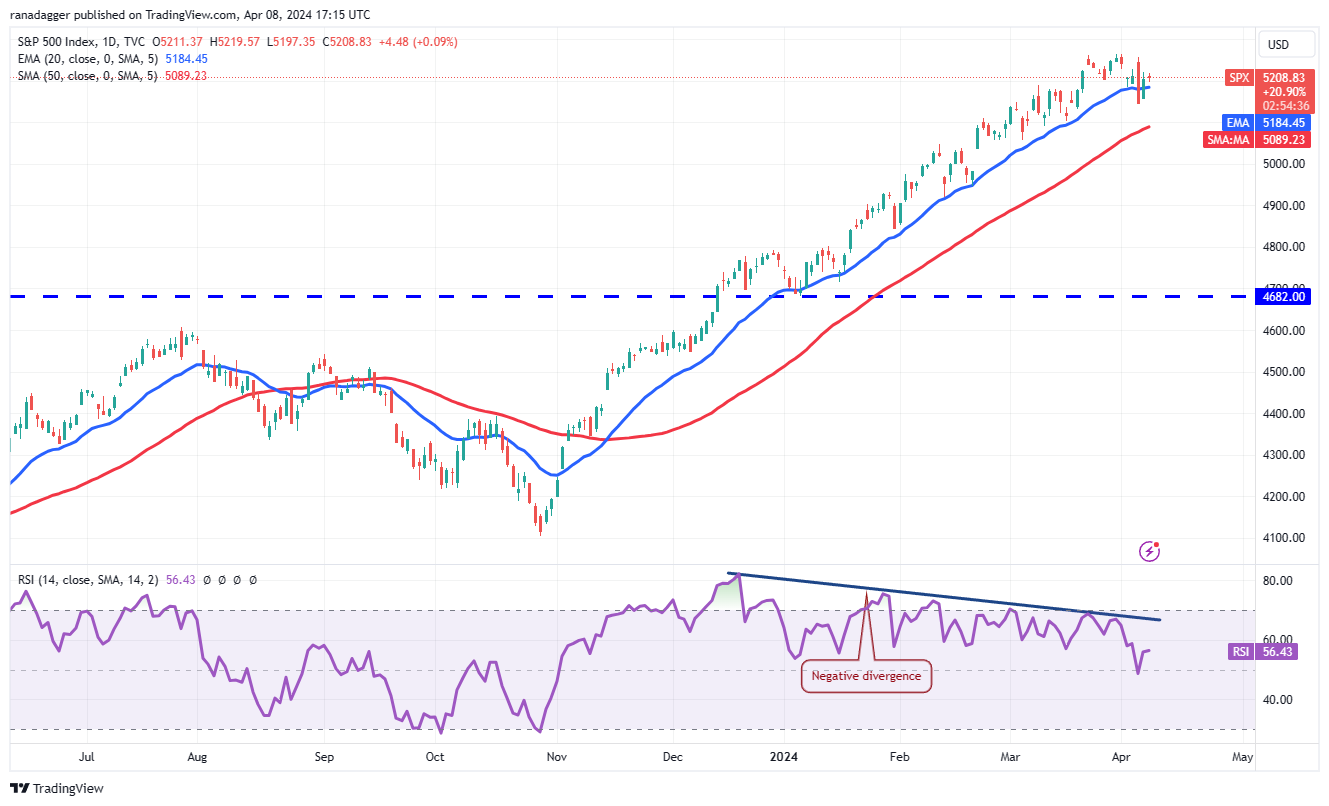
The 20-day exponential moving average (5,184) has flattened out, and the relative strength index (RSI) is in the positive zone, indicating a balance between supply and demand.
20일 지수이동평균(5,184)이 평준화됐고, 상대강도지수(RSI)도 플러스 영역에 있어 수요와 공급의 균형을 나타내고 있다.
If the price turns lower and breaks below 5,146, it will signal the start of a corrective phase. The 50-day simple moving average (5,089) may try to arrest the decline, but it is likely to be broken.
가격이 하락하여 5,146 아래로 떨어지면 조정 단계가 시작된다는 신호입니다. 50일 단순이동평균(5,089)이 하락세를 저지하려 할 수도 있지만 돌파될 가능성이 높다.
Conversely, if the price continues higher and breaks above the all-time high of 5,265, the index will resume its uptrend. The next stop is likely to be 5,450.
반대로, 가격이 계속 상승하여 사상 최고치인 5,265를 넘어서면 지수는 상승 추세를 재개합니다. 다음 정류장은 5,450번이 될 가능성이 높습니다.
U.S. Dollar Index price analysis
미국 달러 지수 가격 분석
The U.S. Dollar Index (DXY) turned down sharply from the 105 overhead resistance level on April 2, signaling that the bears are active at higher levels.
미국 달러 지수(DXY)는 4월 2일 105의 저항선에서 급격하게 하락하여 하락세가 더 높은 수준에서 활발히 활동하고 있음을 나타냅니다.
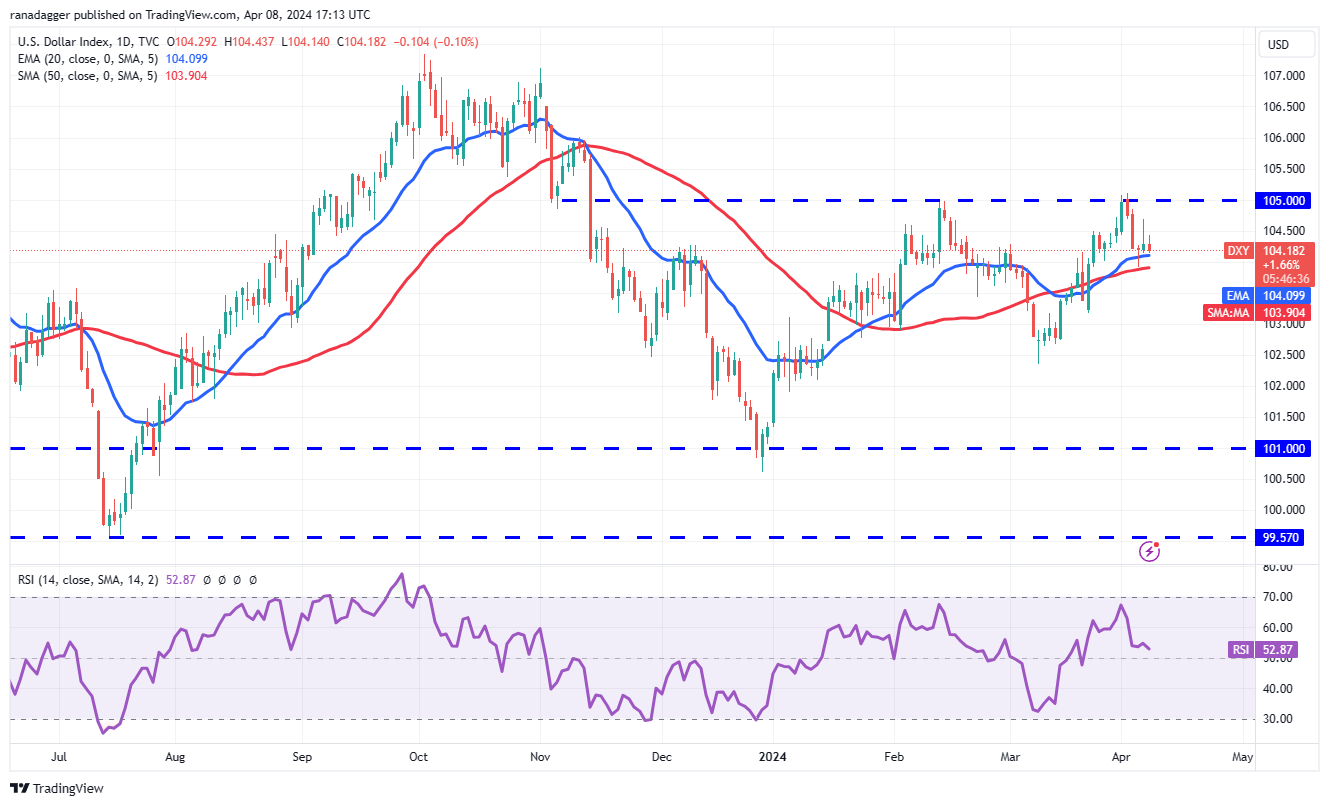
However, a minor advantage in favor of the bulls is that they did not allow the index to slide below the moving averages. This suggests that lower levels are being purchased. Selling at higher levels and buying on dips signals a possible range-bound action in the near term. The index may swing between the 50-day SMA (104) and 105 for some time.
그러나 황소에게 유리한 작은 이점은 지수가 이동 평균 아래로 미끄러지는 것을 허용하지 않는다는 것입니다. 이는 낮은 수준의 구매가 이루어지고 있음을 의미합니다. 더 높은 수준에서 매도하고 급락 시 매수하는 것은 단기적으로 범위 제한 조치가 가능하다는 신호입니다. 지수는 한동안 50일 SMA(104)와 105 사이에서 변동할 수 있습니다.
A break and close above 105 clears the path for a potential rally to 106 and then 107. On the contrary, a drop below the 50-day SMA could sink the index to 103 and subsequently to 102.
105를 돌파하고 종가를 형성하면 106, 107까지 상승할 수 있는 가능성이 사라집니다. 반대로 50일 SMA 아래로 하락하면 지수가 103으로 하락한 후 102로 하락할 수 있습니다.
Bitcoin price analysis
비트코인 가격 분석
Bitcoin broke above the symmetrical triangle pattern on April 8, indicating that the bulls have overpowered the bears.
비트코인은 4월 8일 대칭 삼각형 패턴을 돌파하여 강세가 약세를 압도했음을 나타냅니다.
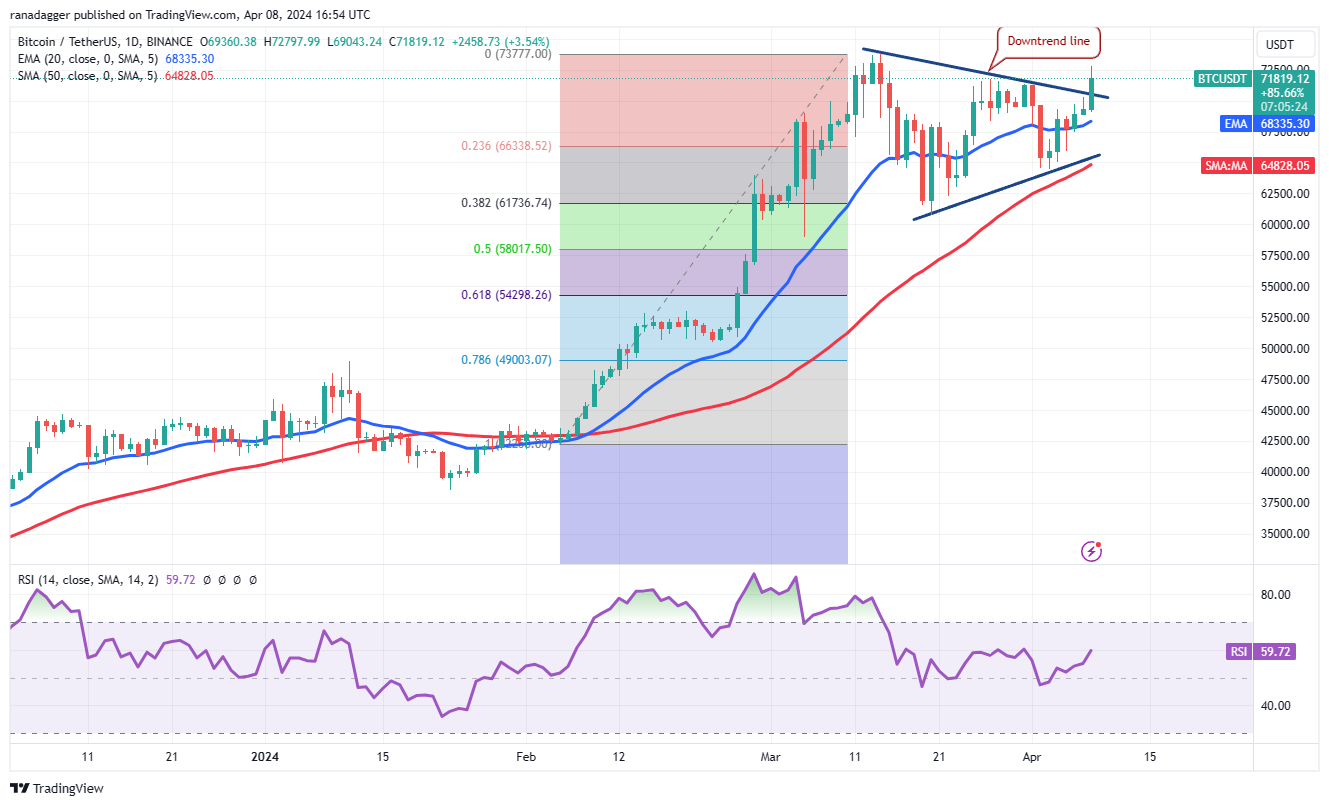
The BTC/USDT pair is likely to retest the all-time high of $73,777. This level may act as a significant barrier, but if the bulls overcome it, the pair could start the next leg of the uptrend toward the pattern target of $84,000.
BTC/USDT 쌍은 사상 최고치인 73,777달러를 다시 테스트할 가능성이 높습니다. 이 수준은 상당한 장벽으로 작용할 수 있지만 상승세가 이를 극복할 경우 패턴 목표인 $84,000를 향해 상승 추세의 다음 단계를 시작할 수 있습니다.
Time is running out for the bears. If they want to make a comeback, they will have to quickly pull the price back below the 20-day EMA ($68,335). If that happens, the pair may plunge to the 50-day SMA ($64,828).
곰을 위한 시간이 얼마 남지 않았습니다. 복귀를 원한다면 가격을 20일 EMA($68,335) 아래로 신속히 낮추어야 합니다. 그렇게 되면 통화쌍은 50일 SMA($64,828)까지 급락할 수 있습니다.
Ether price analysis
이더 가격 분석
Ether (ETH) has been trading between $3,056 and $3,679 for several days, indicating indecision between the bulls and the bears.
이더리움(ETH)은 며칠 동안 3,056달러에서 3,679달러 사이에 거래되어 강세와 약세 사이에 우유부단함을 나타냅니다.
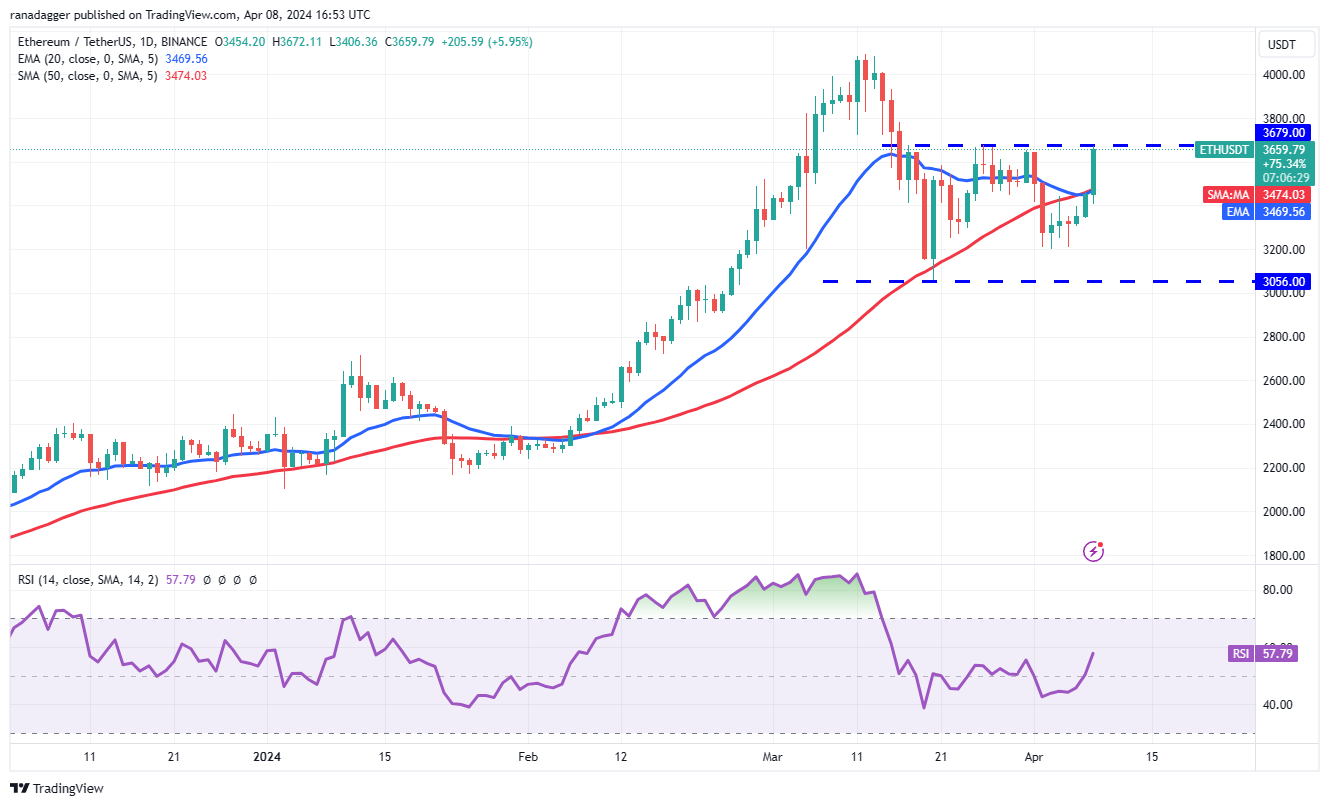
The ETH/USDT pair has reached the overhead resistance of $3,679, an important level to keep an eye on. If buyers overcome this obstacle, the pair could pick up momentum and rally to $4,093. The bears are expected to fiercely defend this level, but if the bulls prevail, the pair could start the next leg of the uptrend toward $4,488.
ETH/USDT 쌍은 주시해야 할 중요한 수준인 $3,679의 오버헤드 저항에 도달했습니다. 구매자가 이 장애물을 극복하면 쌍은 추진력을 얻어 4,093달러까지 상승할 수 있습니다. 하락세가 이 수준을 맹렬히 방어할 것으로 예상되지만, 상승세가 우세할 경우 하락세는 4,488달러를 향한 다음 상승세를 시작할 수 있습니다.
Contrary to this assumption, if the price turns down sharply from $3,679 and breaks below the 20-day EMA, it will indicate that the range-bound action may continue for a while longer.
이 가정과 반대로 가격이 3,679달러에서 급격히 하락하고 20일 EMA 아래로 떨어지면 범위 제한 조치가 한동안 계속될 수 있음을 나타냅니다.
BNB price analysis
BNB 가격 분석
BNB (BNB) continues to trade inside the symmetrical triangle pattern, indicating a balance between supply and demand.
BNB(BNB)는 수요와 공급의 균형을 나타내는 대칭 삼각형 패턴 내에서 계속 거래됩니다.
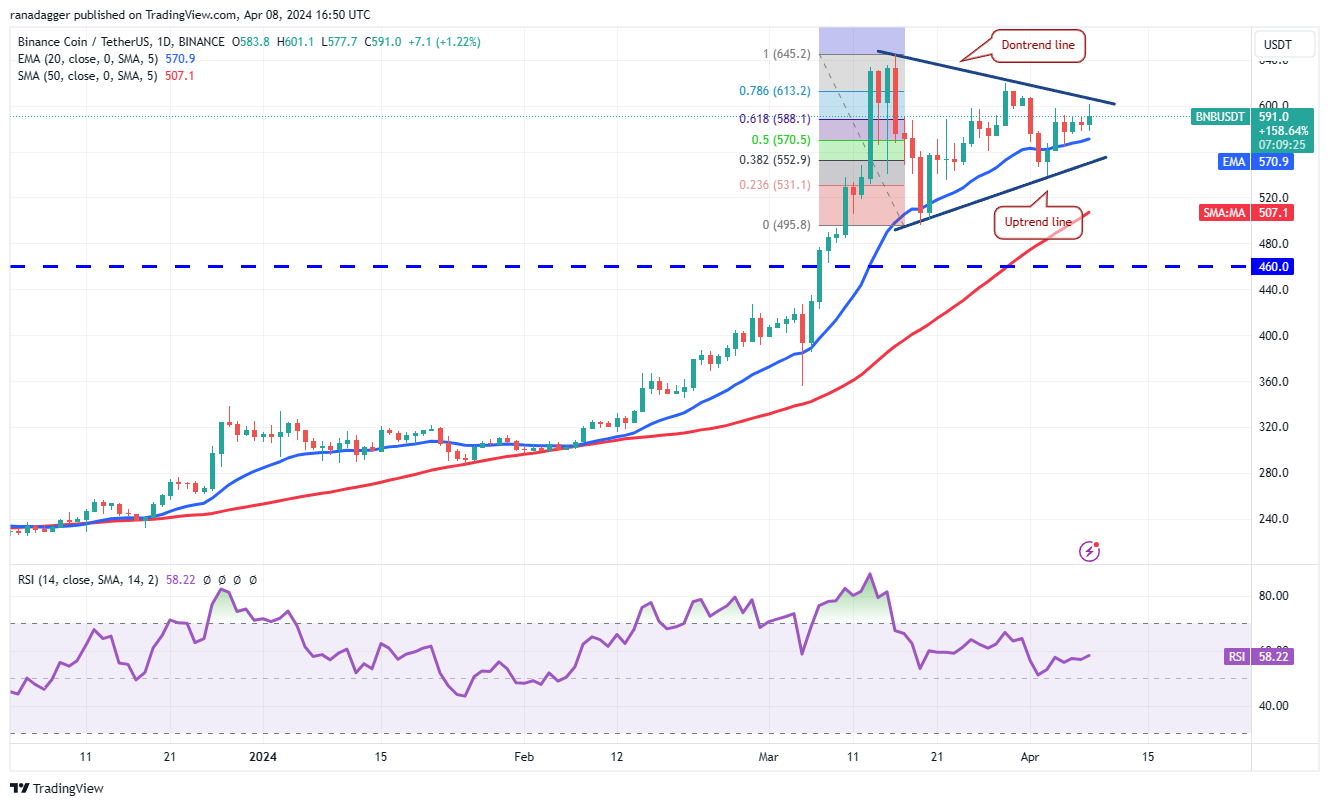
The 20-day EMA ($570) is moving up gradually, and the RSI is in the positive territory, indicating that the bulls are at a minor advantage. The BNB/USDT pair has reached the downtrend line of the triangle. If this resistance is overcome, the pair could retest the March 16 high at $645.
20일 EMA(570달러)는 점진적으로 상승하고 있으며 RSI는 양의 영역에 있어 강세가 미미한 우위에 있음을 나타냅니다. BNB/USDT 쌍이 삼각형의 하락 추세선에 도달했습니다. 이 저항이 극복된다면 3월 16일 최고가인 $645를 다시 테스트할 수 있습니다.
On the contrary, if the price turns down from the downtrend line, it will suggest that the pair may remain inside the triangle for a few more days. The bears will be in a commanding position if the price plunges below the triangle.
반대로, 가격이 하락 추세선에서 하락한다면 이는 해당 쌍이 며칠 더 삼각형 안에 머물 수 있음을 의미합니다. 가격이 삼각형 아래로 떨어지면 하락세가 지배적인 위치에 있게 됩니다.
Solana price analysis
솔라나 가격 분석
The bulls are struggling to sustain Solana (SOL) above the 20-day EMA ($181), indicating that the bears are defending the level.
황소는 20일 EMA($181) 이상으로 솔라나(SOL)를 유지하기 위해 고군분투하고 있으며, 이는 곰이 수준을 방어하고 있음을 나타냅니다.
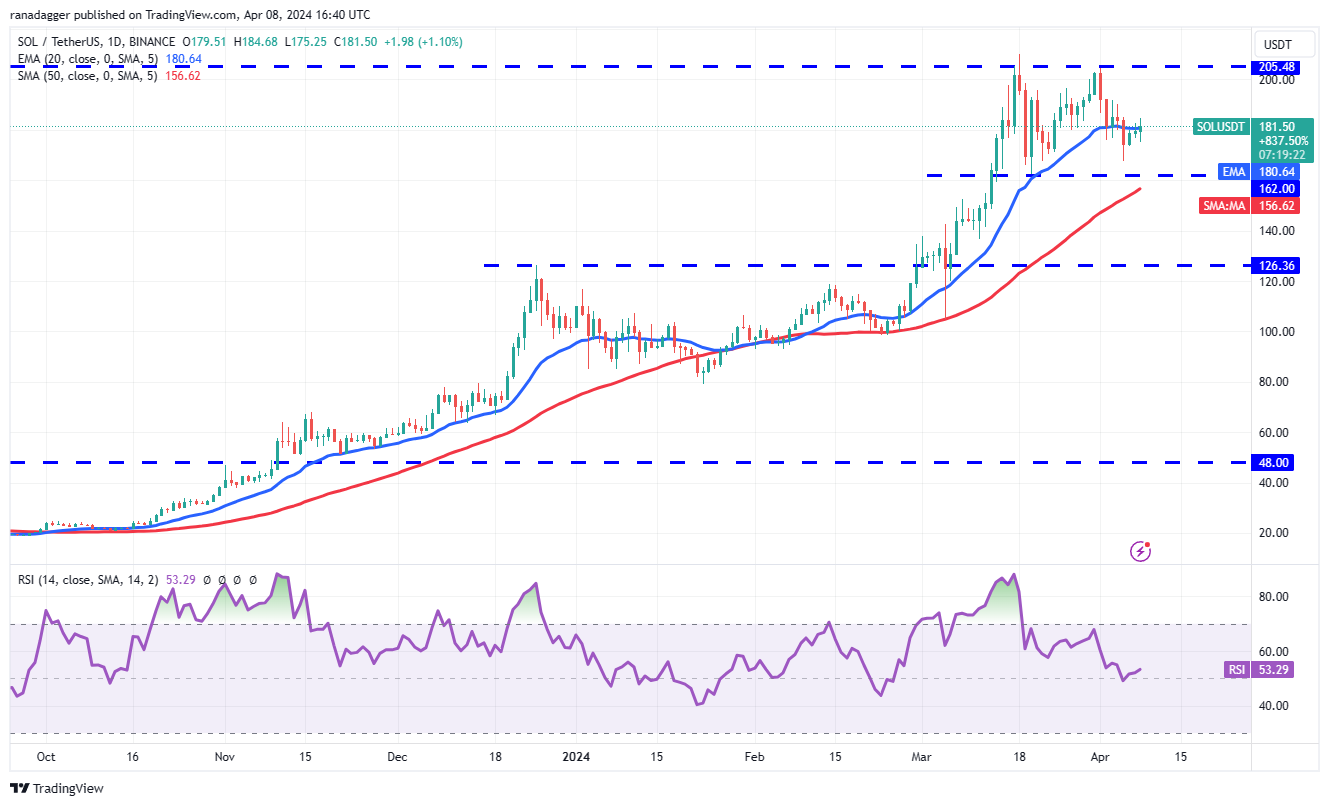
If the price turns down from the current level, the SOL/USDT pair could drop to the critical support at $162. The bulls are expected to vigorously protect this level because failing to do that could open the gates for a fall to $126.
가격이 현재 수준에서 하락하면 SOL/USDT 쌍은 $162의 중요한 지지선으로 떨어질 수 있습니다. 그렇게 하지 않으면 $126까지 하락할 수 있는 문이 열릴 수 있기 때문에 황소는 이 수준을 적극적으로 보호할 것으로 예상됩니다.
Alternatively, if the price rebounds off $162 and rises above the 20-day EMA, it will signal that the pair may extend its stay inside the $162 to $205 range for some more time. The next leg of the uptrend could begin on a break above $205.
또는 가격이 $162에서 반등하고 20일 EMA 위로 상승하면 쌍이 $162~$205 범위 내에서 한동안 더 머물 수 있다는 신호가 됩니다. 상승 추세의 다음 구간은 205달러를 넘어설 때 시작될 수 있습니다.
XRP price analysis
XRP 가격 분석
The failure of the bears to capitalize on XRP’s (XRP) fall below the uptrend line may have attracted buyers who pushed the price above the moving averages on April 8.
XRP(XRP)가 상승 추세선 아래로 떨어지는 것을 활용하지 못한 하락세는 4월 8일 가격을 이동 평균 위로 올린 구매자를 끌어들였을 수 있습니다.
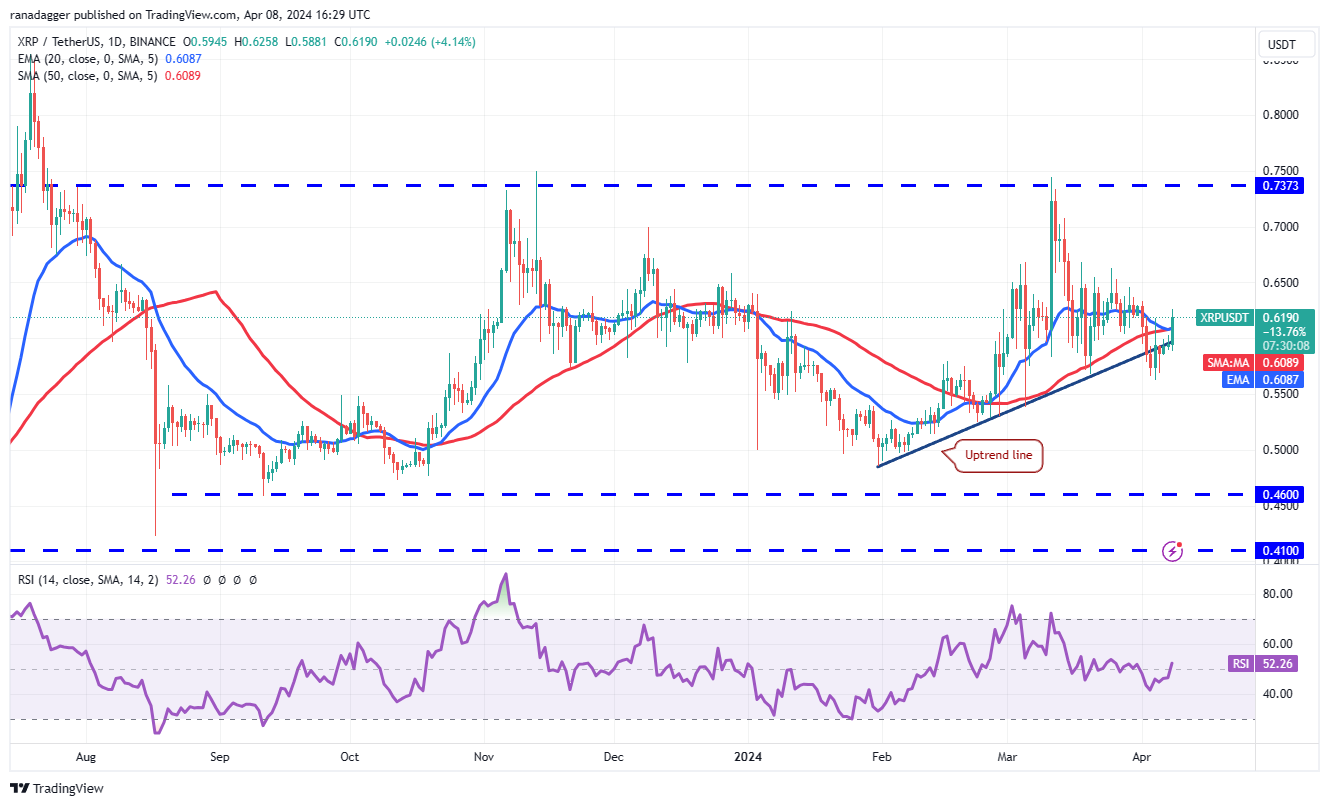
The flattish moving averages and the RSI just above the midpoint suggest a range-bound action in the near term. The XRP/USDT pair could swing between $0.56 and $0.69 for a few more days.
평평한 이동 평균과 중간점 바로 위의 RSI는 단기적으로 범위 제한 조치를 제안합니다. XRP/USDT 쌍은 며칠 동안 0.56달러에서 0.69달러 사이에서 변동할 수 있습니다.
Buyers will have to kick the price above $0.69 to enhance the prospects of a rally to the formidable resistance at $0.74. Instead, if bears want to take charge, they will have to sink and sustain the price below $0.56. The pair may then plunge to $0.52 and subsequently to $0.48.
$0.74의 강력한 저항에 대한 랠리 전망을 높이려면 구매자는 가격을 $0.69 이상으로 올려야 합니다. 대신, 약세가 주도하고 싶다면 가격을 $0.56 이하로 유지해야 합니다. 이후 통화쌍은 $0.52까지 하락한 후 $0.48까지 하락할 수 있습니다.
Related: Here’s what happened in crypto today
관련 항목: 오늘 암호화폐 업계에서 일어난 일은 다음과 같습니다.
Dogecoin price analysis
도지코인 가격 분석
Dogecoin (DOGE) jumped back above the 20-day EMA ($0.18) on April 6 and continued the move higher to rise above $0.19 on April 7.
Dogecoin(DOGE)은 4월 6일 20일 EMA($0.18) 위로 다시 뛰어 올랐고, 4월 7일에는 $0.19 위로 상승하는 상승세를 이어갔습니다.
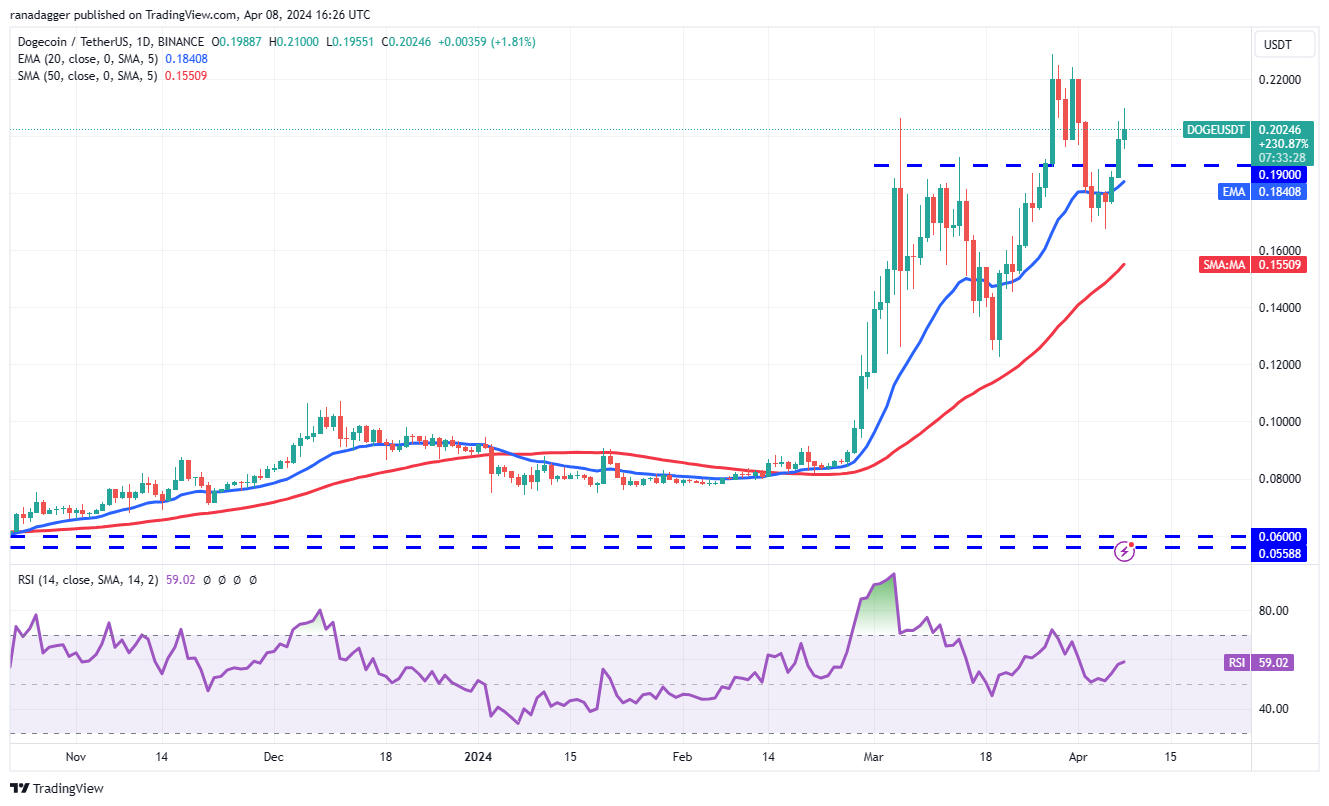
The bulls will try to maintain the momentum and push the price toward the overhead resistance at $0.23. A break and close above this level will signal the resumption of the uptrend. The DOGE/USDT pair will then attempt a rally to $0.30.
강세론자들은 모멘텀을 유지하고 가격을 0.23달러의 머리 위 저항선 쪽으로 끌어올리려고 노력할 것입니다. 이 수준 위의 돌파 및 종가는 상승 추세의 재개를 의미합니다. 그러면 DOGE/USDT 쌍은 $0.30까지 상승을 시도할 것입니다.
On the contrary, if the price slips back below the 20-day EMA, it will suggest that bears remain active at higher levels. That will increase the likelihood of a drop to the 50-day SMA ($0.15).
반대로, 가격이 20일 EMA 아래로 떨어지면 하락세는 더 높은 수준에서 계속 활발하게 활동한다는 의미입니다. 그러면 50일 SMA($0.15)로 하락할 가능성이 높아집니다.
Cardano price analysis
카르다노 가격 분석
The bulls successfully held Cardano (ADA) above $0.57 in the past few days and pushed the price to the 20-day EMA ($0.62) on April 8.
상승세는 지난 며칠 동안 Cardano(ADA)를 $0.57 이상으로 유지하는 데 성공했으며 4월 8일에는 가격을 20일 EMA($0.62)까지 올렸습니다.
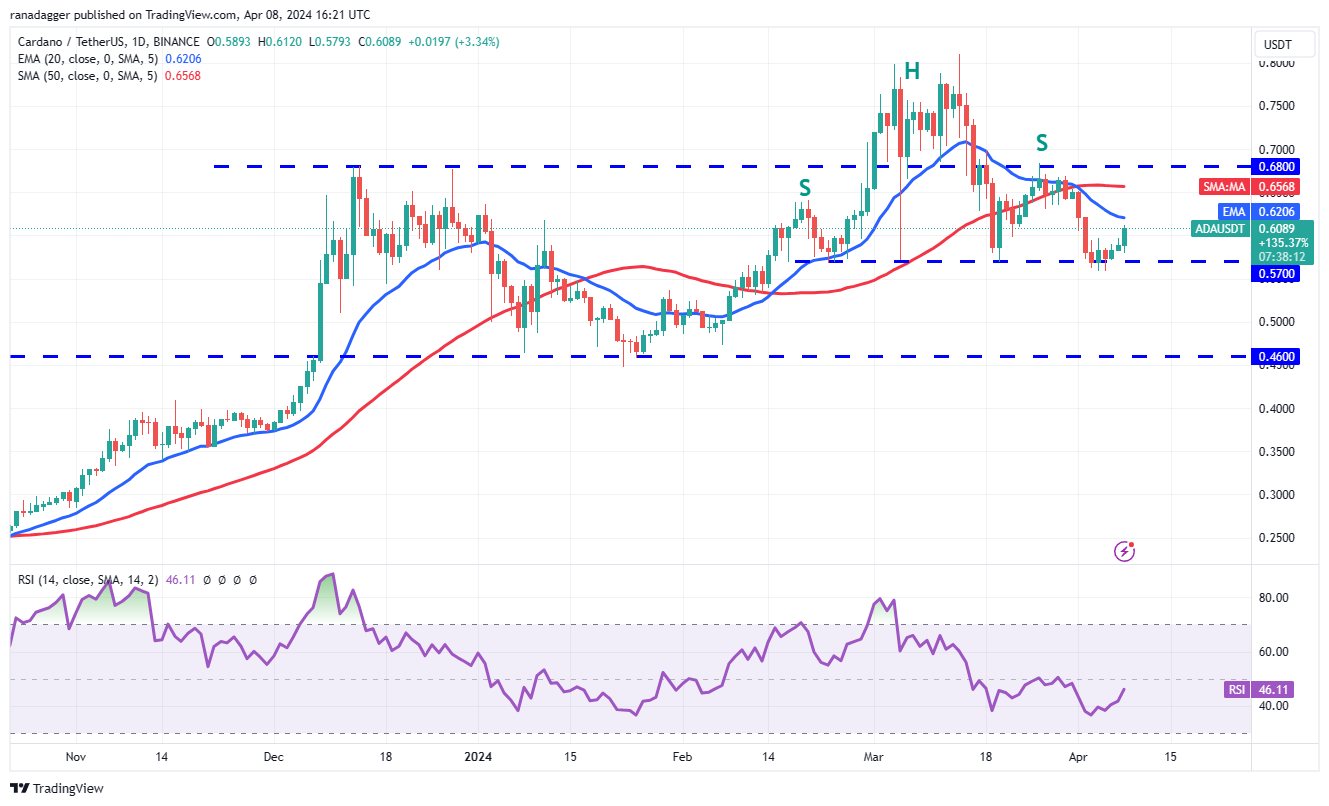
If the price turns down from the 20-day EMA, it will signal that the bears are in command. The sellers will try to sink the price below $0.57. If they manage to do that, the ADA/USDT pair will complete a bearish head-and-shoulders pattern. That could start a downward move toward the next major support at $0.46.
20일 EMA에서 가격이 하락하면 하락세가 주도권을 쥐고 있다는 신호가 됩니다. 판매자는 가격을 $0.57 이하로 낮추려고 노력할 것입니다. 그렇게 하면 ADA/USDT 쌍은 약세 헤드앤숄더 패턴을 완성하게 됩니다. 이는 0.46달러의 다음 주요 지지선을 향한 하향 움직임을 시작할 수 있습니다.
The first sign of strength will be a break and close above the 20-day EMA. That will open the doors for a rise to $0.68. Buyers will have to overcome this barrier to increase the possibility of a rally to $0.81.
강세의 첫 번째 신호는 20일 EMA 위에서 돌파 및 마감이 될 것입니다. 그러면 $0.68까지 상승할 수 있는 문이 열릴 것입니다. 구매자는 랠리 가능성을 $0.81로 높이려면 이 장벽을 극복해야 합니다.
Toncoin price analysis
톤코인 가격 분석
Toncoin (TON) skyrocketed above the $5.50 to $5.69 overhead resistance zone on April 8, indicating the start of the next leg of the uptrend.
톤코인(TON)은 4월 8일 $5.50~$5.69 오버헤드 저항대 위로 급등하여 다음 상승 추세의 시작을 알렸습니다.
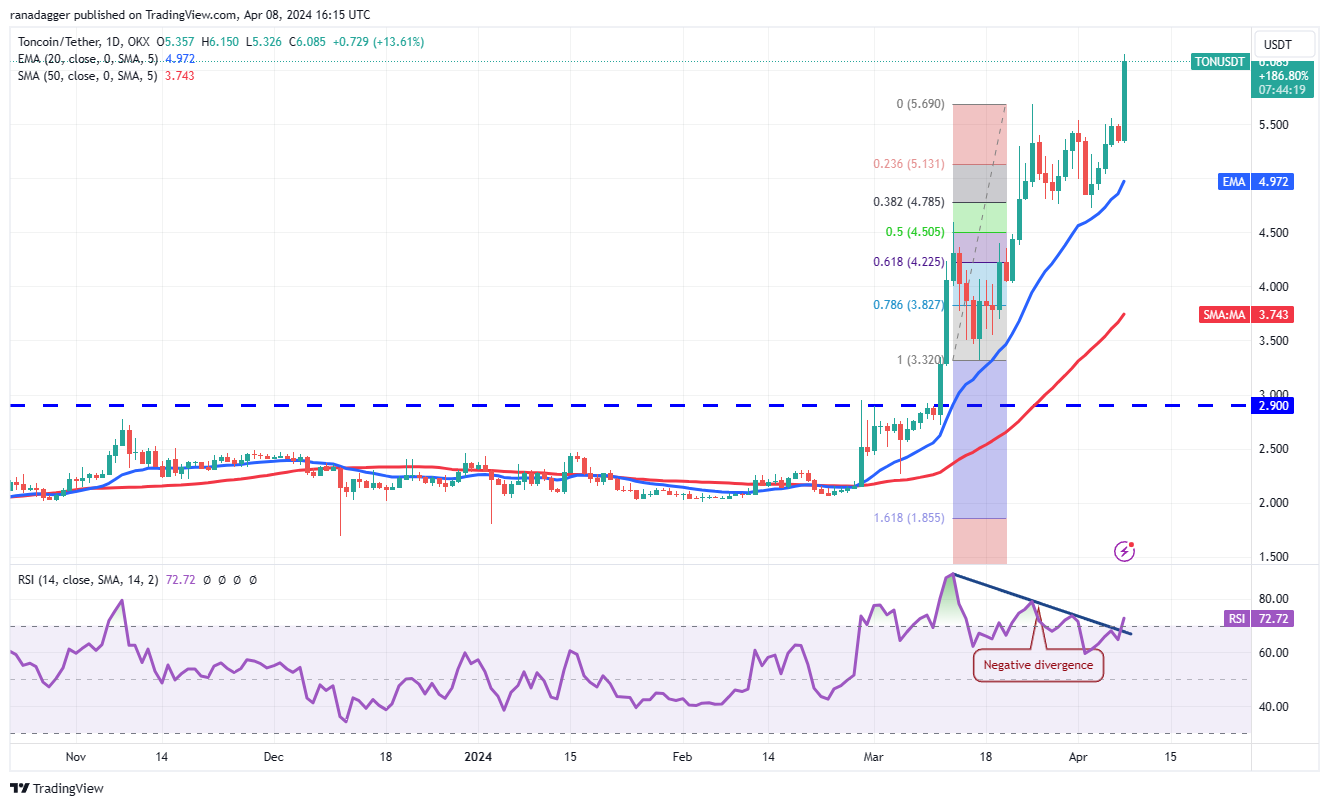
If buyers maintain the price above $5.69, the TON/USDT pair could rally to the next target objective at $7.09. The upsloping moving averages and the RSI in the overbought zone indicate that the bulls are in control.
구매자가 가격을 $5.69 이상으로 유지하면 TON/USDT 쌍은 $7.09의 다음 목표 목표로 상승할 수 있습니다. 상승하는 이동평균선과 과매수 구역의 RSI는 상승세가 통제되고 있음을 나타냅니다.
The bears will have to tug the price below $5.50 to trap the aggressive bulls. That could result in long liquidation, threatening the 20-day EMA ($4.97). If this level gives way, the pair may slump to $4.72 and then to the 61.8% Fibonacci retracement level of $4.22.
곰은 공격적인 황소를 가두기 위해 가격을 5.50달러 아래로 끌어내야 합니다. 이는 청산 기간이 길어져 20일 EMA($4.97)를 위협할 수 있습니다. 이 수준이 무너지면 통화쌍은 $4.72까지 하락한 다음 61.8% 피보나치 되돌림 수준인 $4.22까지 하락할 수 있습니다.
This article does not contain investment advice or recommendations. Every investment and trading move involves risk, and readers should conduct their own research when making a decision.
이 글에는 투자 조언이나 추천이 포함되어 있지 않습니다. 모든 투자 및 거래 활동에는 위험이 수반되므로 독자는 결정을 내릴 때 스스로 조사해야 합니다.
 CFN
CFN U_Today
 Thecoinrepublic.com
 DogeHome
 Optimisus
 Optimisus
 DeFi Planet
 Crypto Daily™
 BlockchainReporter


