

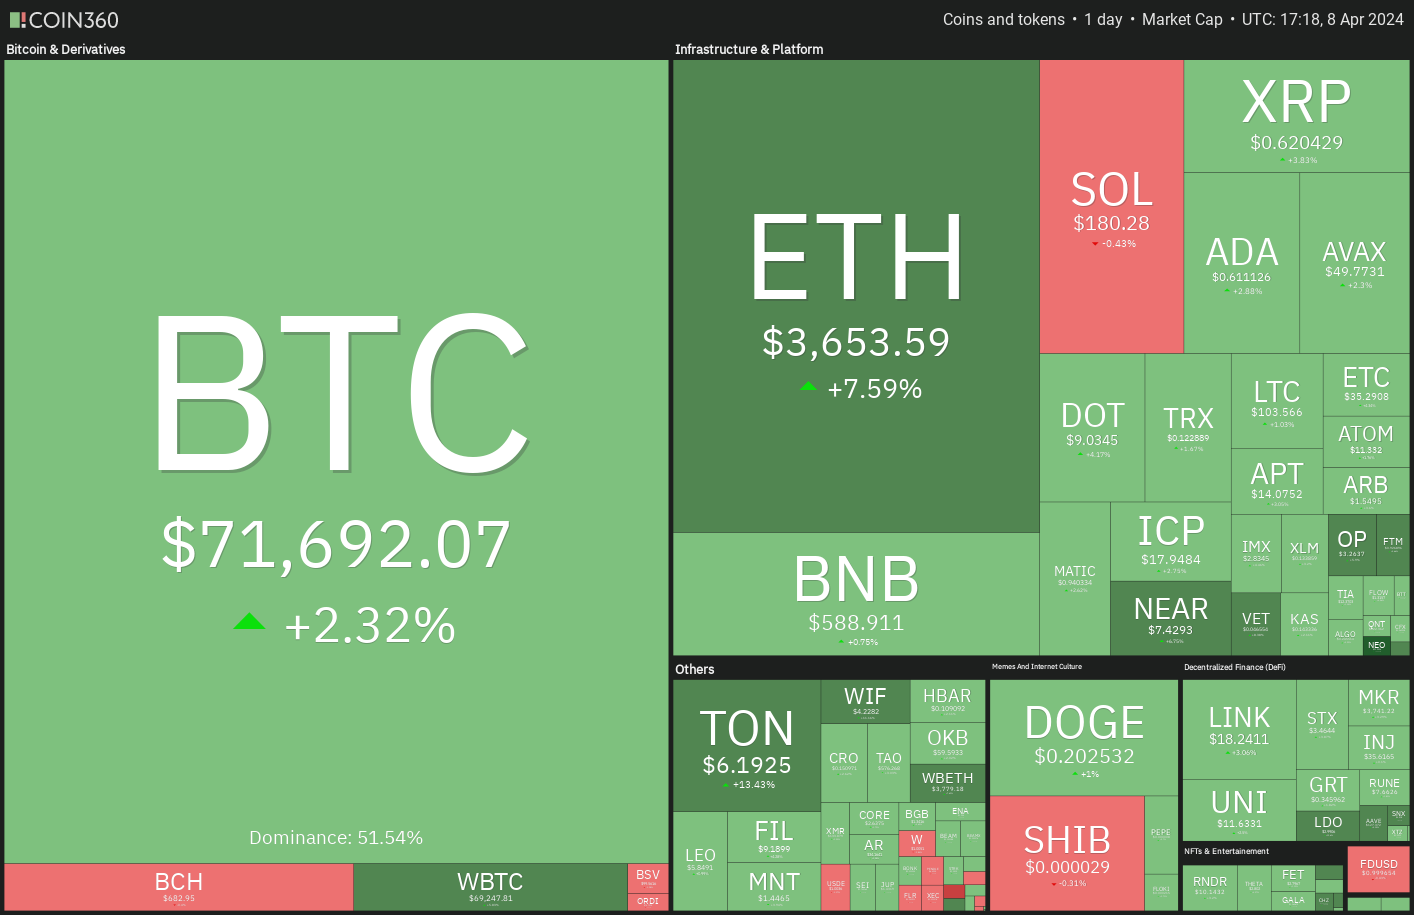
The Bitcoin halving is less than 11 days away and Bitcoin (BTC) is approaching the event with strength. This shows that the sentiment remains positive, and traders are buying on dips. CoinShares data shows digital investment products saw $646 million in inflows last week. That takes the year-to-date inflows to $13.8 billion, far higher than the $10.6 billion in 2021.
ビットコインの半減期まであと 11 日を切っており、ビットコイン (BTC) は勢いよく半減期に近づいています。これはセンチメントが引き続きポジティブであり、トレーダーが押し目買いをしていることを示している。 CoinSharesのデータによると、デジタル投資商品には先週6億4,600万ドルの流入があった。これにより、年初からの流入額は138億ドルとなり、2021年の106億ドルをはるかに上回っている。
On-chain analytics firm Santiment said in a X post that inflows into spot Bitcoin exchange-traded funds (ETFs) are likely to remain high until the Bitcoin halving. However, the firm added “it will be interesting to see whether a drop-off in ETF volume and on-chain volume will occur directly afterward.”
オンチェーン分析会社サンティメントはXポストで、スポットビットコイン上場投資信託(ETF)への資金流入はビットコイン半減期まで高止まりする可能性が高いと述べた。しかし同社は、「ETFの出来高とオンチェーンの出来高の減少がその直後に起こるかどうかは興味深いだろう」とも付け加えた。
It is difficult to determine how the markets will behave just after halving, but analysts remain bullish on the long term. SkyBridge Capital CEO Anthony Scaramucci said in an interview with CNBC that Bitcoin could soar to $170,000 during the cycle. Eventually, he expects Bitcoin to trade at “half the valuation of gold” but warns of volatility en route.
半減直後に市場がどのように反応するかを判断するのは難しいが、アナリストは長期的には強気な見方を維持している。スカイブリッジ・キャピタルのアンソニー・スカラムッチ最高経営責任者(CEO)はCNBCとのインタビューで、ビットコインがサイクル中に17万ドルまで高騰する可能性があると述べた。最終的にはビットコインが「金の評価額の半分」で取引されると同氏は予想しているが、途中でボラティリティが高まると警告している。
What are the important resistance levels to watch out for in Bitcoin and altcoins? Let’s analyze the charts to find out.
ビットコインとアルトコインで注意すべき重要な抵抗レベルは何ですか?チャートを分析して調べてみましょう。
S&P 500 Index price analysis
S&P 500 指数の価格分析
The S&P 500 Index made an outside-day candlestick pattern on April 4 and an inside-day candlestick pattern on April 5, indicating uncertainty about the next directional move.
S&P 500 指数は 4 月 4 日に日中ローソク足パターンを形成し、4 月 5 日に日中ローソク足パターンを形成し、次の方向性についての不確実性を示しました。
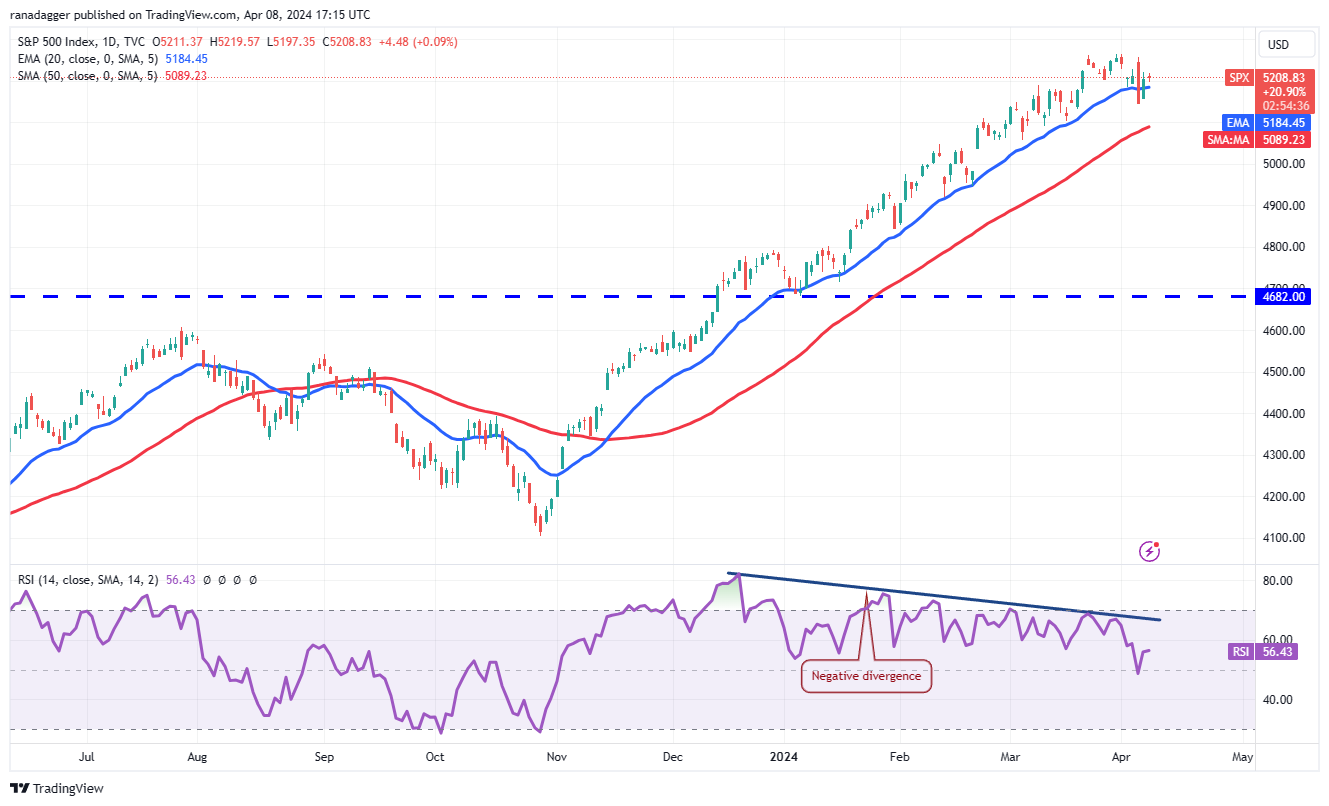
The 20-day exponential moving average (5,184) has flattened out, and the relative strength index (RSI) is in the positive zone, indicating a balance between supply and demand.
20 日間の指数移動平均 (5,184) は横ばいになり、相対力指数 (RSI) はプラスのゾーンにあり、需要と供給のバランスが取れていることを示しています。
If the price turns lower and breaks below 5,146, it will signal the start of a corrective phase. The 50-day simple moving average (5,089) may try to arrest the decline, but it is likely to be broken.
価格が下落し、5,146を下回った場合は、調整局面の開始を示すことになります。 50日単純移動平均(5,089)は下落を阻止しようとするかもしれないが、それは破られる可能性が高い。
Conversely, if the price continues higher and breaks above the all-time high of 5,265, the index will resume its uptrend. The next stop is likely to be 5,450.
逆に、価格が上昇を続けて過去最高値の5,265を超えた場合、指数は上昇傾向を再開します。次の停車駅はおそらく 5,450 駅です。
U.S. Dollar Index price analysis
米ドルインデックスの価格分析
The U.S. Dollar Index (DXY) turned down sharply from the 105 overhead resistance level on April 2, signaling that the bears are active at higher levels.
米ドル指数(DXY)は4月2日の105という直上レジスタンスレベルから急激に下落し、より高いレベルで弱気派が活発化していることを示している。
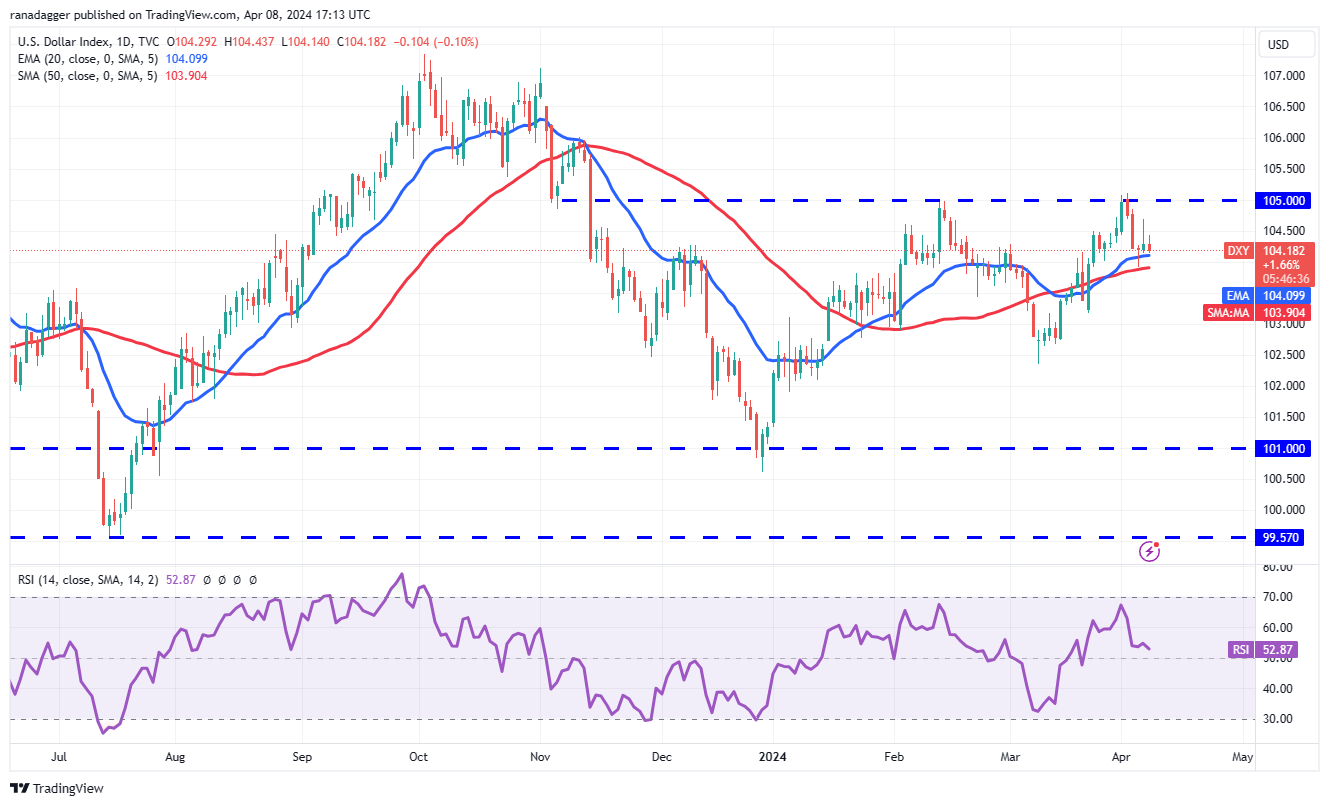
However, a minor advantage in favor of the bulls is that they did not allow the index to slide below the moving averages. This suggests that lower levels are being purchased. Selling at higher levels and buying on dips signals a possible range-bound action in the near term. The index may swing between the 50-day SMA (104) and 105 for some time.
しかし、強気派に有利な小さな利点は、指数が移動平均を下回ることを許さなかったことです。これは、より低いレベルが購入されていることを示唆しています。より高いレベルで売り、押し目で買うことは、短期的にはレンジ内での行動の可能性を示唆しています。同指数はしばらくの間、50日間SMA(104)と105の間で変動する可能性がある。
A break and close above 105 clears the path for a potential rally to 106 and then 107. On the contrary, a drop below the 50-day SMA could sink the index to 103 and subsequently to 102.
105を超えてブレイクし終値をとれば、106、そして107への上昇の可能性への道が開かれます。逆に、50日間SMAを下回る下落は指数を103まで下げ、その後102まで下げる可能性があります。
Bitcoin price analysis
ビットコイン価格分析
Bitcoin broke above the symmetrical triangle pattern on April 8, indicating that the bulls have overpowered the bears.
ビットコインは4月8日に対称的な三角形のパターンを上抜け、強気派が弱気派を圧倒したことを示した。
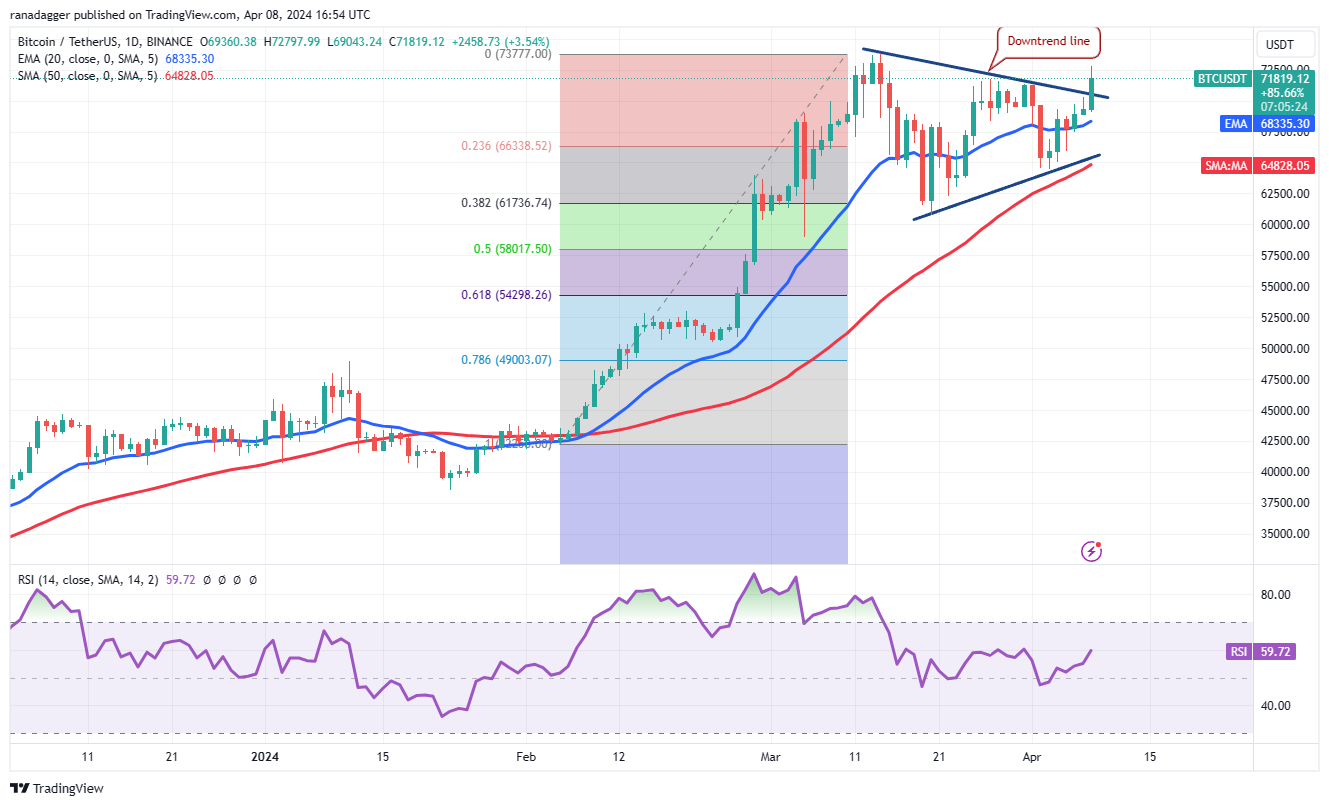
The BTC/USDT pair is likely to retest the all-time high of $73,777. This level may act as a significant barrier, but if the bulls overcome it, the pair could start the next leg of the uptrend toward the pattern target of $84,000.
BTC/USDTペアは史上最高値73,777ドルを再び試す可能性が高い。このレベルは重大な障壁として機能する可能性があるが、強気派がそれを乗り越えれば、パターンターゲットの84,000ドルに向けて上昇トレンドの次のレグが始まる可能性がある。
Time is running out for the bears. If they want to make a comeback, they will have to quickly pull the price back below the 20-day EMA ($68,335). If that happens, the pair may plunge to the 50-day SMA ($64,828).
クマたちにとって時間は残りわずかだ。彼らが巻き返しを図りたいのであれば、価格を20日間EMA(68,335ドル)以下に素早く引き下げる必要があるだろう。そうなれば、ペアは50日間SMA(64,828ドル)まで急落する可能性がある。
Ether price analysis
イーサ価格分析
Ether (ETH) has been trading between $3,056 and $3,679 for several days, indicating indecision between the bulls and the bears.
イーサ(ETH)は数日間3,056ドルから3,679ドルの間で取引されており、強気派と弱気派の間で優柔不断な態度が示されている。
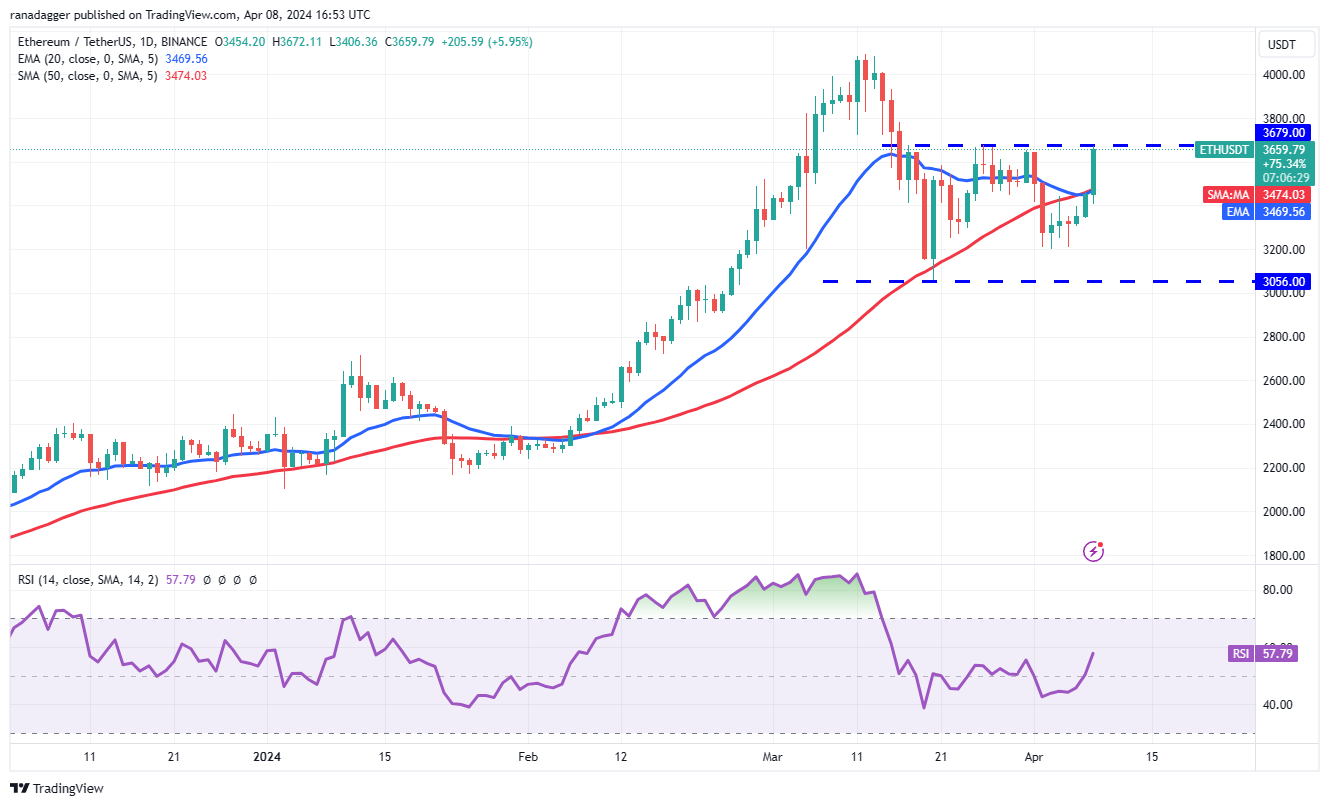
The ETH/USDT pair has reached the overhead resistance of $3,679, an important level to keep an eye on. If buyers overcome this obstacle, the pair could pick up momentum and rally to $4,093. The bears are expected to fiercely defend this level, but if the bulls prevail, the pair could start the next leg of the uptrend toward $4,488.
ETH/USDTペアは3,679ドルの直上の抵抗線に達しており、注目すべき重要なレベルとなっている。買い手がこの障害を乗り越えれば、ペアは勢いを増し、4,093ドルまで上昇する可能性がある。弱気派はこの水準を激しく守ると予想されるが、強気派が優勢であれば、4,488ドルに向けて次の上昇トレンドが始まる可能性がある。
Contrary to this assumption, if the price turns down sharply from $3,679 and breaks below the 20-day EMA, it will indicate that the range-bound action may continue for a while longer.
この想定に反して、価格が3,679ドルから急落し、20日間EMAを下回った場合、レンジ内での動きがもう少し続く可能性があることを示すことになる。
BNB price analysis
BNB価格分析
BNB (BNB) continues to trade inside the symmetrical triangle pattern, indicating a balance between supply and demand.
BNB(BNB)は対称的な三角形のパターン内で取引を続けており、需要と供給のバランスを示しています。
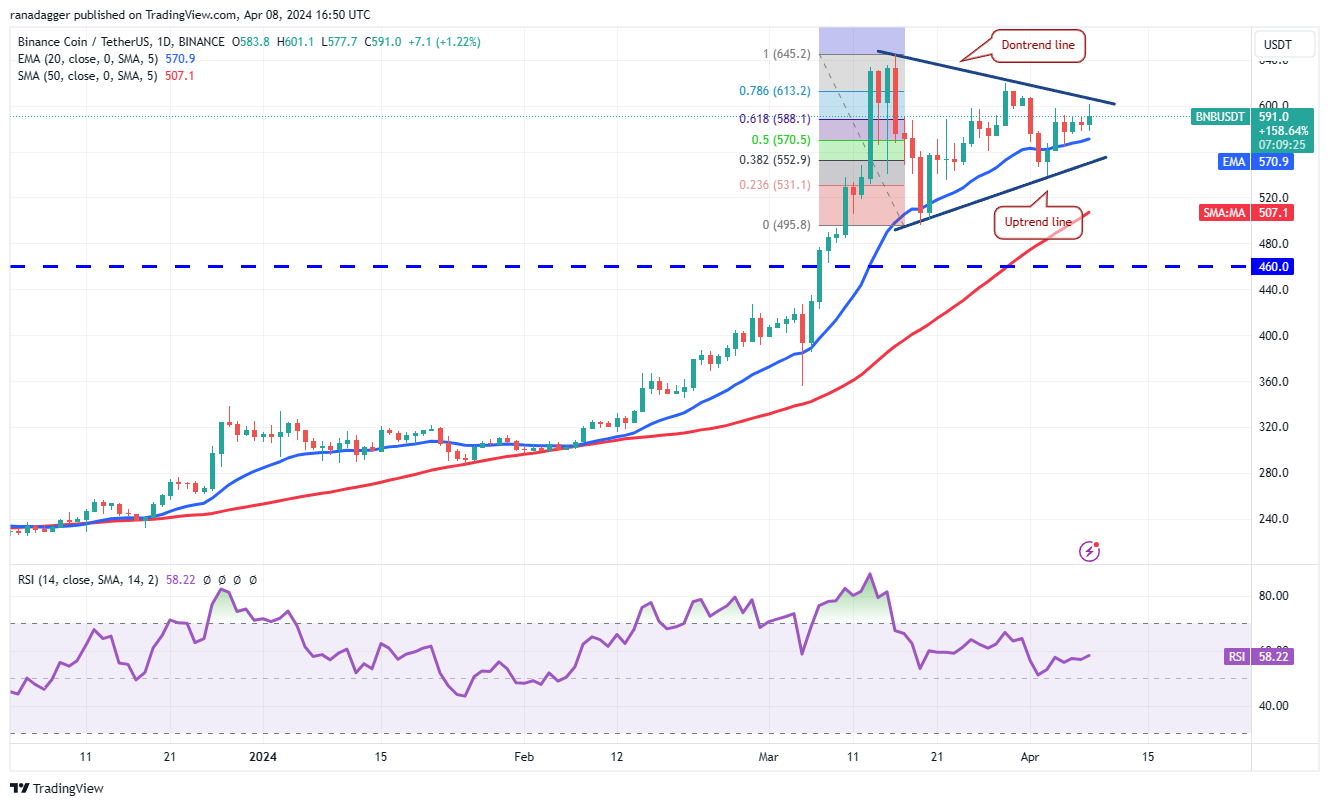
The 20-day EMA ($570) is moving up gradually, and the RSI is in the positive territory, indicating that the bulls are at a minor advantage. The BNB/USDT pair has reached the downtrend line of the triangle. If this resistance is overcome, the pair could retest the March 16 high at $645.
20日間EMA(570ドル)は徐々に上昇しており、RSIはプラスの領域にあり、強気派がわずかに有利であることを示しています。 BNB/USDTペアはトライアングルの下降トレンドラインに到達しました。この抵抗を克服できれば、3月16日の高値645ドルを再び試す可能性がある。
On the contrary, if the price turns down from the downtrend line, it will suggest that the pair may remain inside the triangle for a few more days. The bears will be in a commanding position if the price plunges below the triangle.
逆に、価格が下降トレンドラインから下落した場合は、ペアがさらに数日間三角形の中に留まる可能性があることを示唆します。価格がトライアングルを下回った場合、弱気派は優位な立場に立つことになる。
Solana price analysis
ソラナの価格分析
The bulls are struggling to sustain Solana (SOL) above the 20-day EMA ($181), indicating that the bears are defending the level.
強気派はソラナ(SOL)を20日間EMA(181ドル)を上回る水準に維持するのに苦戦しており、弱気派がその水準を守っていることを示している。
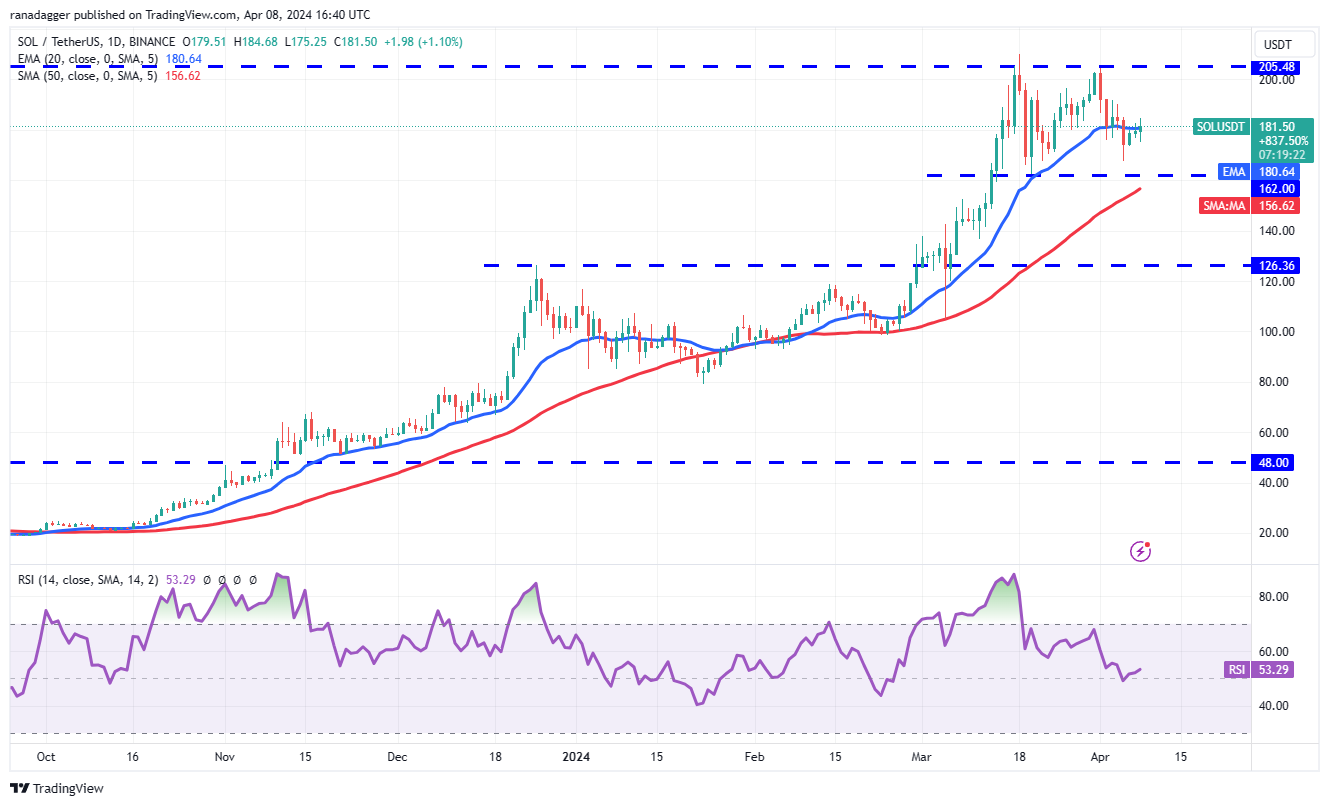
If the price turns down from the current level, the SOL/USDT pair could drop to the critical support at $162. The bulls are expected to vigorously protect this level because failing to do that could open the gates for a fall to $126.
価格が現在のレベルから下落した場合、SOL/USDTペアは重要なサポートである162ドルまで下落する可能性がある。それができなければ126ドルへの下落の扉が開く可能性があるため、強気派はこの水準を精力的に守ると予想されている。
Alternatively, if the price rebounds off $162 and rises above the 20-day EMA, it will signal that the pair may extend its stay inside the $162 to $205 range for some more time. The next leg of the uptrend could begin on a break above $205.
あるいは、価格が162ドルから反発し、20日間EMAを超えて上昇した場合、ペアが162ドルから205ドルの範囲内での滞在をしばらく延長する可能性があることを示唆するでしょう。上昇トレンドの次のレグは、205ドルを超えると始まる可能性があります。
XRP price analysis
XRP価格分析
The failure of the bears to capitalize on XRP’s (XRP) fall below the uptrend line may have attracted buyers who pushed the price above the moving averages on April 8.
弱気派がXRP(XRP)の上昇トレンドラインを下回る下落を利用できなかったことにより、4月8日の移動平均よりも価格を押し上げた買い手が集まった可能性がある。
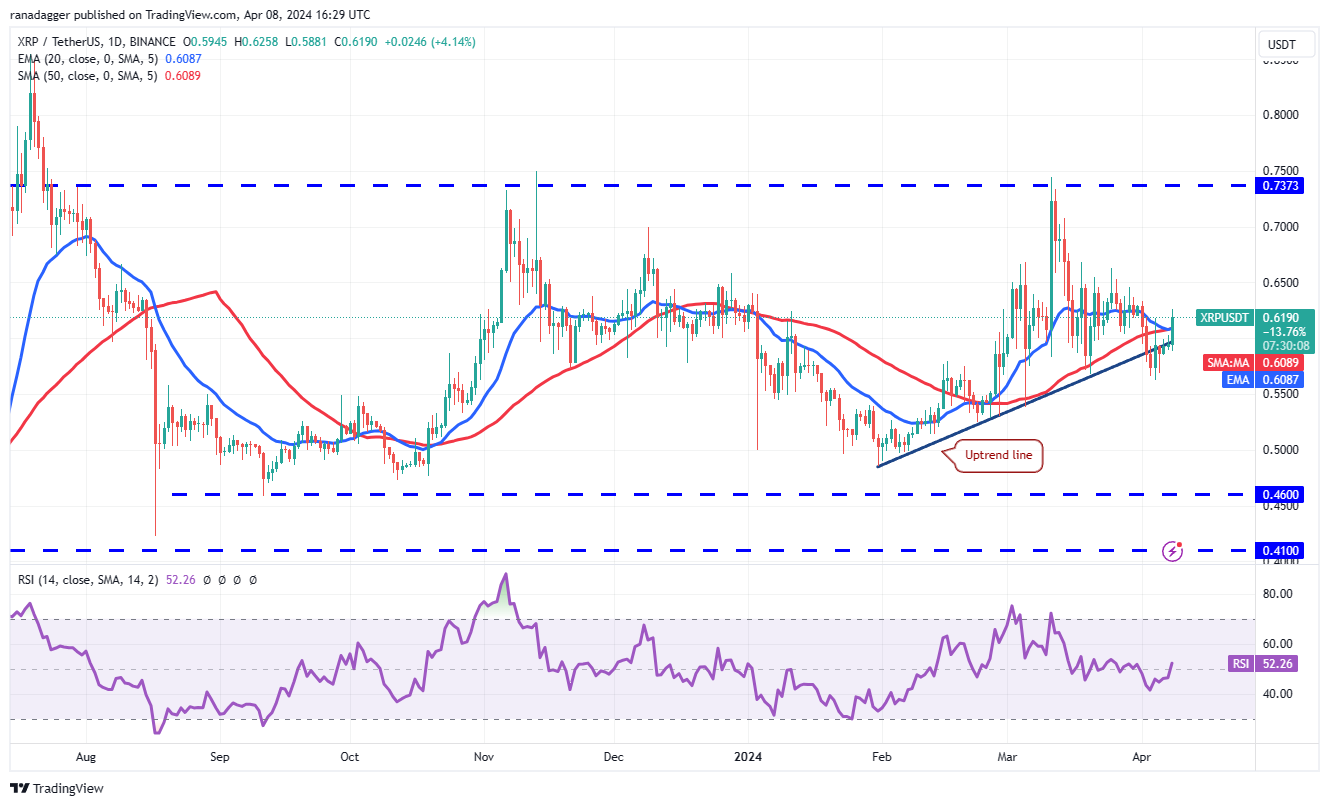
The flattish moving averages and the RSI just above the midpoint suggest a range-bound action in the near term. The XRP/USDT pair could swing between $0.56 and $0.69 for a few more days.
平坦な移動平均と中間点のすぐ上のRSIは、短期的にはレンジ内での動きを示唆しています。 XRP/USDTペアはあと数日間、0.56ドルから0.69ドルの間で変動する可能性がある。
Buyers will have to kick the price above $0.69 to enhance the prospects of a rally to the formidable resistance at $0.74. Instead, if bears want to take charge, they will have to sink and sustain the price below $0.56. The pair may then plunge to $0.52 and subsequently to $0.48.
買い手は0.74ドルの強力な抵抗線への反発の見通しを強めるために、価格を0.69ドル以上に引き上げる必要があるだろう。むしろ、弱気派が主導権を握りたい場合は、価格を0.56ドル以下に下げて維持する必要がある。その後、ペアは0.52ドルに下落し、その後0.48ドルに下落する可能性があります。
Related: Here’s what happened in crypto today
関連:今日暗号通貨で何が起こったか
Dogecoin price analysis
ドージコインの価格分析
Dogecoin (DOGE) jumped back above the 20-day EMA ($0.18) on April 6 and continued the move higher to rise above $0.19 on April 7.
ドージコイン(DOGE)は4月6日に20日間EMA(0.18ドル)を超えて急反発し、さらに上昇を続けて4月7日には0.19ドルを超えた。
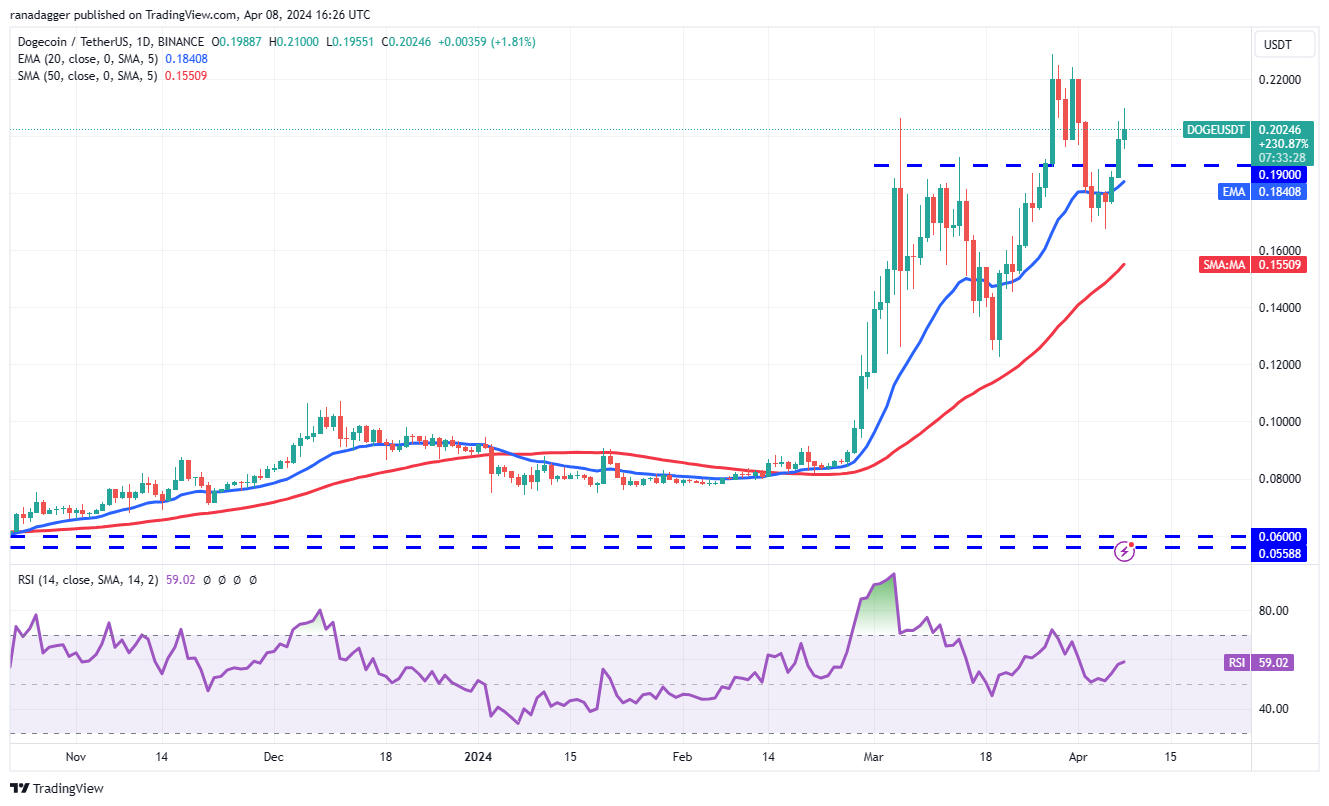
The bulls will try to maintain the momentum and push the price toward the overhead resistance at $0.23. A break and close above this level will signal the resumption of the uptrend. The DOGE/USDT pair will then attempt a rally to $0.30.
強気派はこの勢いを維持し、価格を0.23ドルの直上の抵抗線に向けて押し上げようとするだろう。このレベルを上抜けて終値をとれば、上昇トレンドの再開の合図となります。その後、DOGE/USDTペアは0.30ドルへの上昇を試みるだろう。
On the contrary, if the price slips back below the 20-day EMA, it will suggest that bears remain active at higher levels. That will increase the likelihood of a drop to the 50-day SMA ($0.15).
逆に、価格が20日間EMAを下回った場合は、弱気派がより高いレベルで活発なままであることを示唆するでしょう。そうなると、50日SMA(0.15ドル)まで下落する可能性が高まるだろう。
Cardano price analysis
カルダノの価格分析
The bulls successfully held Cardano (ADA) above $0.57 in the past few days and pushed the price to the 20-day EMA ($0.62) on April 8.
強気派は過去数日間、カルダノ(ADA)を0.57ドル以上に維持することに成功し、価格を4月8日の20日間EMA(0.62ドル)まで押し上げた。
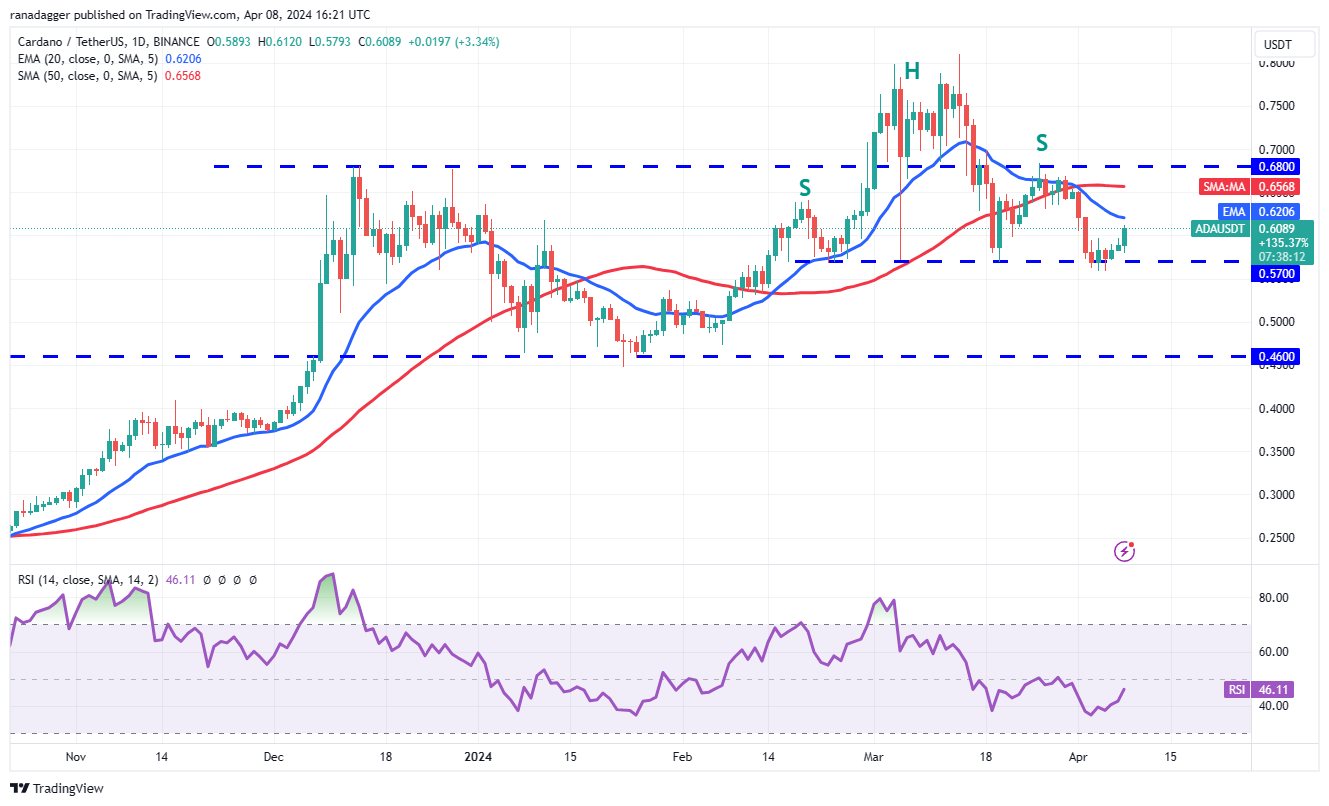
If the price turns down from the 20-day EMA, it will signal that the bears are in command. The sellers will try to sink the price below $0.57. If they manage to do that, the ADA/USDT pair will complete a bearish head-and-shoulders pattern. That could start a downward move toward the next major support at $0.46.
価格が20日間EMAから下落した場合は、弱気派が主導権を握っていることを示すことになる。売り手は価格を0.57ドル以下に引き下げようとするだろう。それができれば、ADA/USDTペアは弱気のヘッドアンドショルダーパターンを完成させることになるだろう。これにより、次の主要なサポートである0.46ドルに向けて下落が始まる可能性がある。
The first sign of strength will be a break and close above the 20-day EMA. That will open the doors for a rise to $0.68. Buyers will have to overcome this barrier to increase the possibility of a rally to $0.81.
強さを示す最初の兆候は、20日間EMAを上抜けて終了することだろう。これにより、0.68ドルへの上昇の扉が開かれることになる。買い手は0.81ドルまで上昇する可能性を高めるためにこの壁を乗り越える必要がある。
Toncoin price analysis
トンコイン価格分析
Toncoin (TON) skyrocketed above the $5.50 to $5.69 overhead resistance zone on April 8, indicating the start of the next leg of the uptrend.
トンコイン(TON)は4月8日に5.50ドルから5.69ドルの直上レジスタンスゾーンを超えて急騰し、上昇トレンドの次の区間の始まりを示した。
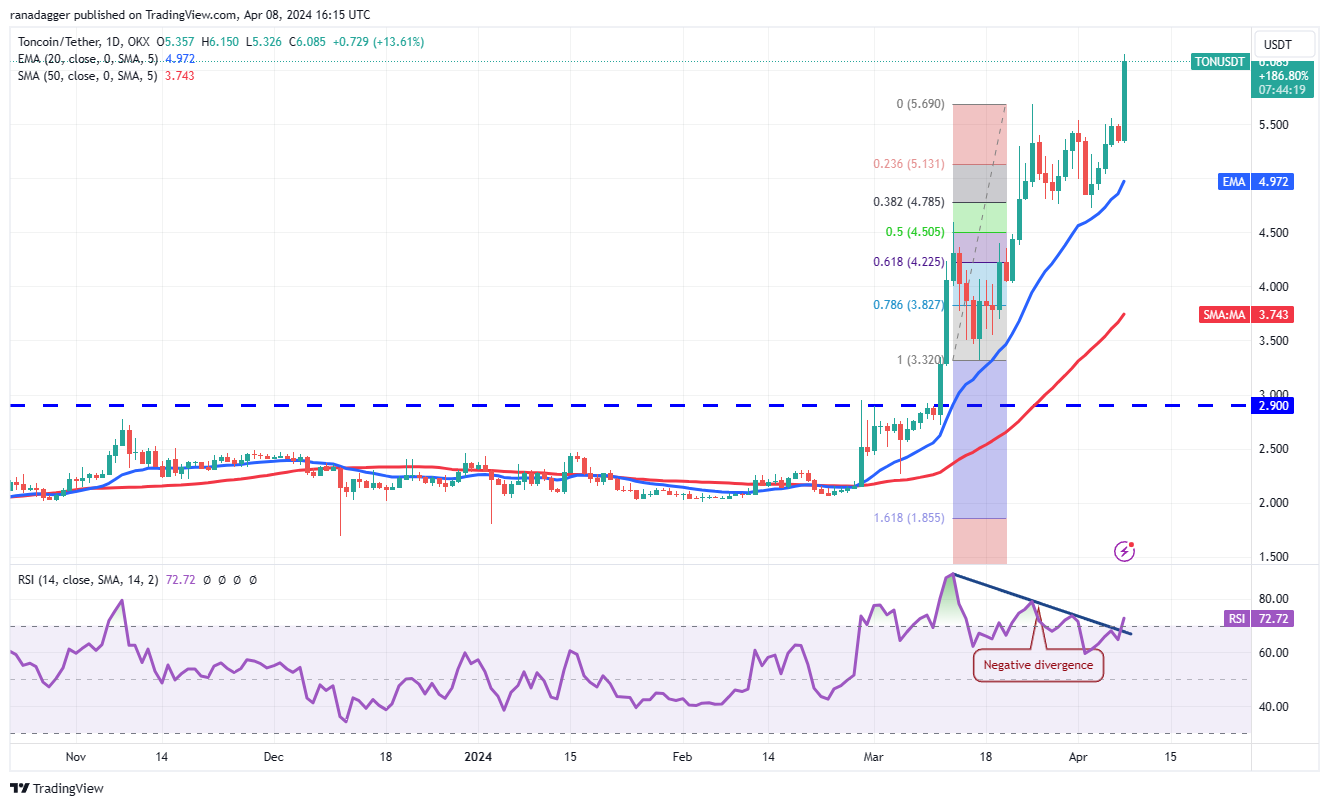
If buyers maintain the price above $5.69, the TON/USDT pair could rally to the next target objective at $7.09. The upsloping moving averages and the RSI in the overbought zone indicate that the bulls are in control.
買い手が5.69ドル以上の価格を維持すれば、TON/USDTペアは次の目標目標である7.09ドルまで上昇する可能性がある。上昇する移動平均線と買われ過ぎゾーンのRSIは、強気派が主導権を握っていることを示しています。
The bears will have to tug the price below $5.50 to trap the aggressive bulls. That could result in long liquidation, threatening the 20-day EMA ($4.97). If this level gives way, the pair may slump to $4.72 and then to the 61.8% Fibonacci retracement level of $4.22.
弱気派は攻撃的な強気派を罠にはめるために、価格を5.50ドル以下に引き下げる必要があるだろう。そうなると清算期間が長くなり、20日間EMA(4.97ドル)が脅かされる可能性がある。このレベルが崩れた場合、ペアは4.72ドルまで下落し、その後61.8%フィボナッチ・リトレースメントのレベルである4.22ドルまで下落する可能性がある。
This article does not contain investment advice or recommendations. Every investment and trading move involves risk, and readers should conduct their own research when making a decision.
この記事には投資に関するアドバイスや推奨事項は含まれません。あらゆる投資や取引の動きにはリスクが伴うため、読者は決定を下す際に独自の調査を行う必要があります。
 U_Today
 Thecoinrepublic.com
 DogeHome
 Optimisus
 Optimisus
 DeFi Planet
 Crypto Daily™
 BlockchainReporter
 TheCoinrise Media


