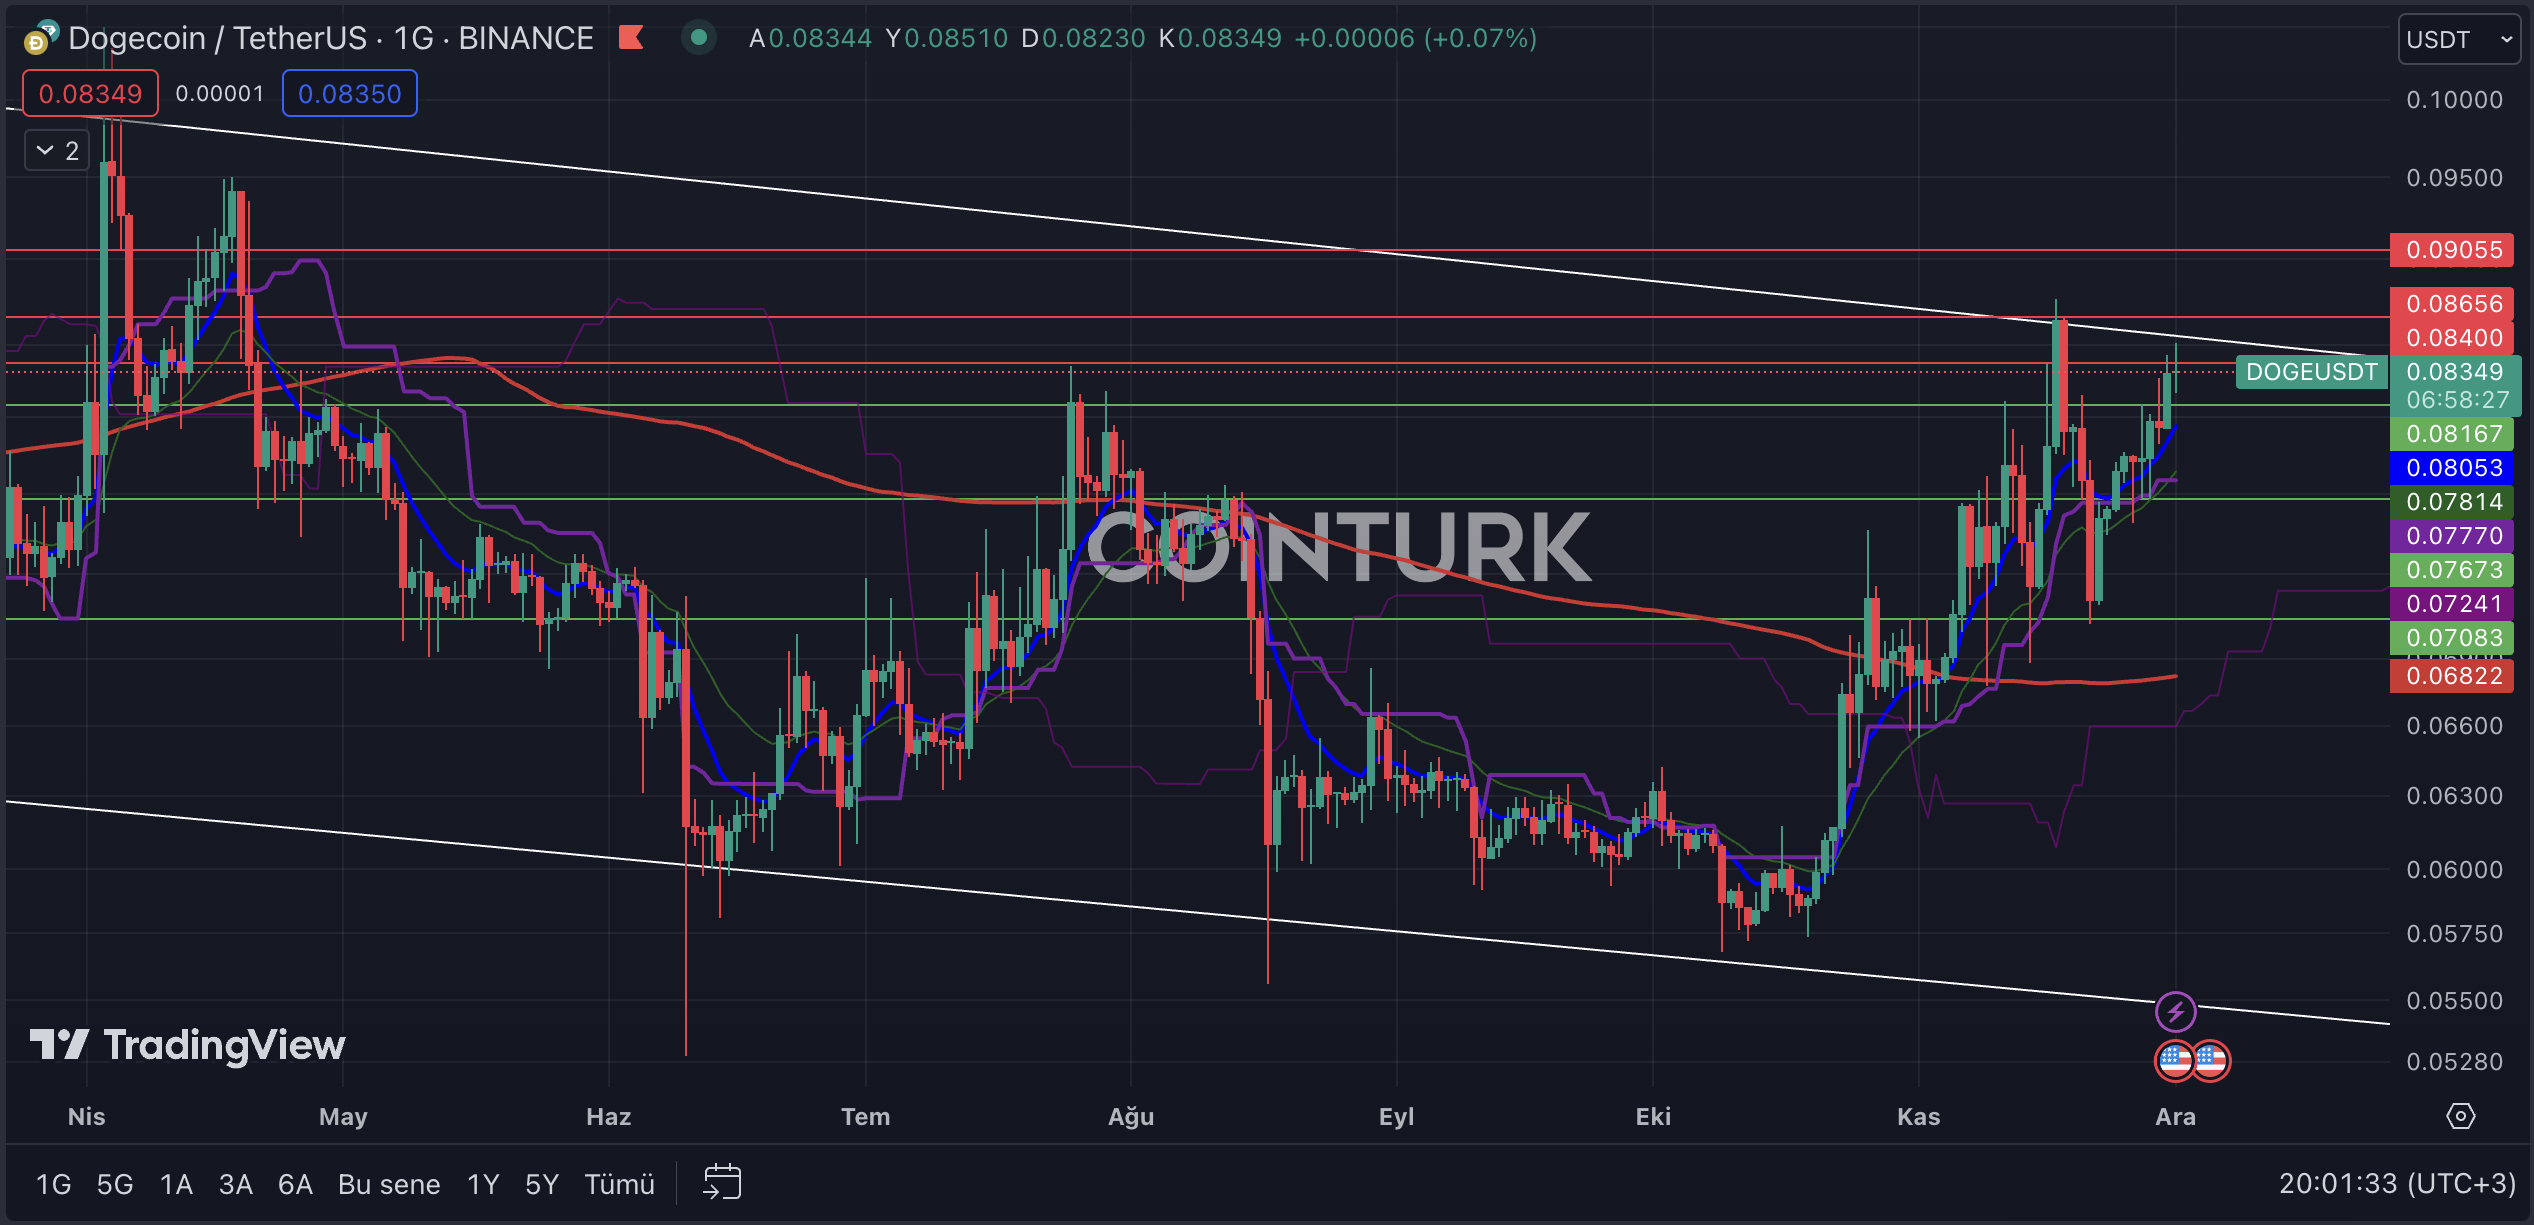
In the cryptocurrency market, technical analysis is emerging as a crucial indicator, especially for investors trading in the futures market. So, what clues does technical analysis provide for Dogecoin, which is trading at 0.08349 dollars at the time the article is written? We examine this by analyzing detailed charts and important support and resistance levels.
En el mercado de las criptomonedas, el análisis técnico se está convirtiendo en un indicador crucial, especialmente para los inversores que operan en el mercado de futuros. Entonces, ¿qué pistas proporciona el análisis técnico para Dogecoin, que se cotiza a 0,08349 dólares en el momento de escribir este artículo? Examinamos esto analizando gráficos detallados y niveles importantes de soporte y resistencia.
Dogecoin Chart Analysis
Análisis de gráficos de Dogecoin
The first notable pattern in the daily DOGE chart is the descending channel formation. In this structure, following the contact of recent upward movements with the resistance line and witnessing significant corrections thereafter, selling pressure continues in the latest bar movements.
El primer patrón notable en el gráfico diario de DOGE es la formación de un canal descendente. En esta estructura, tras el contacto de los recientes movimientos alcistas con la línea de resistencia y presenciando correcciones importantes a partir de entonces, la presión vendedora continúa en los últimos movimientos de la barra.
The most important support levels to follow on the DOGE daily chart are; 0.08167, 0.07673, and 0.07083 dollars in order. A daily bar closing below these support levels and especially below the EMA 200 (red line) will cause DOGE’s price to experience significant selling pressure.
Los niveles de soporte más importantes a seguir en el gráfico diario de DOGE son; 0,08167, 0,07673 y 0,07083 dólares en orden. Una barra diaria que cierra por debajo de estos niveles de soporte y especialmente por debajo de la EMA 200 (línea roja) hará que el precio de DOGE experimente una presión de venta significativa.
The most important resistance levels to watch on the DOGE daily chart, in turn, are; 0.08400, 0.08656, and 0.09055 dollars. Particularly, a daily bar closing above the significant hurdle of 0.08656 dollars will initiate a momentum gain for DOGE’s price, following the formation breakout.
Los niveles de resistencia más importantes a observar en el gráfico diario de DOGE, a su vez, son; 0,08400, 0,08656 y 0,09055 dólares. En particular, una barra diaria que cierre por encima del importante obstáculo de 0,08656 dólares iniciará una ganancia de impulso para el precio de DOGE, tras la ruptura de la formación.

DOGE/ETH Chart Analysis
Análisis del gráfico DOGE/ETH
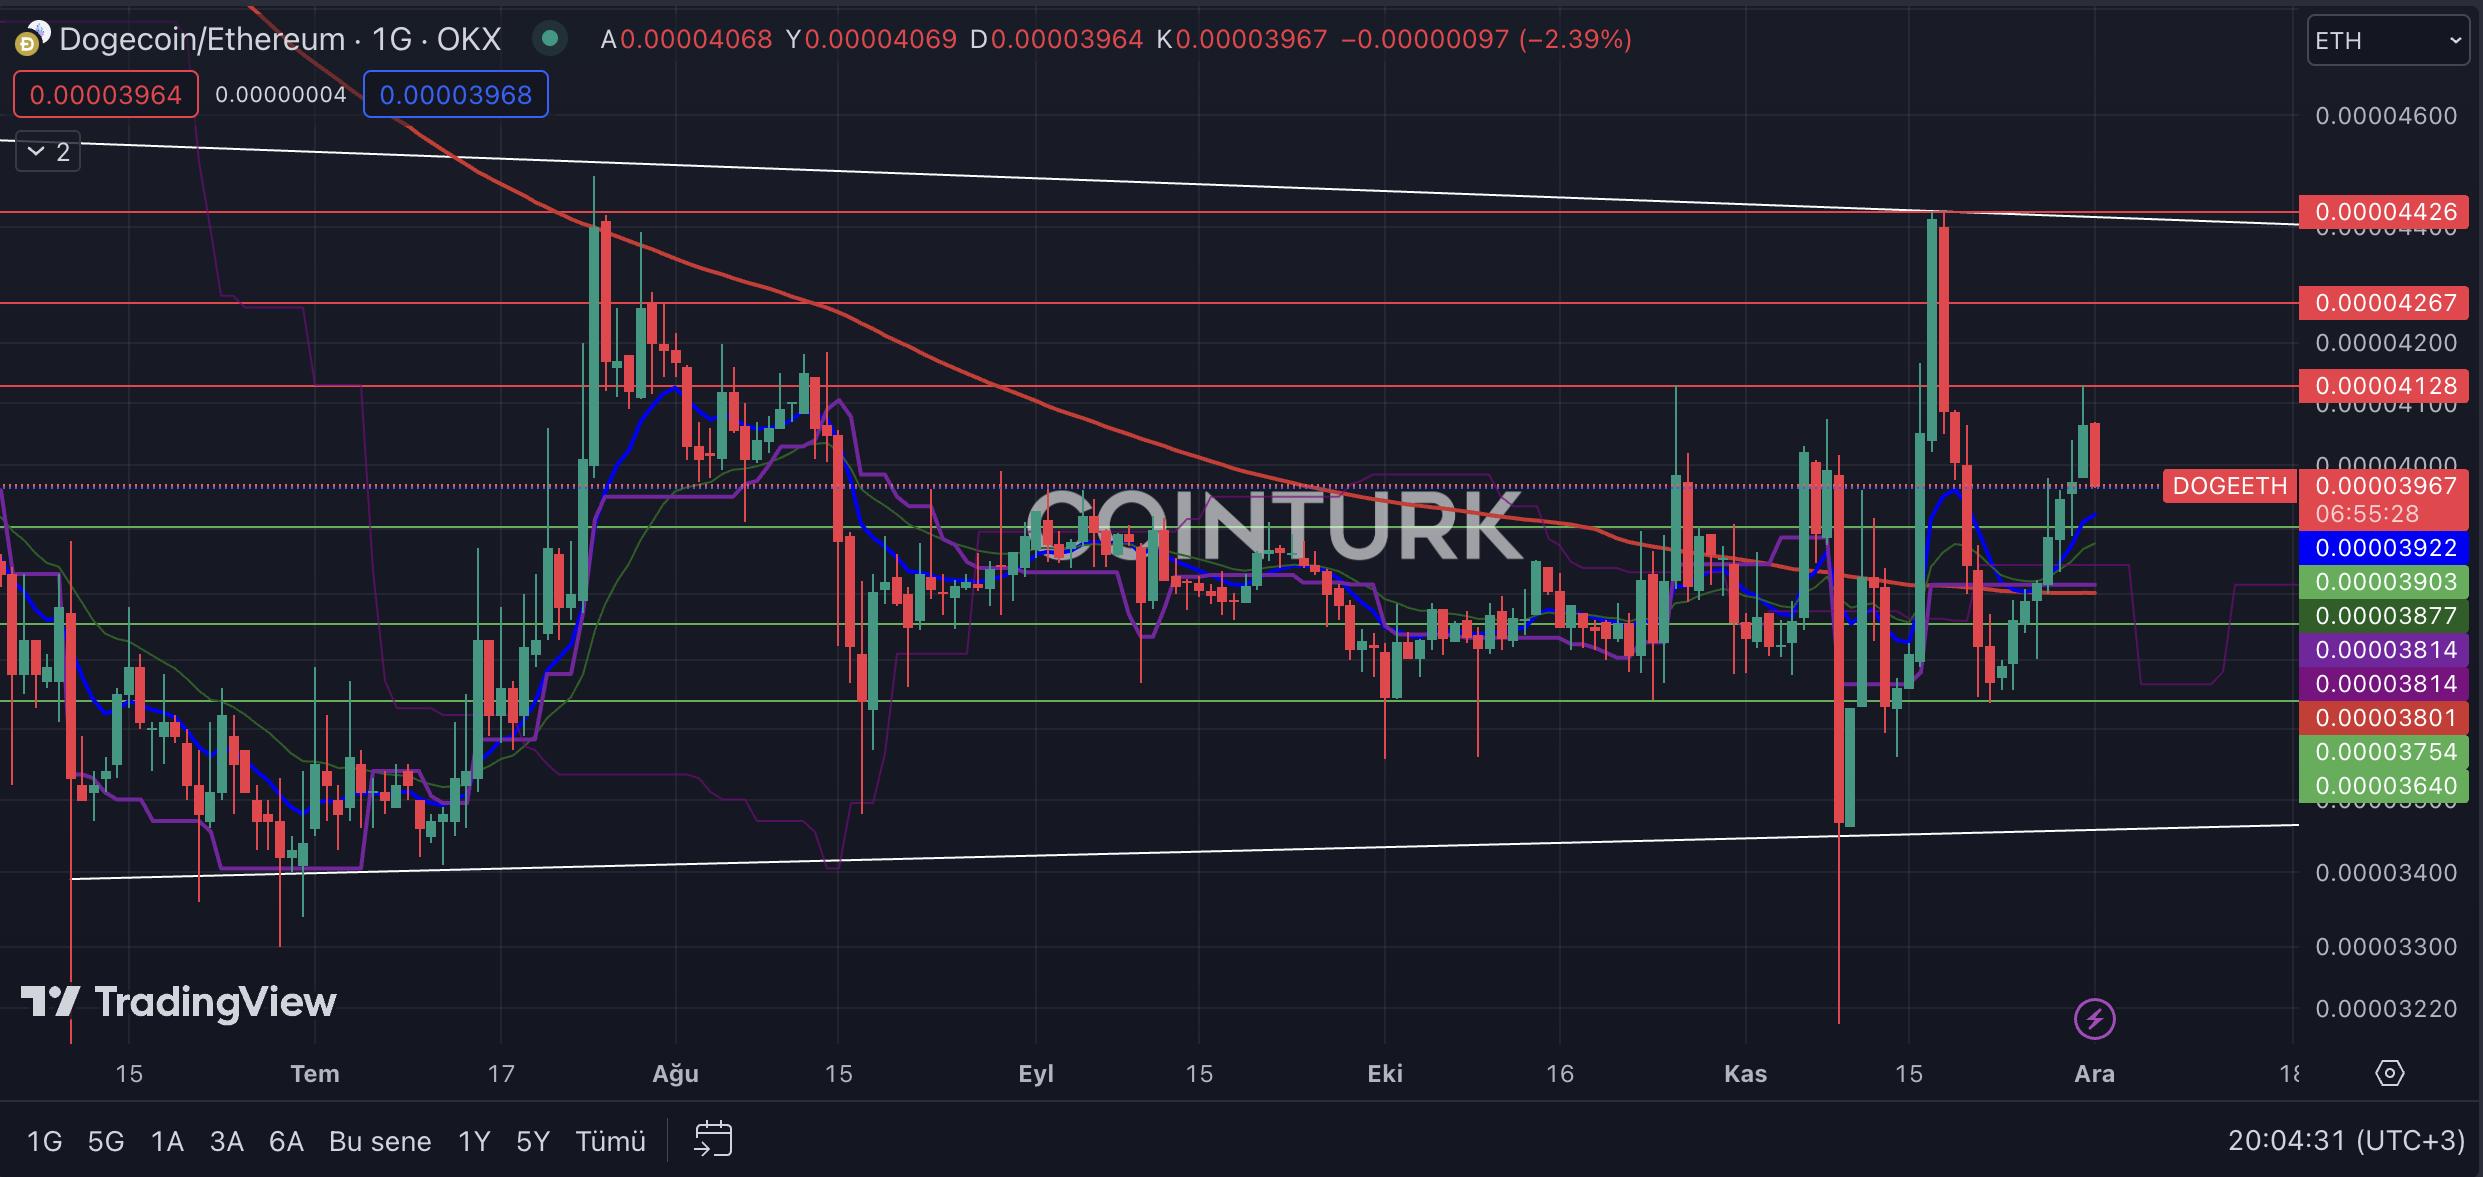
The first noticeable formation in the DOGE/ETH daily chart is the channel pattern. While the breakouts at the support level of this channel remain only as wicks, the bar closings continue to give hints about levels to watch. Particularly, the DOGE/ETH pair continues to gain value with the breaching of the EMA 200 level.
La primera formación notable en el gráfico diario DOGE/ETH es el patrón del canal. Si bien las rupturas en el nivel de soporte de este canal permanecen solo como mechas, los cierres de barras continúan dando pistas sobre los niveles a observar. En particular, el par DOGE/ETH continúa ganando valor con la superación del nivel EMA 200.
The most important support levels to monitor on the DOGE/ETH daily chart are; 0.00003903, 0.00003754, and 0.00003640, respectively. Especially, a bar closing below the critical support level of 0.00003640 will lead to DOGE’s depreciation against Ethereum.
Los niveles de soporte más importantes a monitorear en el gráfico diario DOGE/ETH son; 0,00003903, 0,00003754 y 0,00003640, respectivamente. Especialmente, una barra que se cierra por debajo del nivel de soporte crítico de 0.00003640 provocará la depreciación de DOGE frente a Ethereum.
The most important resistance levels to consider on the DOGE/ETH daily chart, in turn, are; 0.00004128, 0.00004267, and 0.00004426. Specifically, a bar closing above the significant obstacle of 0.00004426 will result in DOGE’s appreciation against Ethereum.
Los niveles de resistencia más importantes a considerar en el gráfico diario DOGE/ETH, a su vez, son; 0,00004128, 0,00004267 y 0,00004426. Específicamente, una barra que se cierra por encima del importante obstáculo de 0.00004426 resultará en la apreciación de DOGE frente a Ethereum.

- Technical analysis reveals key trends in DOGE.
- Support and resistance levels guide trading decisions.
- DOGE’s performance against Ethereum is analyzed.
El análisis técnico revela tendencias clave en DOGE.
Los niveles de soporte y resistencia guían las decisiones comerciales.
Se analiza el desempeño de DOGE frente a Ethereum.
Continuar leyendo: https://en.coin-turk.com/unveiling-dogecoins-market-position-a-technical-analysis-insight/


 DogeHome
 CryptoPotato_News
 Optimisus
 TheCoinrise
 DogeHome
 CoinsProbe
 Coin_Gabbar
 TheNewsCrypto


