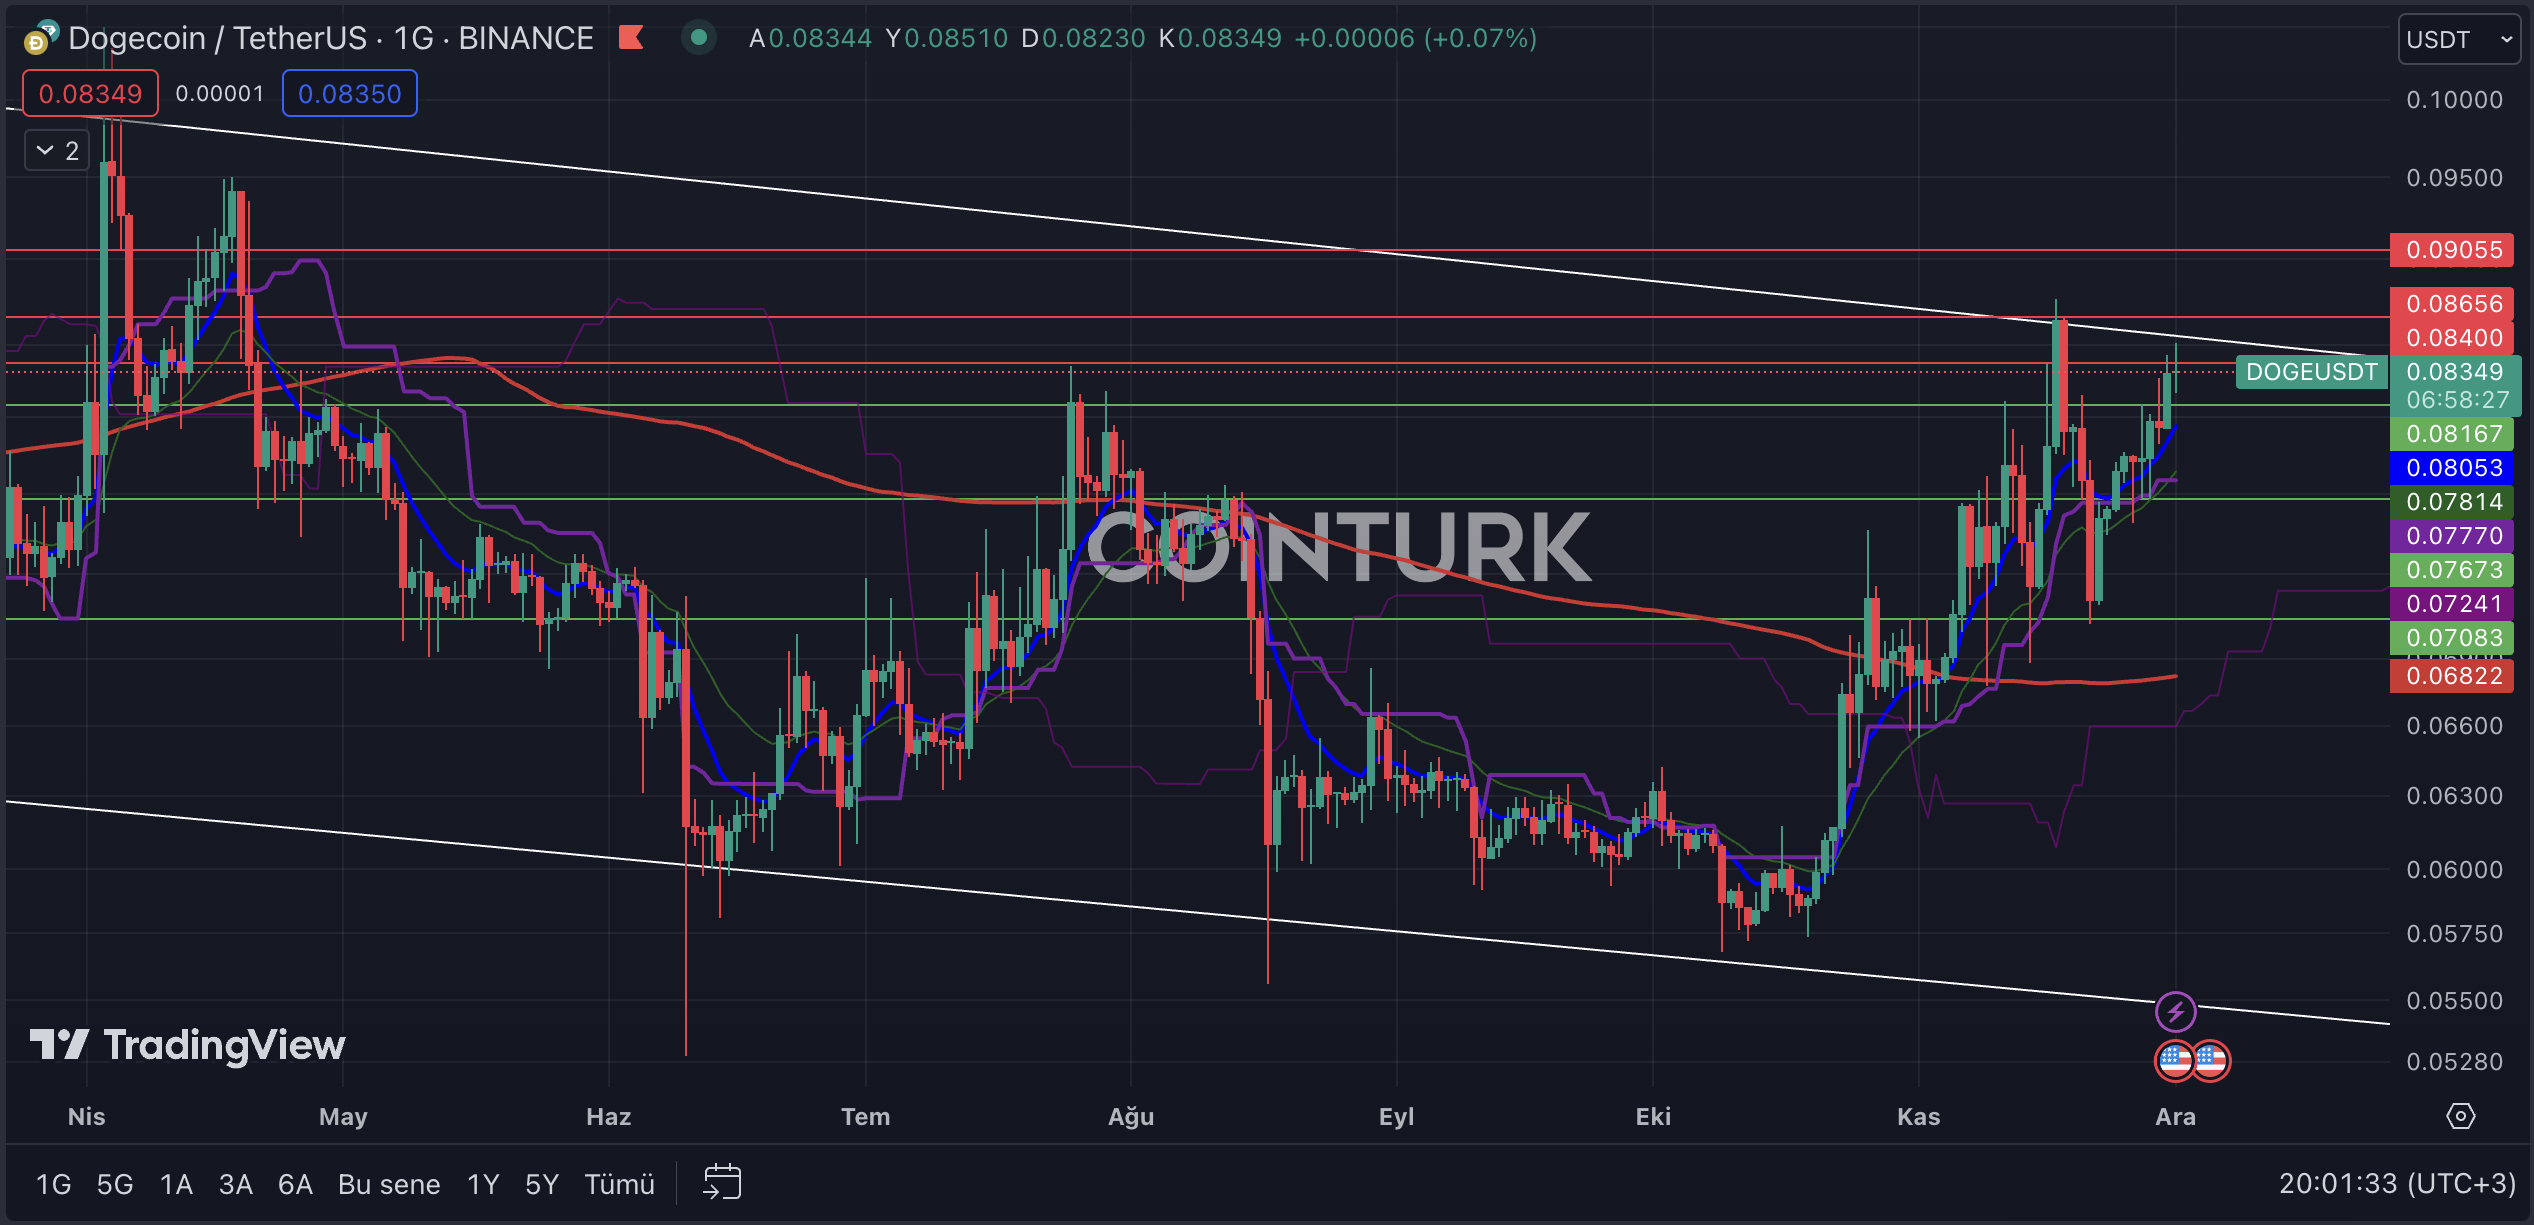
In the cryptocurrency market, technical analysis is emerging as a crucial indicator, especially for investors trading in the futures market. So, what clues does technical analysis provide for Dogecoin, which is trading at 0.08349 dollars at the time the article is written? We examine this by analyzing detailed charts and important support and resistance levels.
암호화폐 시장에서는 특히 선물시장에서 거래하는 투자자들에게 기술적 분석이 중요한 지표로 떠오르고 있습니다. 그렇다면 기사가 작성된 시점에 0.08349달러에 거래되고 있는 Dogecoin에 대해 기술적 분석은 어떤 단서를 제공합니까? 우리는 상세한 차트와 중요한 지지 및 저항 수준을 분석하여 이를 조사합니다.
Dogecoin Chart Analysis
The first notable pattern in the daily DOGE chart is the descending channel formation. In this structure, following the contact of recent upward movements with the resistance line and witnessing significant corrections thereafter, selling pressure continues in the latest bar movements.
일봉 DOGE 차트에서 첫 번째로 눈에 띄는 패턴은 하락형 채널 형성입니다. 이 구조에서는 최근 상승세가 저항선과 접촉한 후 상당한 조정이 나타난 후 최근 바 움직임에서 매도 압력이 지속됩니다.
The most important support levels to follow on the DOGE daily chart are; 0.08167, 0.07673, and 0.07083 dollars in order. A daily bar closing below these support levels and especially below the EMA 200 (red line) will cause DOGE’s price to experience significant selling pressure.
DOGE 일일 차트에서 따라야 할 가장 중요한 지원 수준은 다음과 같습니다. 0.08167, 0.07673, 0.07083달러 순입니다. 이러한 지원 수준 아래, 특히 EMA 200(빨간색 선) 아래로 마감되는 일일 막대는 DOGE의 가격에 상당한 매도 압력을 가하게 됩니다.
The most important resistance levels to watch on the DOGE daily chart, in turn, are; 0.08400, 0.08656, and 0.09055 dollars. Particularly, a daily bar closing above the significant hurdle of 0.08656 dollars will initiate a momentum gain for DOGE’s price, following the formation breakout.

DOGE/ETH Chart Analysis
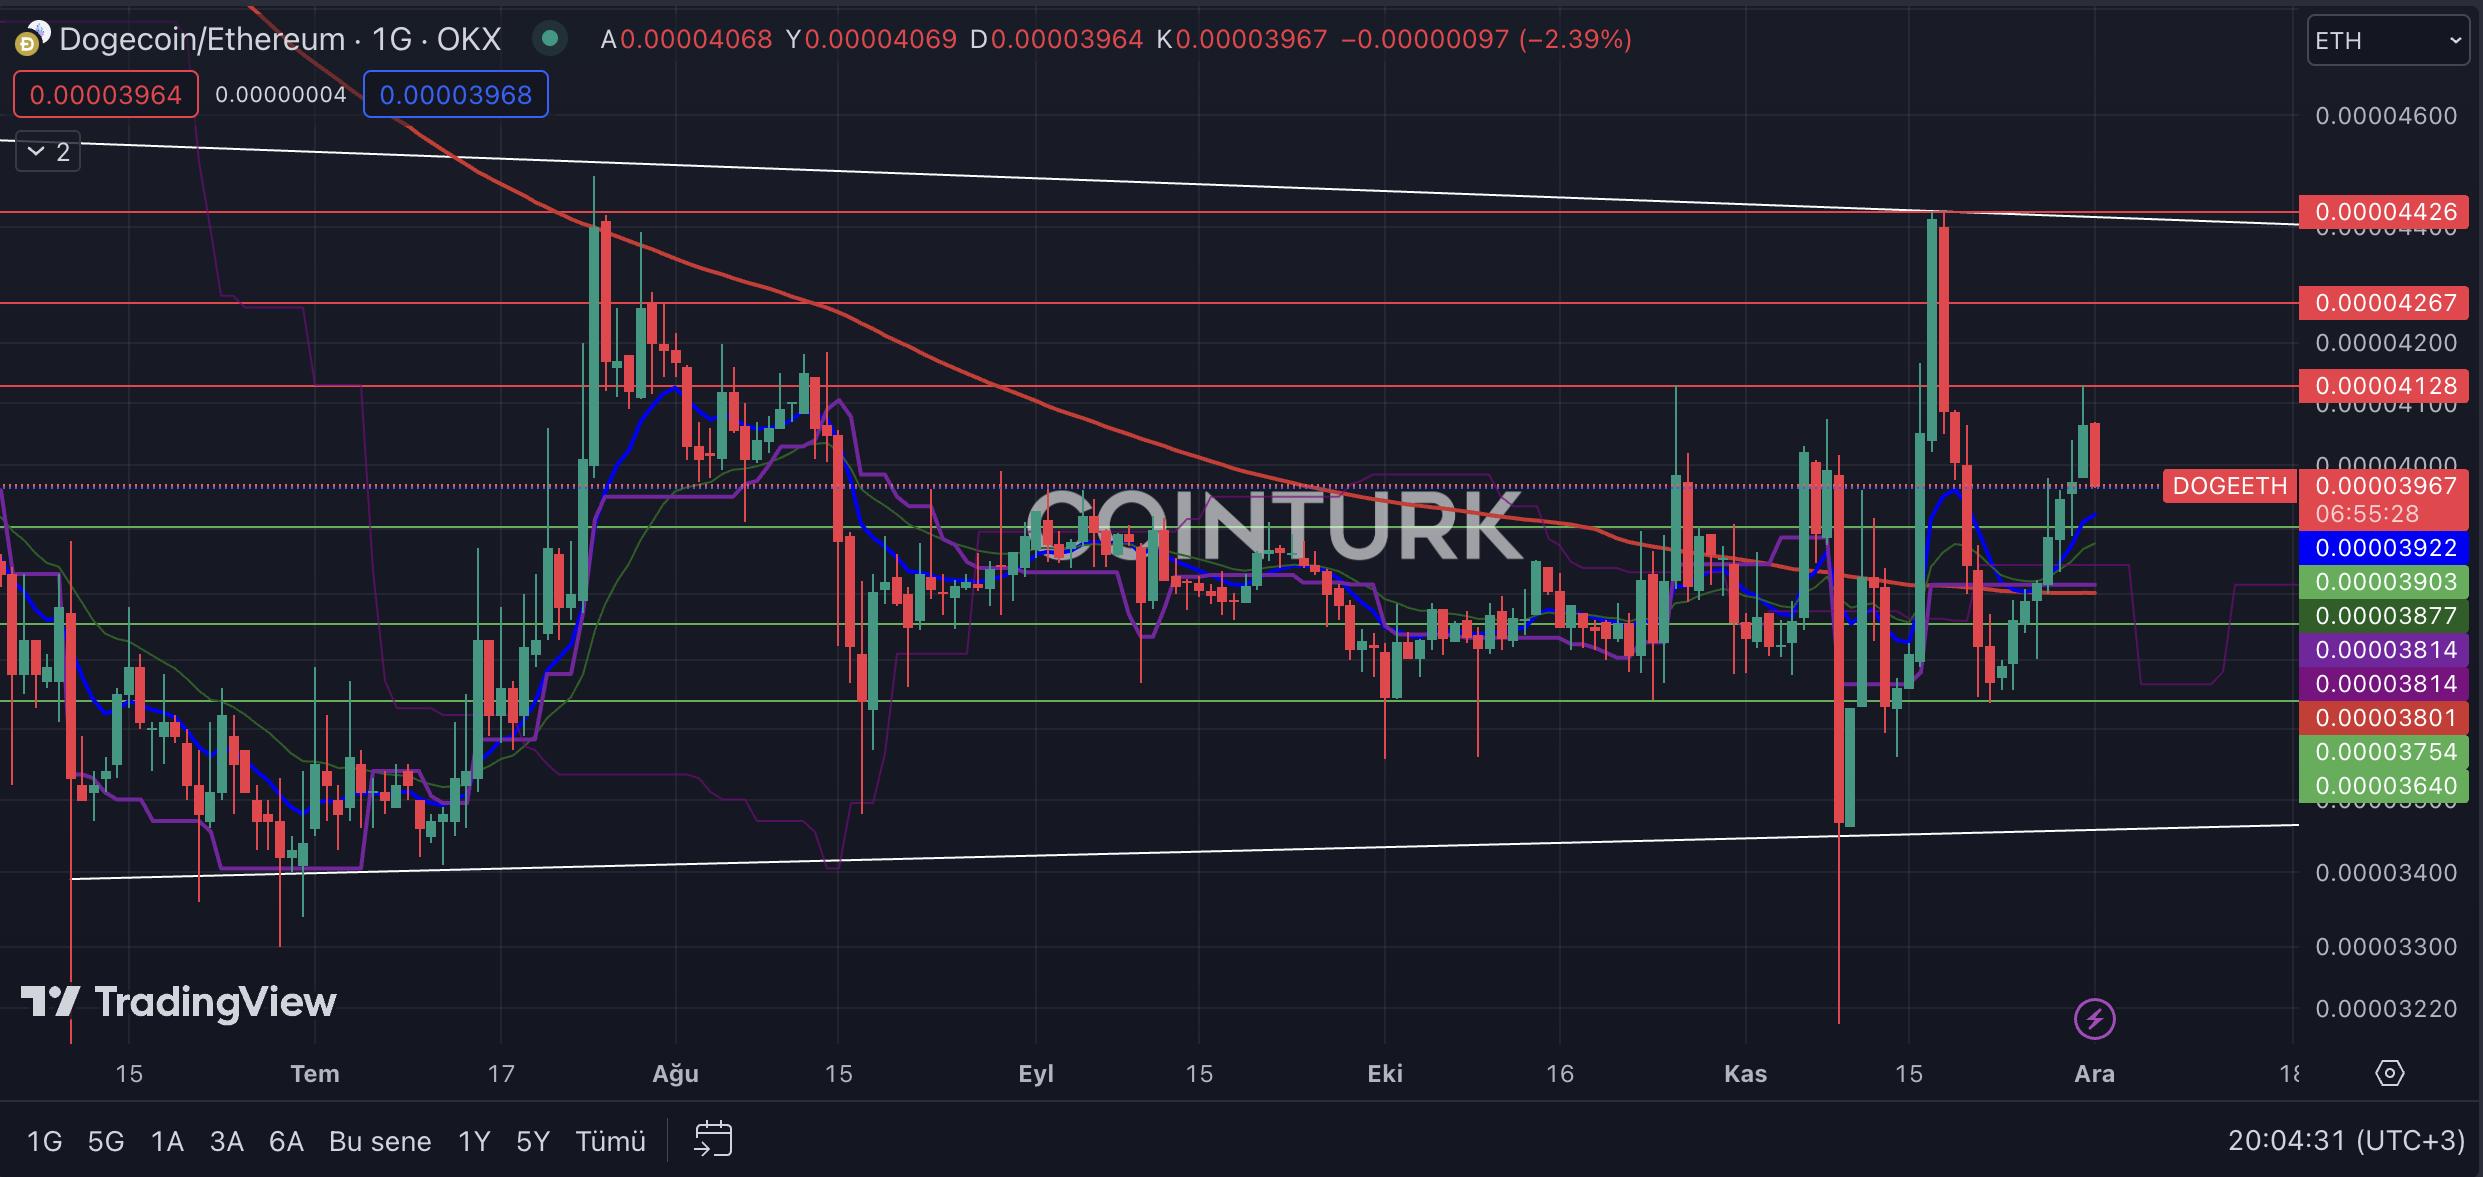
The first noticeable formation in the DOGE/ETH daily chart is the channel pattern. While the breakouts at the support level of this channel remain only as wicks, the bar closings continue to give hints about levels to watch. Particularly, the DOGE/ETH pair continues to gain value with the breaching of the EMA 200 level.
The most important support levels to monitor on the DOGE/ETH daily chart are; 0.00003903, 0.00003754, and 0.00003640, respectively. Especially, a bar closing below the critical support level of 0.00003640 will lead to DOGE’s depreciation against Ethereum.
DOGE/ETH 일일 차트에서 모니터링해야 할 가장 중요한 지원 수준은 다음과 같습니다. 각각 0.00003903, 0.00003754, 0.00003640입니다. 특히, 중요한 지원 수준인 0.00003640 아래로 마감되는 막대는 이더리움에 대한 DOGE의 가치 하락으로 이어질 것입니다.
The most important resistance levels to consider on the DOGE/ETH daily chart, in turn, are; 0.00004128, 0.00004267, and 0.00004426. Specifically, a bar closing above the significant obstacle of 0.00004426 will result in DOGE’s appreciation against Ethereum.
DOGE/ETH 일일 차트에서 고려해야 할 가장 중요한 저항 수준은 다음과 같습니다. 0.00004128, 0.00004267, 0.00004426. 구체적으로, 막대가 0.00004426이라는 중요한 장애물을 넘어 마감되면 DOGE는 이더리움에 대한 평가를 받게 됩니다.

- Technical analysis reveals key trends in DOGE.
- Support and resistance levels guide trading decisions.
- DOGE’s performance against Ethereum is analyzed.
지지 및 저항 수준은 거래 결정을 안내합니다.
계속 읽기: https://en.coin-turk.com/unveiling-dogecoins-market-position-a-technical-analytic-insight/


 BlockchainReporter
 DogeHome
 Optimisus
 CFN
CFN CaptainAltcoin
 Bitcoin Sistemi
 U_Today


