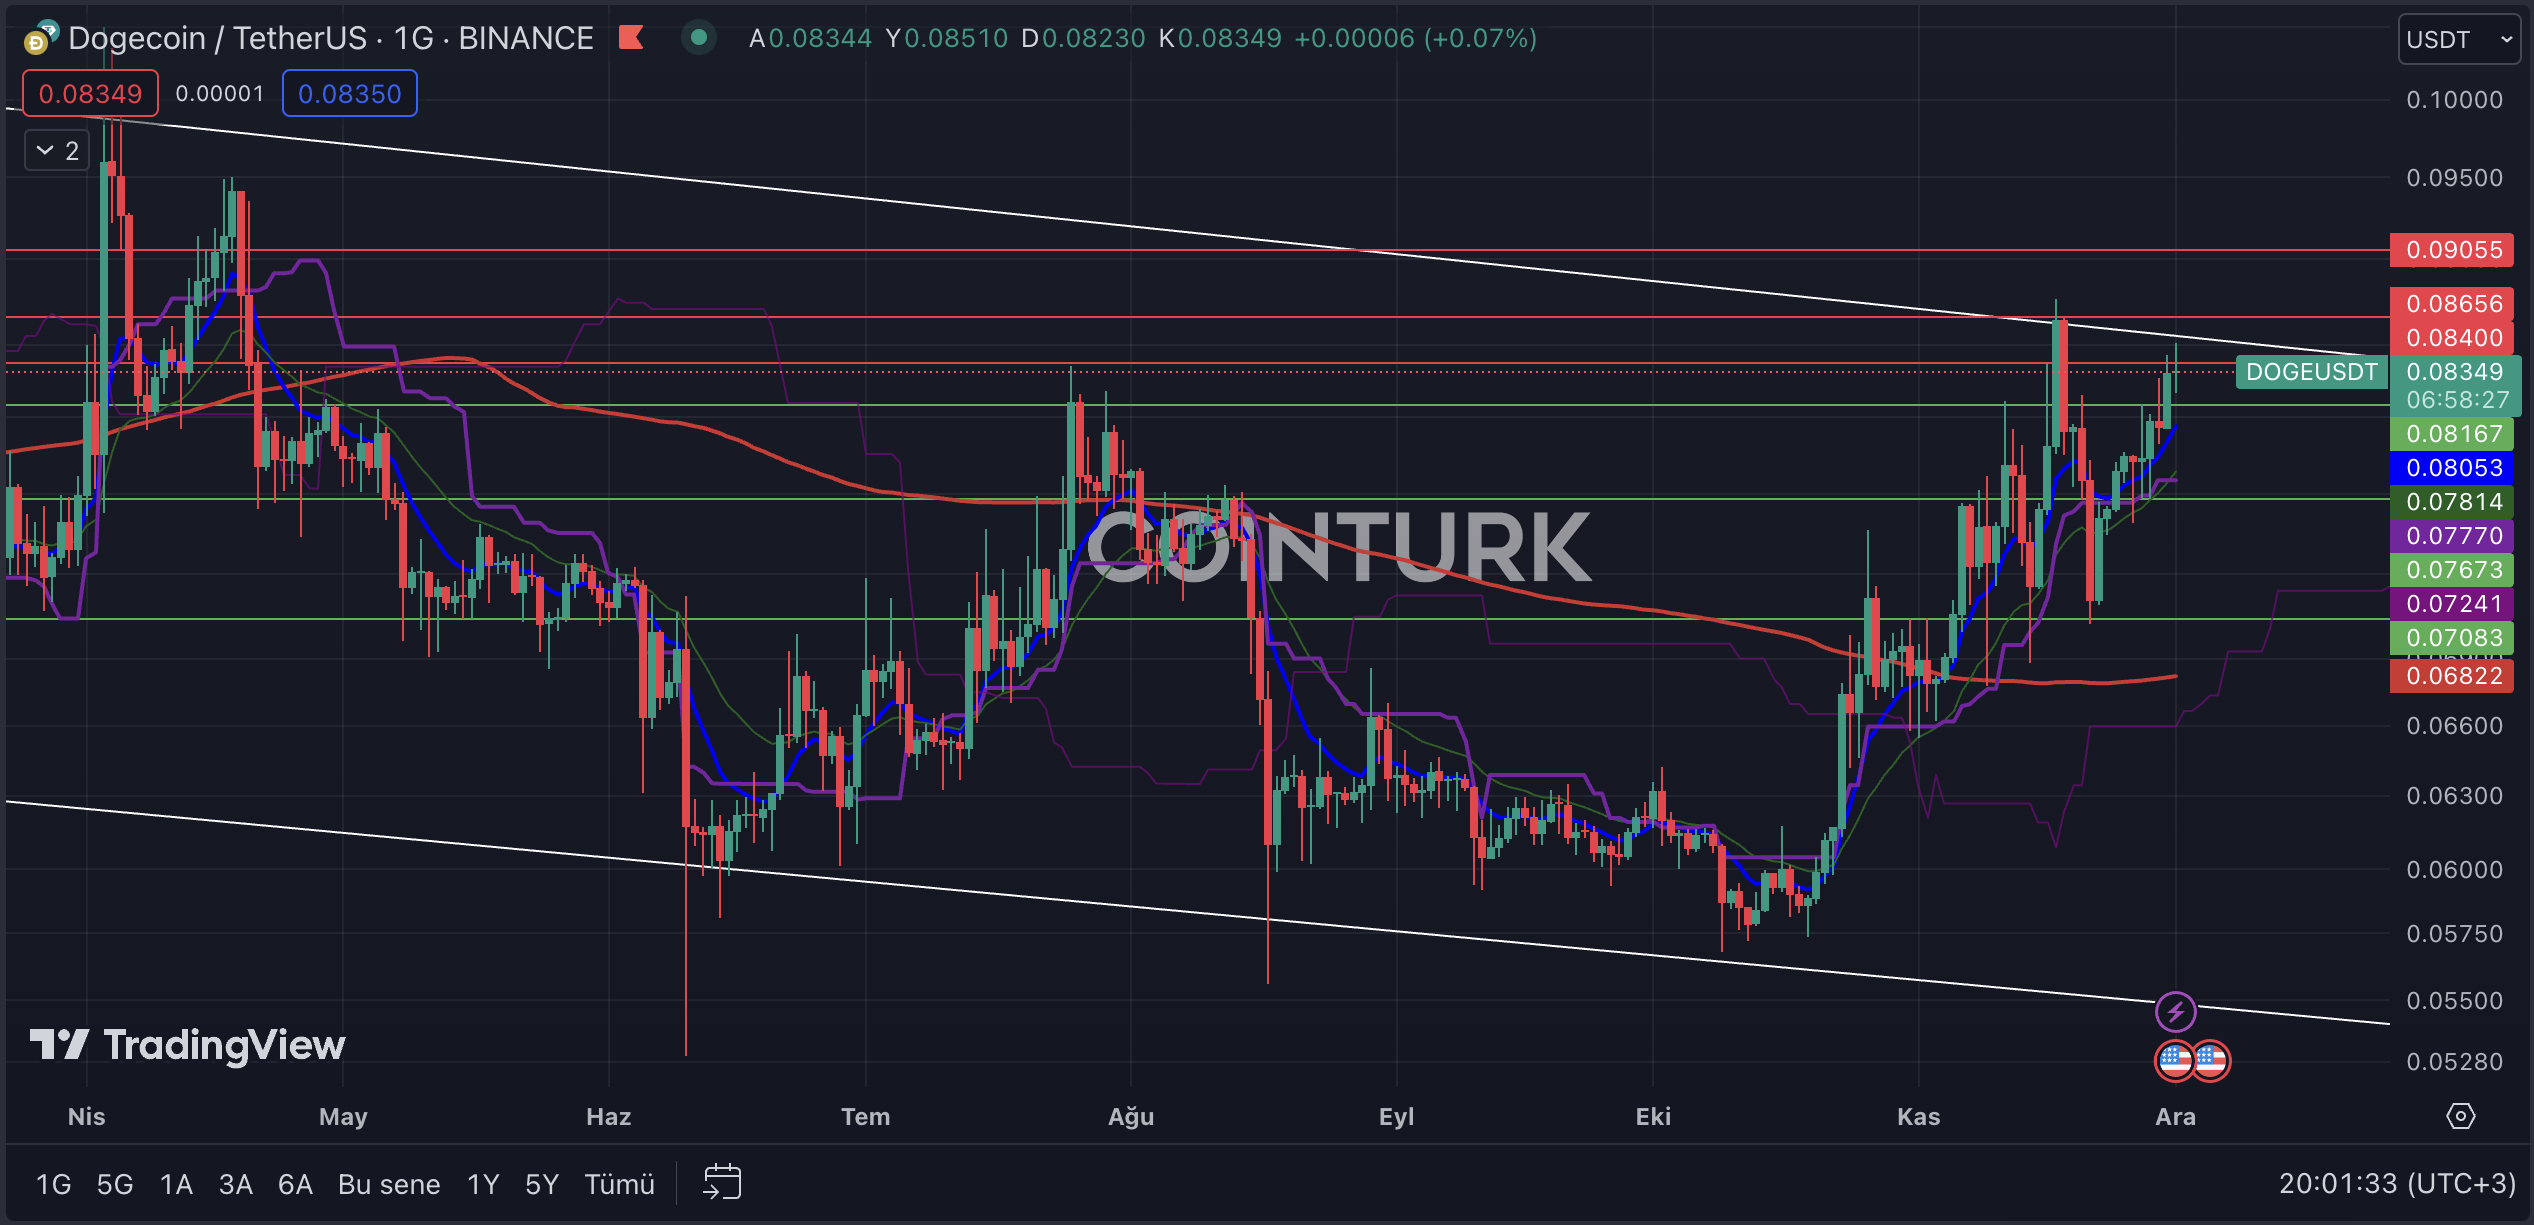
In the cryptocurrency market, technical analysis is emerging as a crucial indicator, especially for investors trading in the futures market. So, what clues does technical analysis provide for Dogecoin, which is trading at 0.08349 dollars at the time the article is written? We examine this by analyzing detailed charts and important support and resistance levels.
在加密货币市场中,技术分析正在成为一个关键指标,尤其是对于在期货市场交易的投资者而言。那么,技术分析为狗狗币(本文撰写时交易价格为 0.08349 美元)提供了哪些线索呢?我们通过分析详细图表以及重要的支撑位和阻力位来检验这一点。
Dogecoin Chart Analysis
狗狗币图表分析
The first notable pattern in the daily DOGE chart is the descending channel formation. In this structure, following the contact of recent upward movements with the resistance line and witnessing significant corrections thereafter, selling pressure continues in the latest bar movements.
每日 DOGE 图表中第一个值得注意的模式是下降通道形成。在这种结构中,在最近的向上运动与阻力线接触并随后出现重大修正之后,在最近的柱形运动中,卖压仍在继续。
The most important support levels to follow on the DOGE daily chart are; 0.08167, 0.07673, and 0.07083 dollars in order. A daily bar closing below these support levels and especially below the EMA 200 (red line) will cause DOGE’s price to experience significant selling pressure.
DOGE 日线图上最重要的支撑位是:依次为 0.08167、0.07673 和 0.07083 美元。日线收盘价低于这些支撑位,特别是低于 EMA 200(红线)将导致 DOGE 的价格承受巨大的抛售压力。
The most important resistance levels to watch on the DOGE daily chart, in turn, are; 0.08400, 0.08656, and 0.09055 dollars. Particularly, a daily bar closing above the significant hurdle of 0.08656 dollars will initiate a momentum gain for DOGE’s price, following the formation breakout.
反过来,DOGE 日线图上最重要的阻力位是: 0.08400、0.08656 和 0.09055 美元。特别是,日线收盘价高于 0.08656 美元的重要障碍将在形成突破后引发 DOGE 价格的动量上涨。

DOGE/ETH Chart Analysis
DOGE/ETH 图表分析
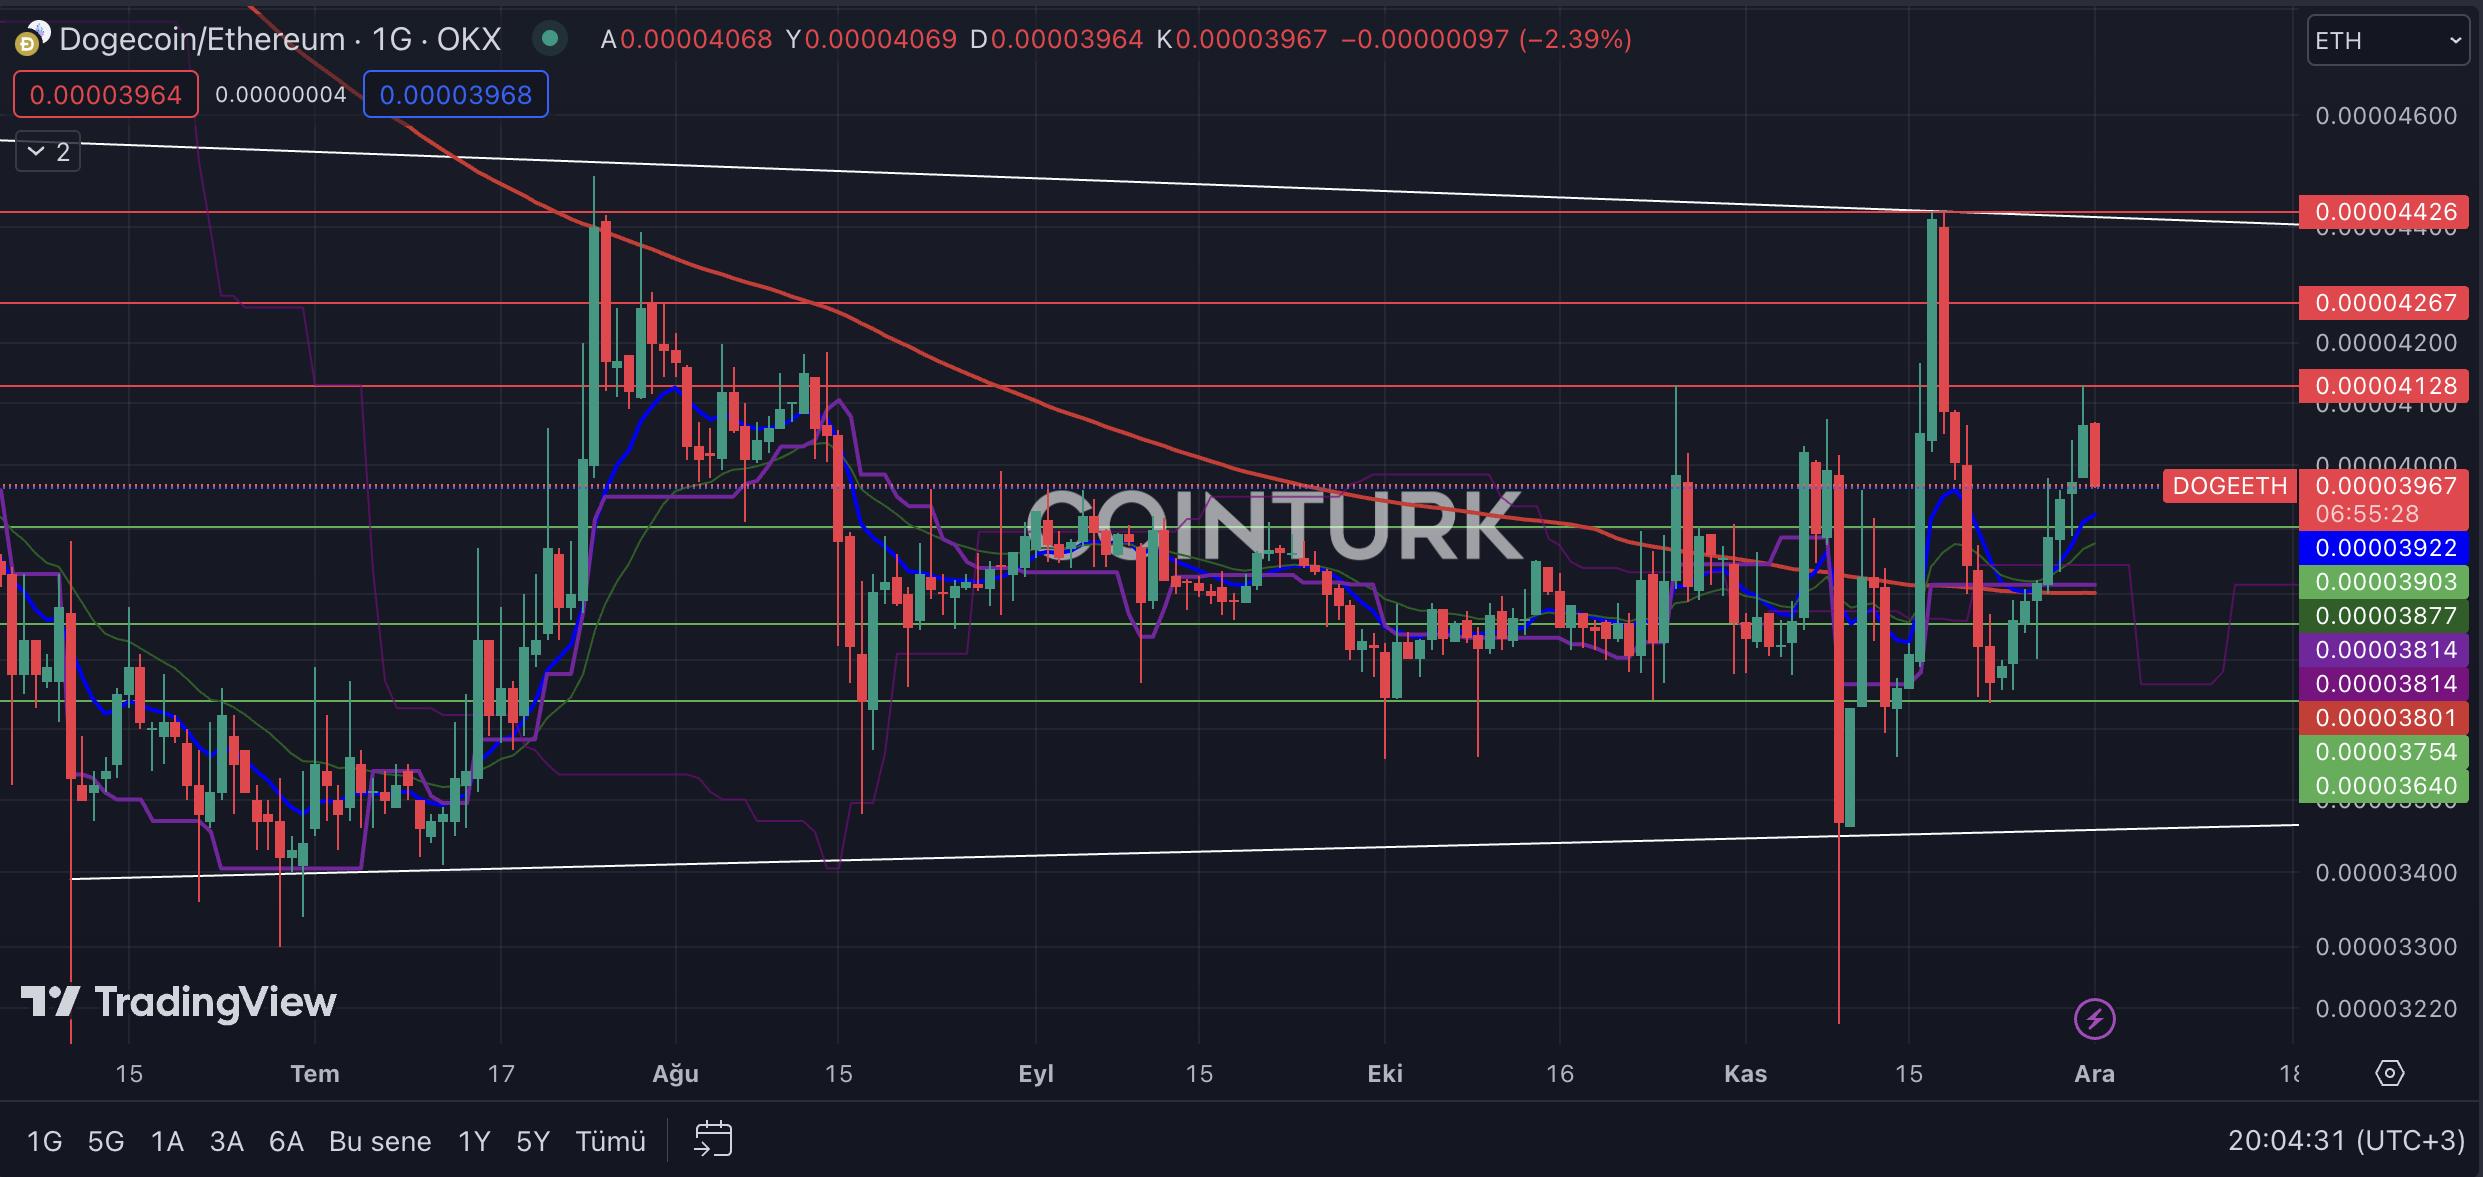
The first noticeable formation in the DOGE/ETH daily chart is the channel pattern. While the breakouts at the support level of this channel remain only as wicks, the bar closings continue to give hints about levels to watch. Particularly, the DOGE/ETH pair continues to gain value with the breaching of the EMA 200 level.
DOGE/ETH 日线图中第一个值得注意的形态是通道形态。虽然该通道支撑位的突破仅保留为灯芯,但收盘价继续暗示值得关注的水平。特别是,随着突破 EMA 200 水平,DOGE/ETH 货币对继续增值。
The most important support levels to monitor on the DOGE/ETH daily chart are; 0.00003903, 0.00003754, and 0.00003640, respectively. Especially, a bar closing below the critical support level of 0.00003640 will lead to DOGE’s depreciation against Ethereum.
DOGE/ETH 日线图上需要监控的最重要的支撑位是:分别为 0.00003903、0.00003754 和 0.00003640。特别是,收盘价低于关键支撑位 0.00003640 将导致 DOGE 对以太坊贬值。
The most important resistance levels to consider on the DOGE/ETH daily chart, in turn, are; 0.00004128, 0.00004267, and 0.00004426. Specifically, a bar closing above the significant obstacle of 0.00004426 will result in DOGE’s appreciation against Ethereum.
DOGE/ETH 日线图上需要考虑的最重要的阻力位是: 0.00004128、0.00004267 和 0.00004426。具体来说,收盘价高于 0.00004426 的重大障碍将导致 DOGE 对以太坊升值。

- Technical analysis reveals key trends in DOGE.
- Support and resistance levels guide trading decisions.
- DOGE’s performance against Ethereum is analyzed.
技术分析揭示了 DOGE 的主要趋势。
支撑位和阻力位指导交易决策。
分析了 DOGE 相对于以太坊的表现。
继续阅读:https://en.coin-turk.com/unveiling-dogecoins-market-position-a-technical-analysis-insight/


 BlockchainReporter
 DogeHome
 Optimisus
 CFN
CFN CaptainAltcoin
 Bitcoin Sistemi
 U_Today


