In the cryptocurrency market, technical analysis is emerging as a crucial indicator, especially for investors trading in the futures market. So, what clues does technical analysis provide for Dogecoin, which is trading at 0.08349 dollars at the time the article is written? We examine this by analyzing detailed charts and important support and resistance levels.
在加密貨幣市場中,技術分析正在成為一個關鍵指標,尤其是對於在期貨市場交易的投資者。那麼,技術分析為狗狗幣(本文撰寫時交易價格為 0.08349 美元)提供了哪些線索呢?我們透過分析詳細圖表以及重要的支撐位和阻力位來檢驗這一點。
Dogecoin Chart Analysis
狗狗幣圖表分析
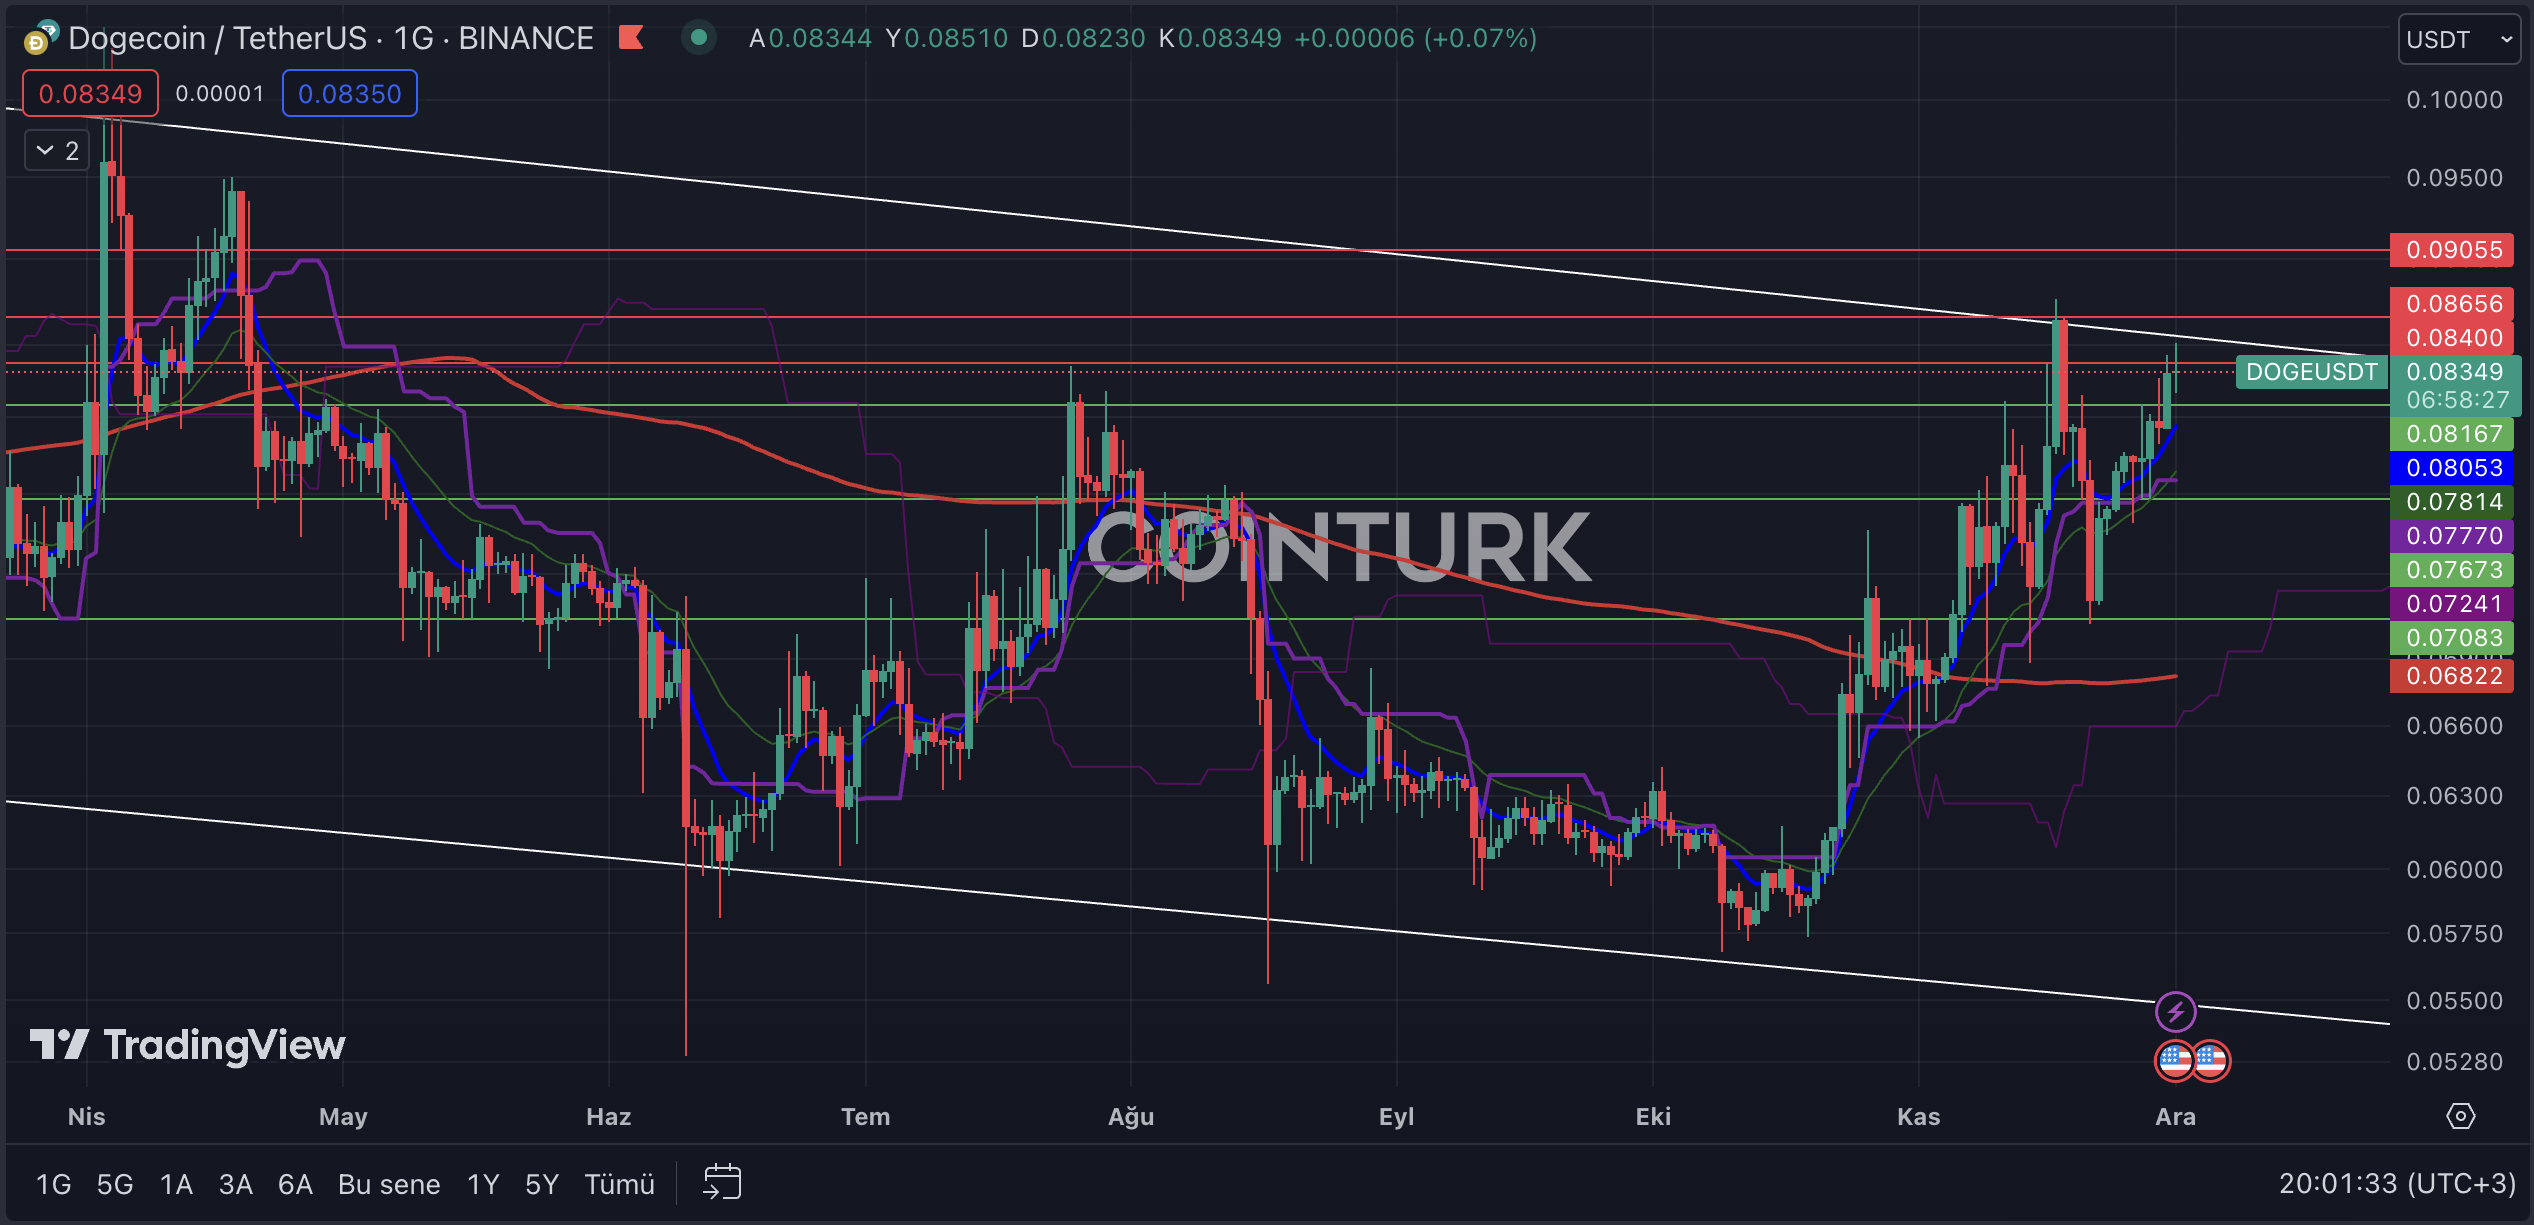
The first notable pattern in the daily DOGE chart is the descending channel formation. In this structure, following the contact of recent upward movements with the resistance line and witnessing significant corrections thereafter, selling pressure continues in the latest bar movements.
每日 DOGE 圖表中第一個值得注意的模式是下降通道形成。在這種結構中,在最近的向上運動與阻力線接觸並隨後出現重大修正之後,在最近的柱形運動中,賣壓仍在繼續。
The most important support levels to follow on the DOGE daily chart are; 0.08167, 0.07673, and 0.07083 dollars in order. A daily bar closing below these support levels and especially below the EMA 200 (red line) will cause DOGE’s price to experience significant selling pressure.
DOGE 日線圖上最重要的支撐位是:依序為 0.08167、0.07673 和 0.07083 美元。日線收盤價低於這些支撐位,特別是低於 EMA 200(紅線)將導致 DOGE 的價格承受巨大的拋售壓力。
The most important resistance levels to watch on the DOGE daily chart, in turn, are; 0.08400, 0.08656, and 0.09055 dollars. Particularly, a daily bar closing above the significant hurdle of 0.08656 dollars will initiate a momentum gain for DOGE’s price, following the formation breakout.
反過來,DOGE 日線圖上最重要的阻力位是: 0.08400、0.08656 和 0.09055 美元。特別是,日線收盤價高於 0.08656 美元的重要障礙將在形成突破後引發 DOGE 價格的動量上漲。

DOGE/ETH Chart Analysis
DOGE/ETH 圖表分析
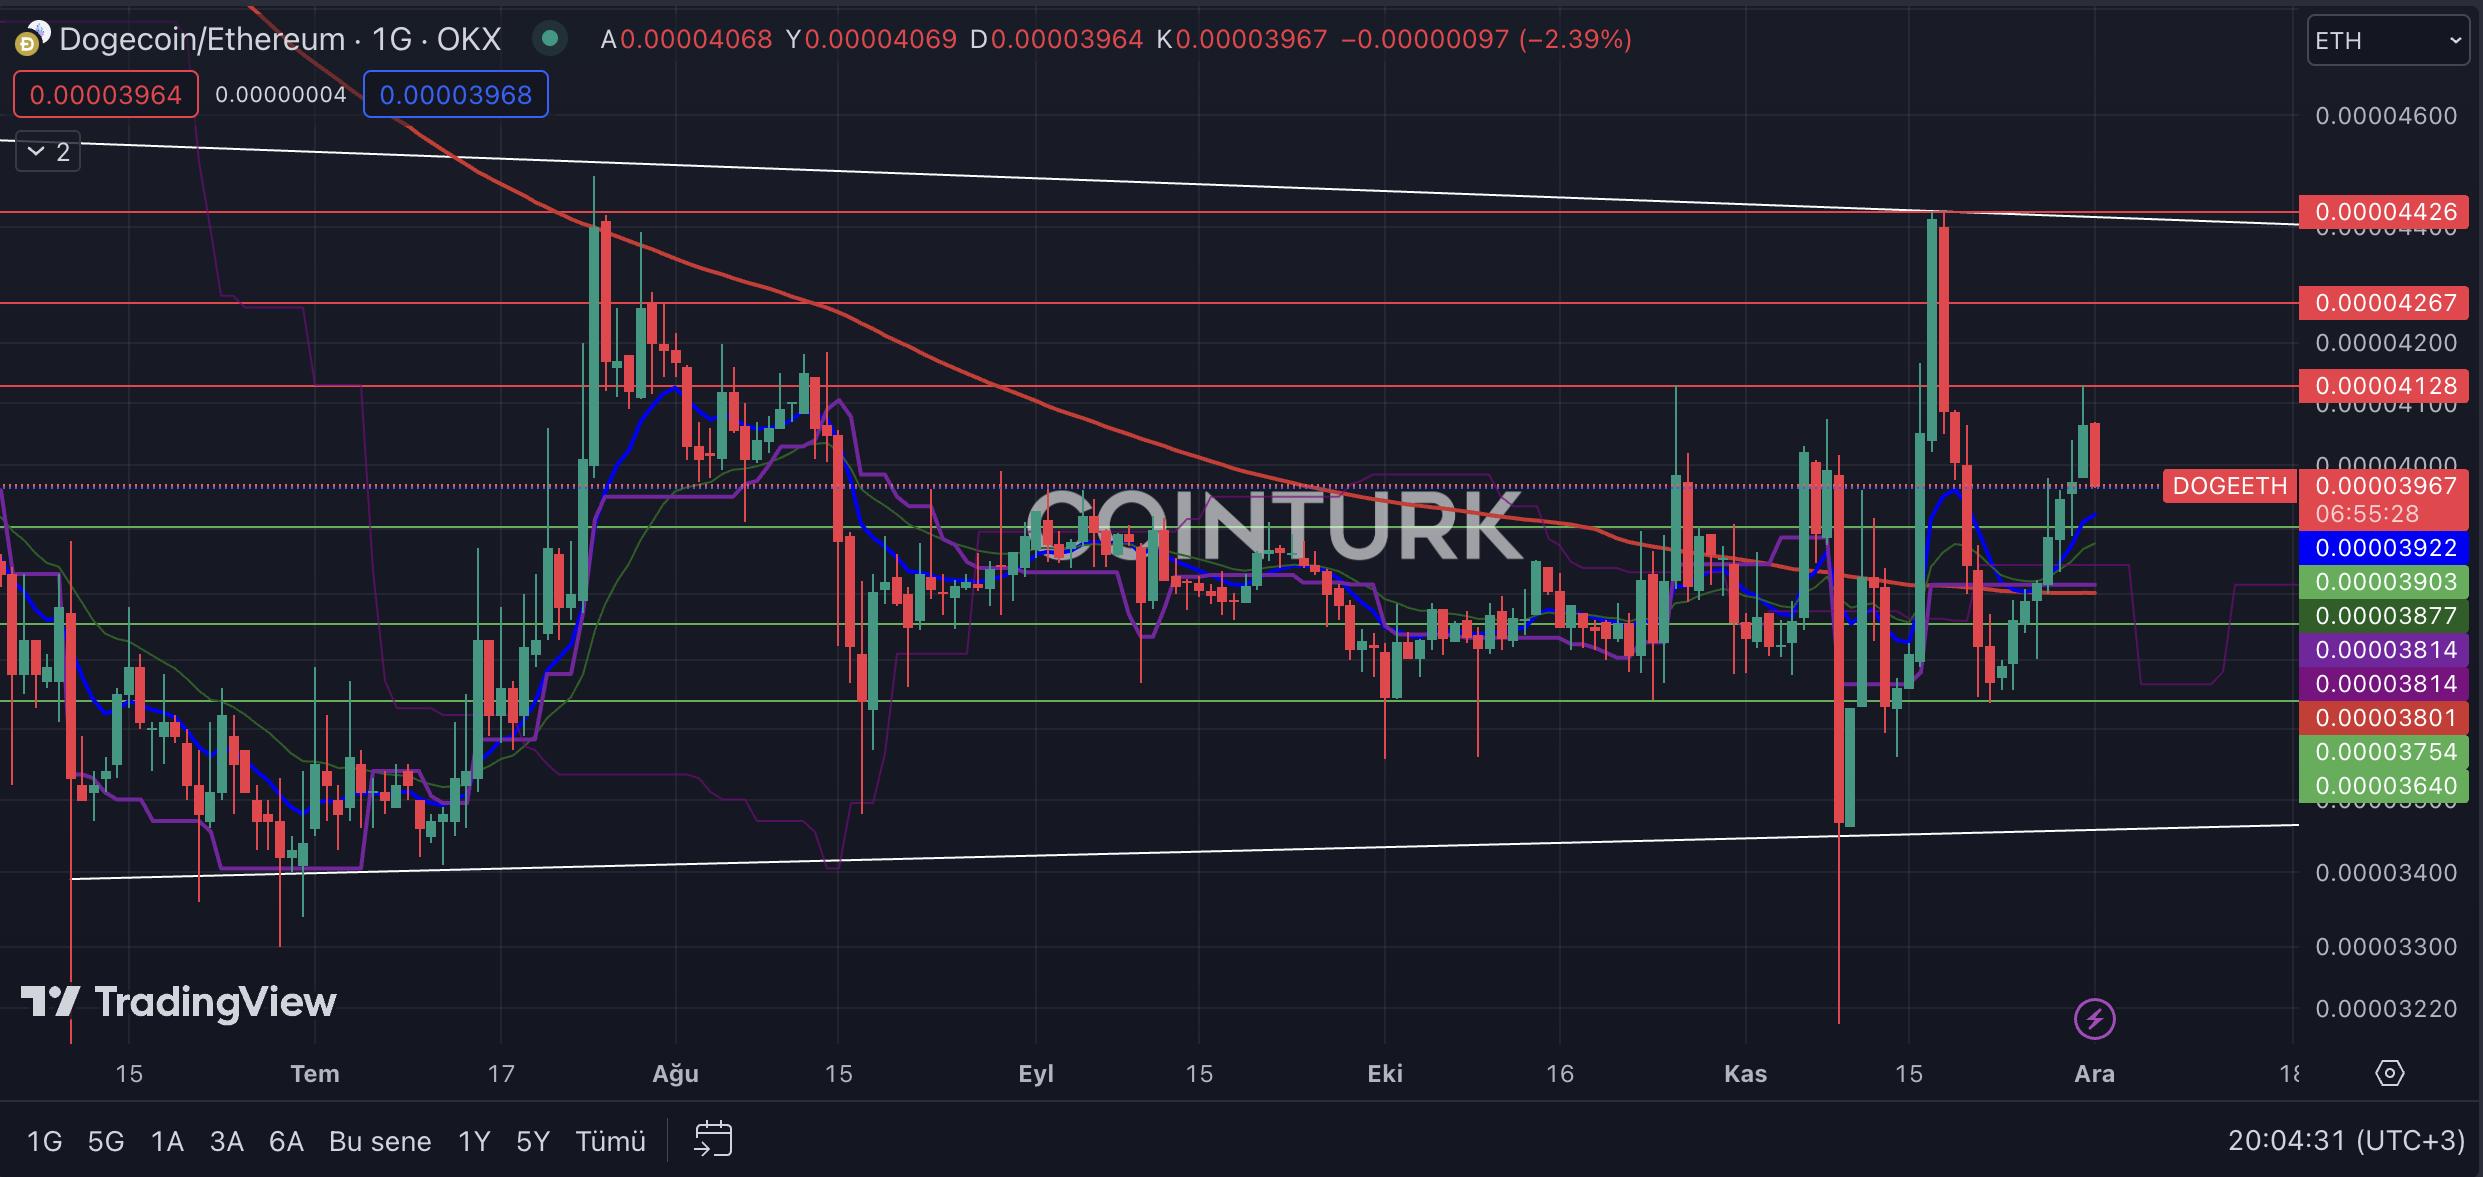
The first noticeable formation in the DOGE/ETH daily chart is the channel pattern. While the breakouts at the support level of this channel remain only as wicks, the bar closings continue to give hints about levels to watch. Particularly, the DOGE/ETH pair continues to gain value with the breaching of the EMA 200 level.
DOGE/ETH 日線圖中第一個值得注意的形態是通道形態。雖然該通道支撐位的突破僅保留為燈芯,但收盤價繼續暗示值得關注的水平。特別是,隨著突破 EMA 200 水平,DOGE/ETH 貨幣對繼續增值。
The most important support levels to monitor on the DOGE/ETH daily chart are; 0.00003903, 0.00003754, and 0.00003640, respectively. Especially, a bar closing below the critical support level of 0.00003640 will lead to DOGE’s depreciation against Ethereum.
DOGE/ETH 日線圖上需要監控的最重要的支撐位是:分別為 0.00003903、0.00003754 和 0.00003640。特別是,收盤價低於關鍵支撐位 0.00003640 將導致 DOGE 對以太坊貶值。
The most important resistance levels to consider on the DOGE/ETH daily chart, in turn, are; 0.00004128, 0.00004267, and 0.00004426. Specifically, a bar closing above the significant obstacle of 0.00004426 will result in DOGE’s appreciation against Ethereum.
DOGE/ETH 日線圖上需要考慮的最重要的阻力位子是: 0.00004128、0.00004267 和 0.00004426。具體來說,收盤價高於 0.00004426 的重大障礙將導致 DOGE 對以太坊升值。

- Technical analysis reveals key trends in DOGE.
- Support and resistance levels guide trading decisions.
- DOGE’s performance against Ethereum is analyzed.
技術分析揭示了 DOGE 的主要趨勢。
支撐位和阻力位指導交易決策。
分析了 DOGE 相對於以太坊的表現。
繼續閱讀:https://en.coin-turk.com/unveiling-dogecoins-market-position-a-technical-analysis-insight/


 CFN
CFN U_Today
 Thecoinrepublic.com
 DogeHome
 Optimisus
 Optimisus
 DeFi Planet
 Crypto Daily™
 BlockchainReporter


