In the cryptocurrency market, technical analysis is emerging as a crucial indicator, especially for investors trading in the futures market. So, what clues does technical analysis provide for Dogecoin, which is trading at 0.08349 dollars at the time the article is written? We examine this by analyzing detailed charts and important support and resistance levels.
暗号通貨市場では、特に先物市場で取引する投資家にとって、テクニカル分析が重要な指標として浮上しています。それでは、記事執筆時点で0.08349ドルで取引されているドージコインについて、テクニカル分析はどのような手がかりを提供するのでしょうか?詳細なチャートと重要なサポートとレジスタンスのレベルを分析することで、これを検証します。
Dogecoin Chart Analysis
ドージコインチャート分析
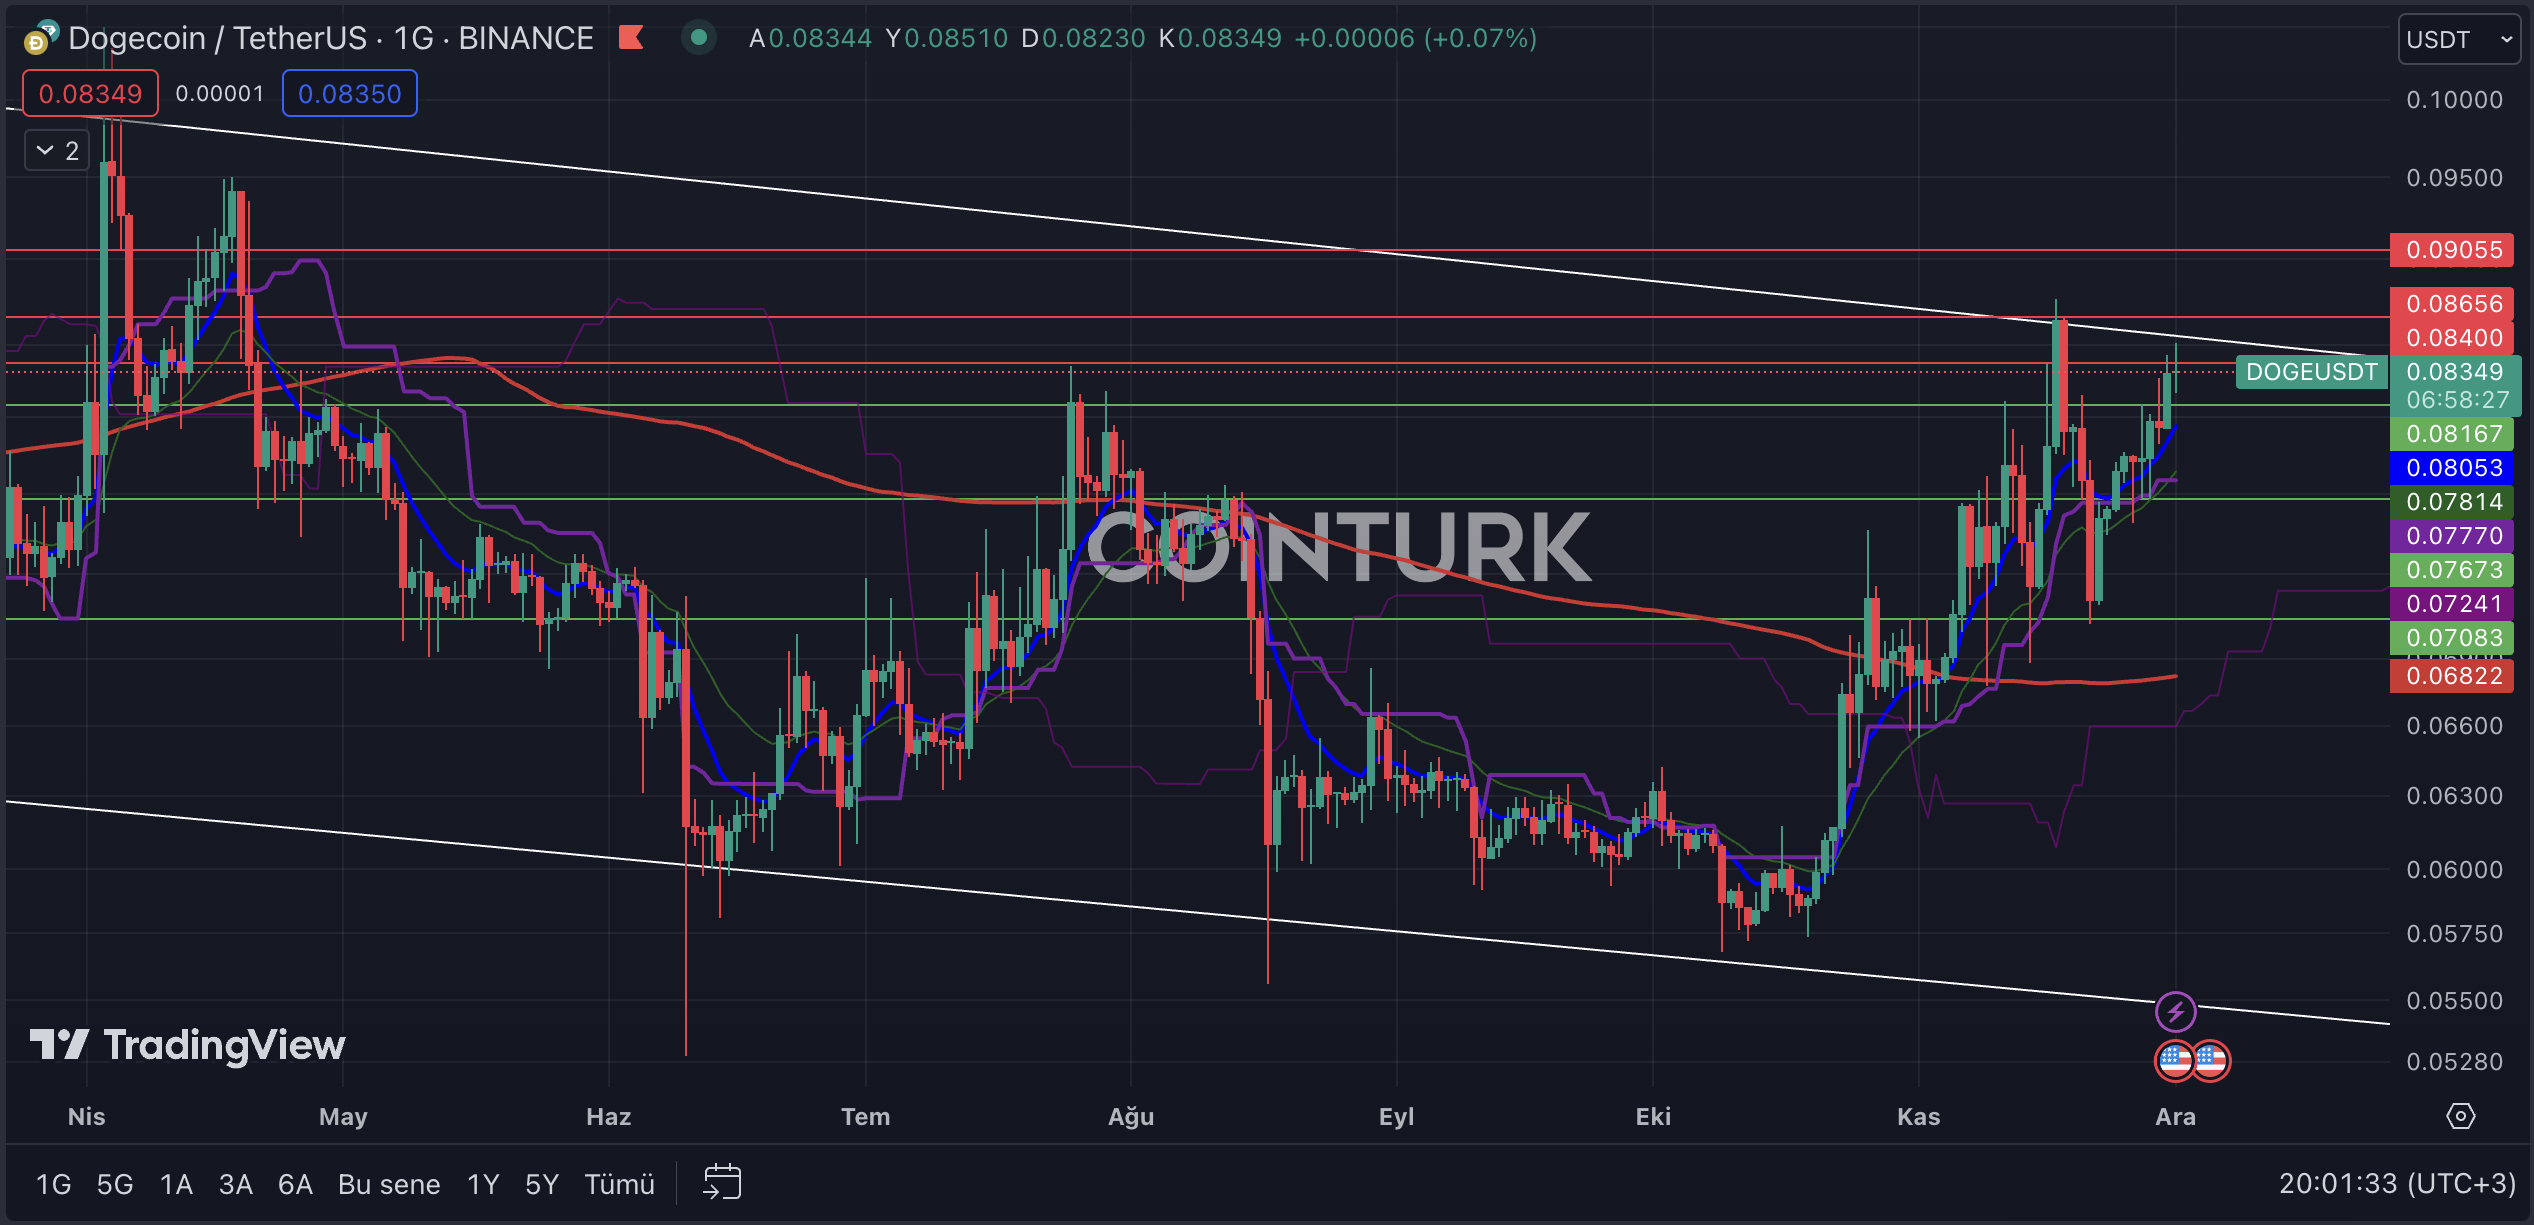
The first notable pattern in the daily DOGE chart is the descending channel formation. In this structure, following the contact of recent upward movements with the resistance line and witnessing significant corrections thereafter, selling pressure continues in the latest bar movements.
日足 DOGE チャートの最初の注目すべきパターンは、下降チャネル形成です。この構造では、最近の上向きの動きがレジスタンスラインと接触し、その後大幅な調整が見られた後、最新の足の動きで売り圧力が続きます。
The most important support levels to follow on the DOGE daily chart are; 0.08167, 0.07673, and 0.07083 dollars in order. A daily bar closing below these support levels and especially below the EMA 200 (red line) will cause DOGE’s price to experience significant selling pressure.
DOGE 日足チャートで従うべき最も重要なサポートレベルは次のとおりです。順に0.08167ドル、0.07673ドル、0.07083ドル。日足がこれらのサポートレベル、特にEMA 200(赤線)を下回って終了すると、DOGE価格に大きな売り圧力がかかることになります。
The most important resistance levels to watch on the DOGE daily chart, in turn, are; 0.08400, 0.08656, and 0.09055 dollars. Particularly, a daily bar closing above the significant hurdle of 0.08656 dollars will initiate a momentum gain for DOGE’s price, following the formation breakout.
DOGE 日足チャートで注目すべき最も重要な抵抗レベルは次のとおりです。 0.08400ドル、0.08656ドル、0.09055ドル。特に、日足が0.08656ドルという重要なハードルを上回って終了すると、フォーメーションブレイクアウトに続き、DOGE価格の勢い上昇が始まります。

DOGE/ETH Chart Analysis
DOGE/ETHチャート分析
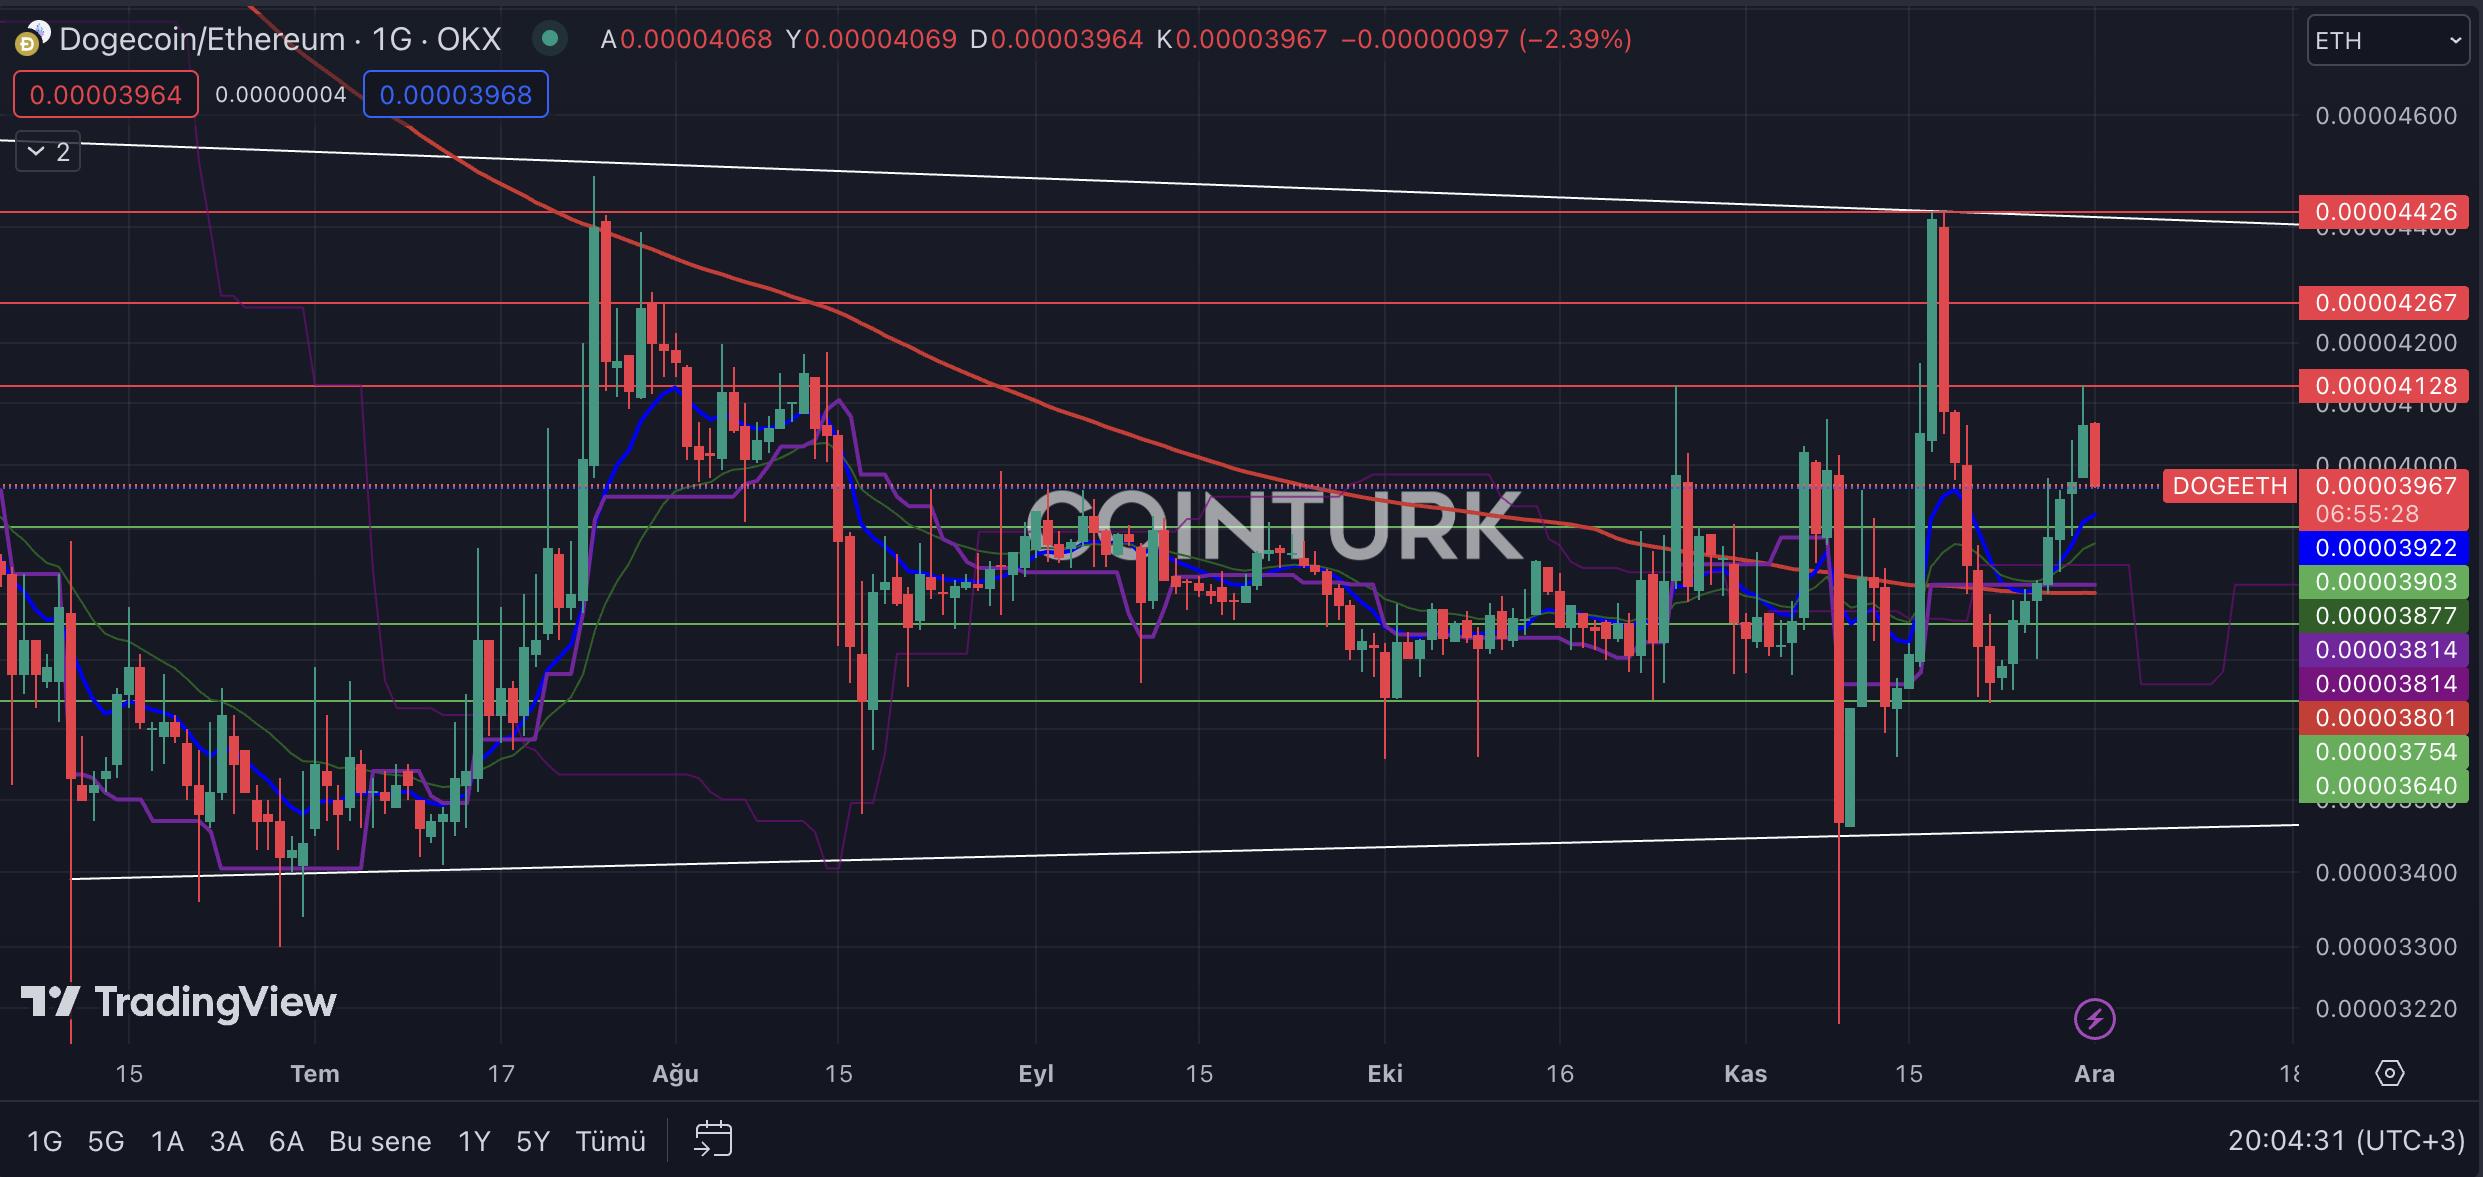
The first noticeable formation in the DOGE/ETH daily chart is the channel pattern. While the breakouts at the support level of this channel remain only as wicks, the bar closings continue to give hints about levels to watch. Particularly, the DOGE/ETH pair continues to gain value with the breaching of the EMA 200 level.
DOGE/ETH 日足チャートで最初に注目すべき形成はチャネル パターンです。このチャネルのサポートレベルでのブレイクアウトはまだ芯としてのみ残っていますが、バーの終値は注目すべきレベルについてのヒントを与え続けています。特に、DOGE/ETHペアはEMA 200レベルの突破により価値を高め続けています。
The most important support levels to monitor on the DOGE/ETH daily chart are; 0.00003903, 0.00003754, and 0.00003640, respectively. Especially, a bar closing below the critical support level of 0.00003640 will lead to DOGE’s depreciation against Ethereum.
DOGE/ETH 日次チャートで監視する最も重要なサポート レベルは次のとおりです。それぞれ0.00003903、0.00003754、0.00003640。特に、バーが重要なサポートレベルである0.00003640を下回って終了すると、イーサリアムに対するDOGEの下落につながります。
The most important resistance levels to consider on the DOGE/ETH daily chart, in turn, are; 0.00004128, 0.00004267, and 0.00004426. Specifically, a bar closing above the significant obstacle of 0.00004426 will result in DOGE’s appreciation against Ethereum.
DOGE/ETH 日足チャートで考慮すべき最も重要な抵抗レベルは次のとおりです。 0.00004128、0.00004267、0.00004426。具体的には、バーが 0.00004426 の重大な障害を上回って終了すると、DOGE はイーサリアムに対して上昇します。

- Technical analysis reveals key trends in DOGE.
- Support and resistance levels guide trading decisions.
- DOGE’s performance against Ethereum is analyzed.
テクニカル分析により、DOGE の主要な傾向が明らかになります。
サポートとレジスタンスのレベルは取引の決定に役立ちます。
イーサリアムに対するDOGEのパフォーマンスが分析されます。
続きを読む: https://en.coin-turk.com/unveiling-dogecoins-market-position-a-technical-analysis-insight/


 Cryptopolitan_News
 CryptoNewsLand
 DogeHome
 CryptoNewsLand
 crypto.ro English
 CoinoMedia
 TheCoinrise


