

In the most recent week, the cryptocurrency market has seen a mix of bullish and bearish trends, with most cryptocurrencies trading in neutral ranges. The weekly crypto price analysis reveals a market has been struggling to find direction, with most of the tokens seeing gains rather than losses. The market has been volatile, and buying and selling opportunities abound.
En la semana más reciente, el mercado de las criptomonedas ha visto una combinación de tendencias alcistas y bajistas, y la mayoría de las criptomonedas cotizan en rangos neutrales. El análisis semanal de precios de las criptomonedas revela que un mercado ha estado luchando por encontrar la dirección, y la mayoría de los tokens obtienen ganancias en lugar de pérdidas. El mercado ha sido volátil y abundan las oportunidades de compra y venta.
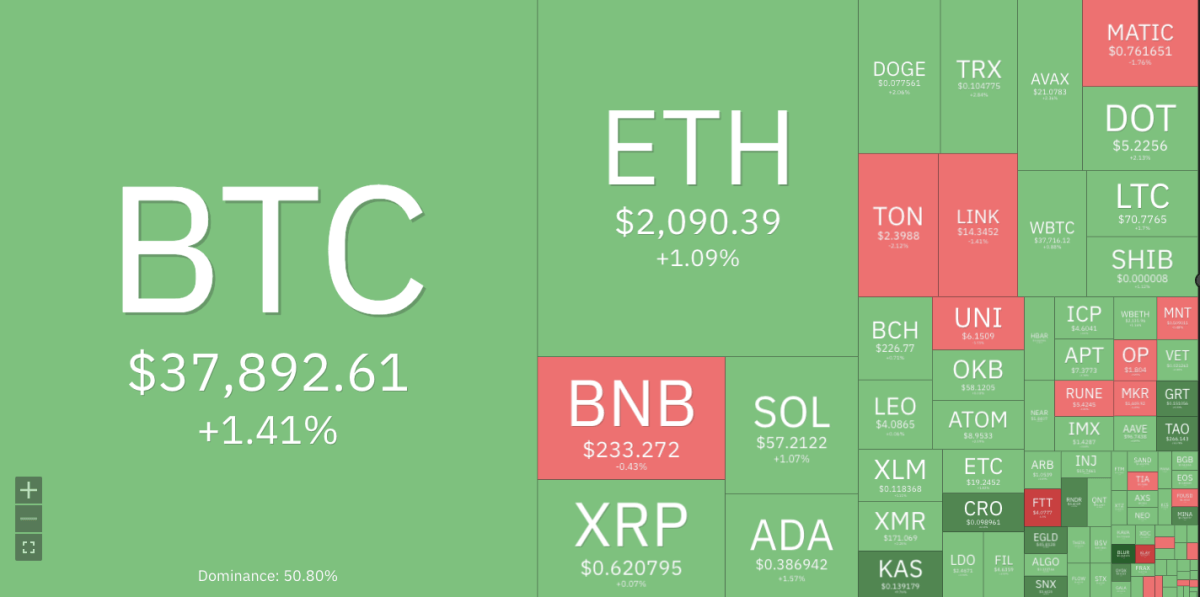
Cryptocurrencies Price Heatmap, Source: Coin360
Mapa de calor de precios de criptomonedas, fuente: Coin360
The leading cryptocurrency, Bitcoin (BTC), has managed to hold its position above $37k after a bullish outlook in the past week. The ETH price has also been showing bullish signs, with the token trading above $2k. Additionally, the XRP and ADA prices have gained momentum, with both tokens seeing a significant increase in value. However, not all cryptocurrencies have been on an upward trajectory. BNB’s price has been relatively stable after a bearish outlook, while Dogecoin (DOGE) and Solana (SOL) are experiencing a slight downward trend.
La criptomoneda líder, Bitcoin (BTC), ha logrado mantener su posición por encima de los 37.000 dólares después de una perspectiva alcista la semana pasada. El precio de ETH también ha mostrado signos alcistas, con el token cotizando por encima de los 2.000 dólares. Además, los precios de XRP y ADA han ganado impulso y ambos tokens han experimentado un aumento significativo de valor. Sin embargo, no todas las criptomonedas han seguido una trayectoria ascendente. El precio de BNB se ha mantenido relativamente estable después de una perspectiva bajista, mientras que Dogecoin (DOGE) y Solana (SOL) están experimentando una ligera tendencia a la baja.
BTC/USD
BTC/USD
BTC started the week on a positive note, with its price rising above $36K. The bullish trend continued throughout the week, and the token’s price reached $37k before showing signs of consolidation. The BTC dominance percentage has been around 50%, indicating a strong hold on the market.
BTC comenzó la semana con una nota positiva, con su precio subiendo por encima de los 36.000 dólares. La tendencia alcista continuó durante toda la semana y el precio del token alcanzó los 37.000 dólares antes de mostrar signos de consolidación. El porcentaje de dominio de BTC ha sido de alrededor del 50%, lo que indica un fuerte dominio en el mercado.
BTC/USD is currently trading at $37,892, with a 24-hour surge of 1.41% and a seven-day increase of 3.48%. If bullish momentum continues, BTC’s price will reach its next resistance level at $40k. However, if bears take control, BTC’s price could drop to its support level of $35k.
BTC/USD se cotiza actualmente a $37,892, con un aumento de 24 horas del 1,41% y un aumento de siete días del 3,48%. Si el impulso alcista continúa, el precio de BTC alcanzará su próximo nivel de resistencia en 40.000 dólares. Sin embargo, si los bajistas toman el control, el precio de BTC podría caer a su nivel de soporte de $35k.
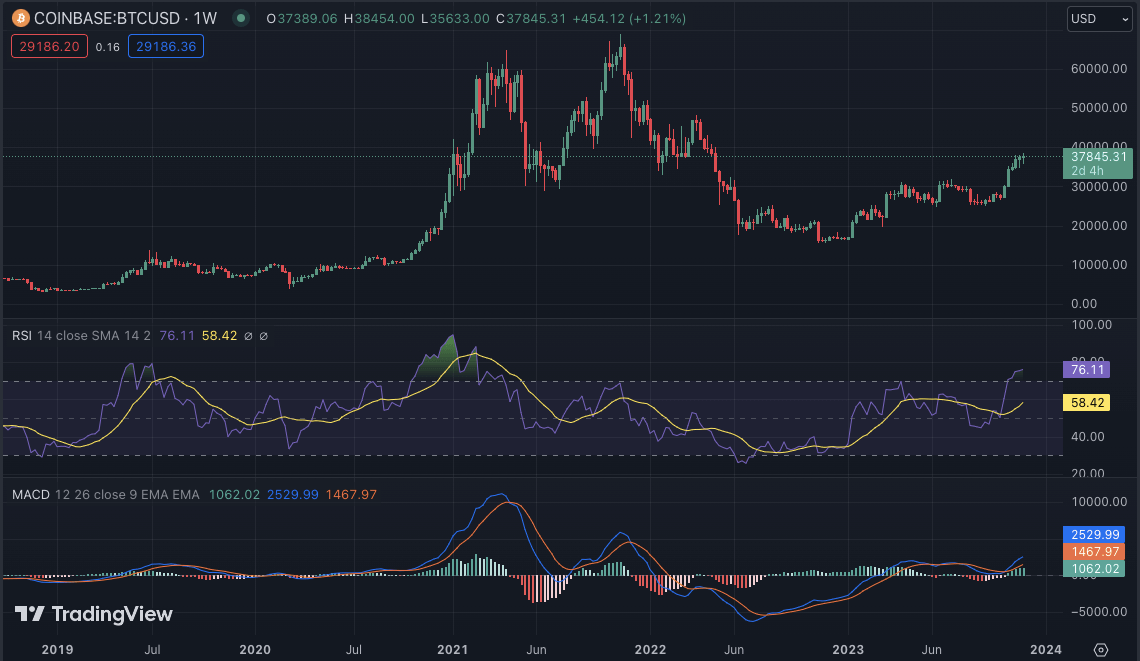
BTC/USD weekly chart, source: TradingView
Gráfico semanal BTC/USD, fuente: TradingView
The weekly technical indicators are indicating a possible bullish momentum for BTC. The MACD (Moving Average Convergence Divergence) histogram shows an upward trend, and the RSI (Relative Strength Index) is above 70, indicating a buying sentiment in the market. The 20-EMA and 50-EMA also show bullish crossovers, confirming a positive BTC outlook.
Los indicadores técnicos semanales indican un posible impulso alcista para BTC. El histograma MACD (promedio móvil de convergencia y divergencia) muestra una tendencia ascendente y el RSI (índice de fuerza relativa) está por encima de 70, lo que indica un sentimiento de compra en el mercado. 20-EMA y 50-EMA también muestran cruces alcistas, lo que confirma una perspectiva positiva para BTC.
ETH/USD
ETH/USD
ETH has been showing a bullish outlook, with its price breaking above the $2k mark multiple times in the past week. The token reached a weekly high of $2,123 but was met with resistance and consolidated around the $2,1k level. ETH token has been hovering between $2k and 2,1k, with bullish and bearish forces struggling for control. At the time of writing, ETH is trading at $2,090, with a seven-day strong surge of 7%.
ETH ha estado mostrando una perspectiva alcista, y su precio superó la marca de los 2.000 dólares varias veces durante la última semana. El token alcanzó un máximo semanal de 2.123 dólares, pero encontró resistencia y se consolidó alrededor del nivel de 2.100 dólares. El token ETH ha estado oscilando entre 2.000 y 2.100 dólares, con fuerzas alcistas y bajistas luchando por el control. En el momento de escribir este artículo, ETH se cotiza a 2.090 dólares, con un fuerte aumento del 7% en siete días.
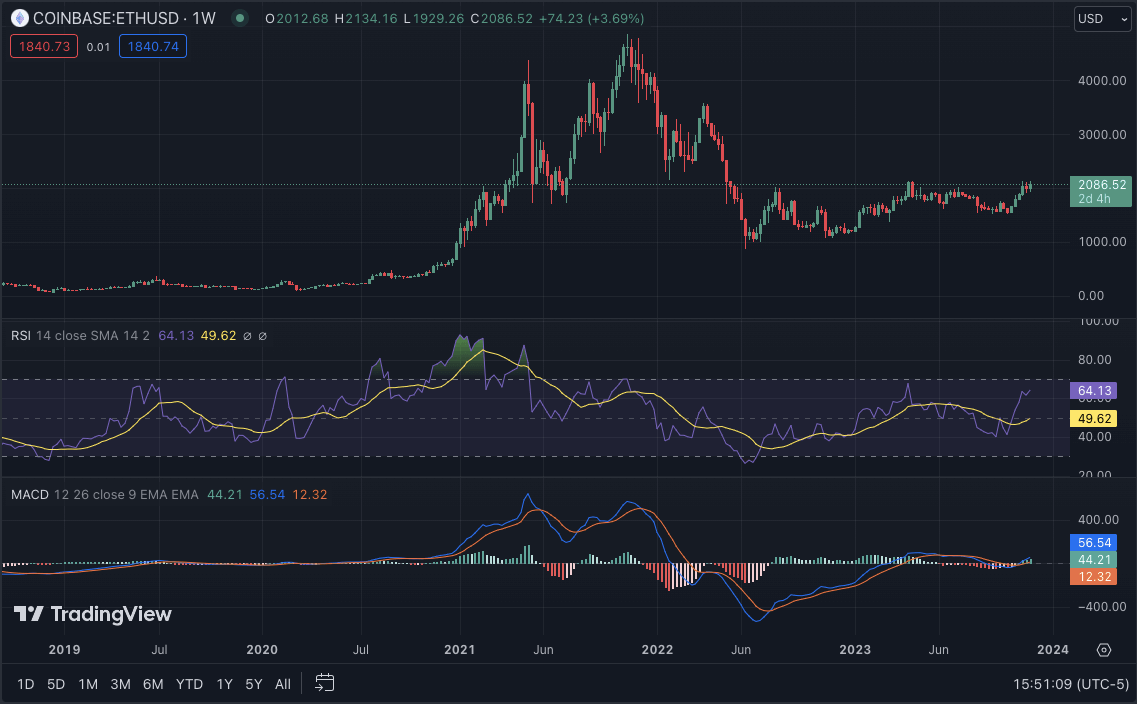
ETH/USD weekly chart, source: TradingView
Gráfico semanal de ETH/USD, fuente: TradingView
ETH/USD has strong support at $2k, with a resistance level of $2.1k. If bulls dominate the market, ETH’s price could break above its current resistance and reach $2,200. On the other hand, if bears take over, ETH’s price could drop to its support level of $1,900.
ETH/USD tiene un fuerte soporte en 2.000 dólares, con un nivel de resistencia de 2.100 dólares. Si los alcistas dominan el mercado, el precio de ETH podría superar su resistencia actual y alcanzar los 2200 dólares. Por otro lado, si los bajistas toman el control, el precio de ETH podría caer a su nivel de soporte de $1,900.
The 50-SMA and 200-SMA on the weekly chart show a potential bullish crossover, indicating a positive outlook for ETH. The moving average convergence/divergence (MACD) also shows a bullish trend, while the relative strength index (RSI) is above 60, indicating strong buying pressure in the market. The moving averages are indicating buy signals, supporting the overall bullish sentiment.
Las SMA 50 y SMA 200 en el gráfico semanal muestran un posible cruce alcista, lo que indica una perspectiva positiva para ETH. La media móvil de convergencia/divergencia (MACD) también muestra una tendencia alcista, mientras que el índice de fuerza relativa (RSI) está por encima de 60, lo que indica una fuerte presión de compra en el mercado. Los promedios móviles indican señales de compra, lo que respalda el sentimiento alcista general.
BNB/USD
BNB/USD
BNB has been trading in a tight range, with its price hovering between $300 and $320. The token saw a slight downward trend in the past week, reaching a low of $286 before bouncing back to its current price of $230 levels. The bulls and bears have been struggling for control, resulting in a relatively stable market for BNB. Currently, BNB is trading at $233, with a weekly dip of 4.46%.
BNB ha estado cotizando en un rango estrecho, con su precio oscilando entre 300 y 320 dólares. El token experimentó una ligera tendencia a la baja la semana pasada, alcanzando un mínimo de 286 dólares antes de recuperarse a su precio actual de 230 dólares. Los alcistas y bajistas han estado luchando por el control, lo que ha resultado en un mercado relativamente estable para BNB. Actualmente, BNB cotiza a 233 dólares, con una caída semanal del 4,46%.
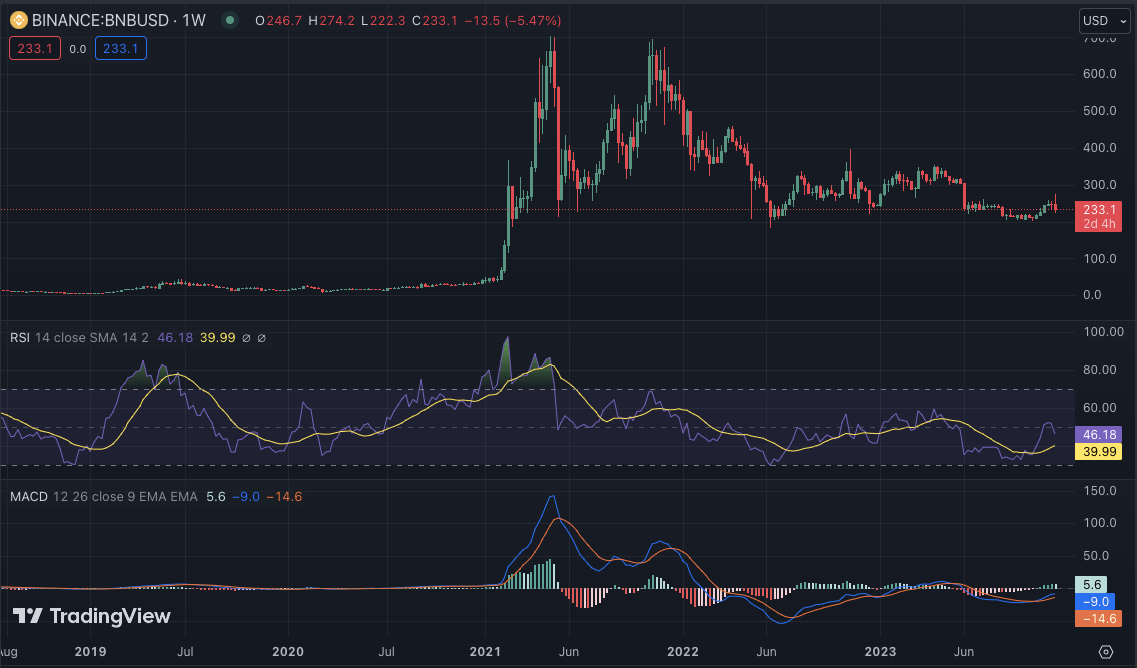
BNB/USD weekly chart, source: TradingView
Gráfico semanal BNB/USD, fuente: TradingView
The technical indicators for BNB show a potential bearish trend in the near future. The RSI is currently below 50, indicating a selling sentiment and the MACD histogram shows signs of a bearish crossover. The MACD line is also below the signal line, confirming a negative outlook for BNB. The 100-SMA and 200-SMA also show a bearish crossover, indicating a possible further downward trend for BNB.
Los indicadores técnicos de BNB muestran una posible tendencia bajista en el futuro próximo. El RSI se encuentra actualmente por debajo de 50, lo que indica un sentimiento de venta y el histograma MACD muestra signos de un cruce bajista. La línea MACD también está por debajo de la línea de señal, lo que confirma una perspectiva negativa para BNB. El 100-SMA y el 200-SMA también muestran un cruce bajista, lo que indica una posible nueva tendencia a la baja para BNB.
XRP/USD
XRP/USD
XRP saw a significant surge in its price this week, reaching a weekly high of $0.628 before consolidating around the $0.61 level. The token’s bullish momentum has been driven by positive market sentiment and recent partnerships. XRP token has been rallying above its previous resistance level of $0.60, indicating a strong surge in value. XRP is currently trading at $0.6270 level, with a weekly increase of 2%.
XRP experimentó un aumento significativo en su precio esta semana, alcanzando un máximo semanal de 0,628 dólares antes de consolidarse alrededor del nivel de 0,61 dólares. El impulso alcista del token se ha visto impulsado por el sentimiento positivo del mercado y las asociaciones recientes. El token XRP ha estado subiendo por encima de su nivel de resistencia anterior de $0,60, lo que indica un fuerte aumento en el valor. XRP se cotiza actualmente al nivel de $0,6270, con un aumento semanal del 2%.
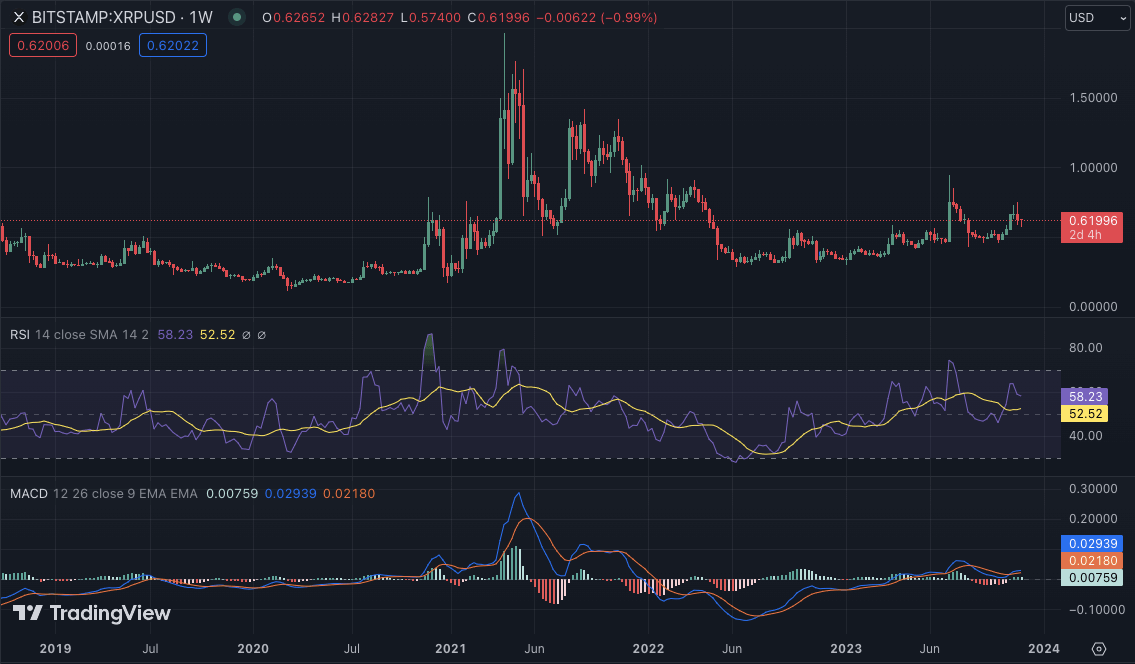
XRP/USD weekly chart, source: TradingView
Gráfico semanal de XRP/USD, fuente: TradingView
XRP/USD has strong support at $0.58, with its next resistance level at $0.6300. If bulls continue to dominate the market, XRP’s price could reach its next resistance level at $0.6500. However, if bears take control, XRP’s price could drop to its support level of $0.58.
XRP/USD tiene un fuerte soporte en $0,58, con su siguiente nivel de resistencia en $0,6300. Si los alcistas continúan dominando el mercado, el precio de XRP podría alcanzar su próximo nivel de resistencia en 0,6500 dólares. Sin embargo, si los bajistas toman el control, el precio de XRP podría caer a su nivel de soporte de 0,58 dólares.
The technical indicators for XRP show a potential bullish trend in the near future. The RSI is currently above 50, indicating bulls are more dominant in the market. The MACD histogram also shows a bullish trend and the 50-SMA and 100-SMA show signs of a potential bullish crossover.
Los indicadores técnicos de XRP muestran una posible tendencia alcista en el futuro próximo. El RSI está actualmente por encima de 50, lo que indica que los alcistas son más dominantes en el mercado. El histograma MACD también muestra una tendencia alcista y el 50-SMA y el 100-SMA muestran signos de un posible cruce alcista.
SOL/USD
SOL/USD
Weekly crypto price analysis also reveals that Solana (SOL) has been trading in a downward trend. The token saw a significant drop in its price from $62 to $57 before bouncing back to its current level of $57.10. SOL’s bearish movement is attributed to overall market sentiment and profit-taking by investors. SOL has seen a weekly dip of 1.8%, with its value fluctuating within a tight range.
El análisis semanal de precios de criptomonedas también revela que Solana (SOL) ha estado cotizando en una tendencia a la baja. El token experimentó una caída significativa en su precio de 62 dólares a 57 dólares antes de recuperarse a su nivel actual de 57,10 dólares. El movimiento bajista de SOL se atribuye al sentimiento general del mercado y a la toma de ganancias por parte de los inversores. SOL ha experimentado una caída semanal del 1,8%, y su valor fluctúa dentro de un rango estrecho.
SOL/USD has a strong support level of $30 and a resistance level of $35. If bulls take control, SOL’s price could reach its next resistance level at $40. However, if bears continue to dominate, SOL’s price could drop to its support level of $25. However, today, it saw a surge of 1.24%, giving hope to the bullish investors.
SOL/USD tiene un fuerte nivel de soporte de $30 y un nivel de resistencia de $35. Si los alcistas toman el control, el precio de SOL podría alcanzar su siguiente nivel de resistencia en 40 dólares. Sin embargo, si los bajistas continúan dominando, el precio de SOL podría caer a su nivel de soporte de 25 dólares. Sin embargo, hoy experimentó un aumento del 1,24%, lo que dio esperanza a los inversores alcistas.
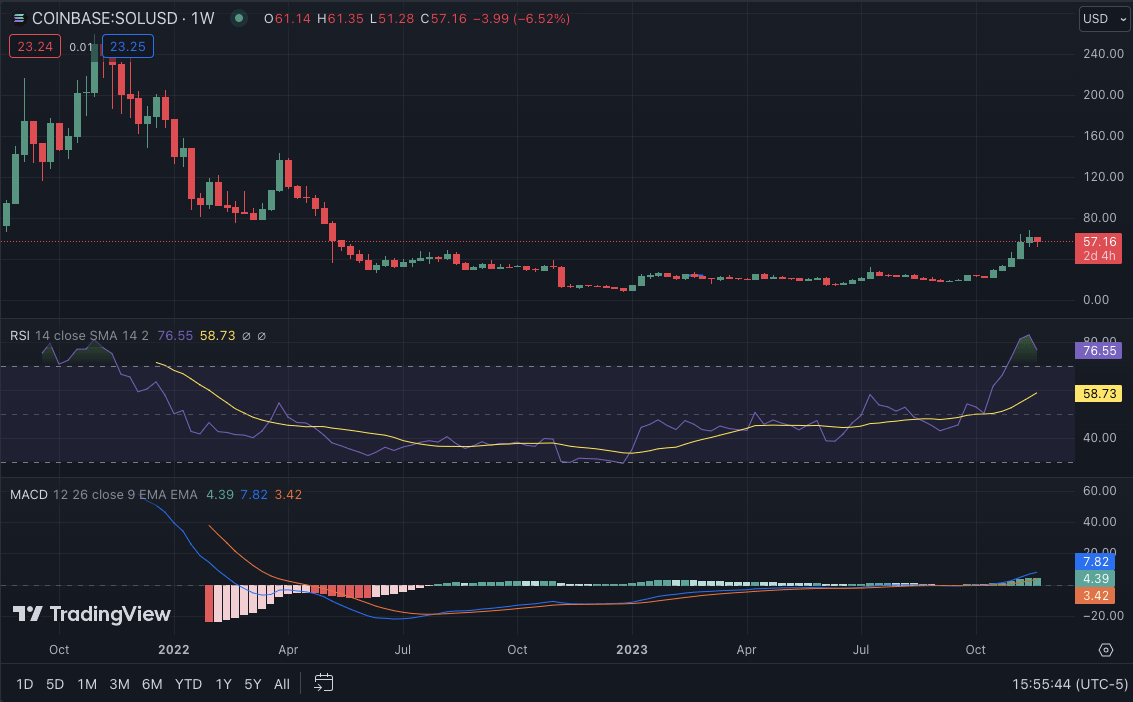
SOL/USD weekly chart, source: TradingView
Gráfico semanal SOL/USD, fuente: TradingView
The technical indicators for SOL show mixed signals, with the RSI below 80 but showing signs of an upward trend. The MACD histogram shows a possible bullish crossover, while the moving averages indicate a buy signal. Overall, SOL’s price movement will depend on market sentiment and the direction of major cryptocurrencies. The 20-EMA and 50-EMA show bullish crossovers, indicating a possible upward movement for SOL in the near future.
Los indicadores técnicos de SOL muestran señales mixtas, con el RSI por debajo de 80 pero mostrando signos de una tendencia alcista. El histograma MACD muestra un posible cruce alcista, mientras que las medias móviles indican una señal de compra. En general, el movimiento del precio de SOL dependerá del sentimiento del mercado y de la dirección de las principales criptomonedas. Los EMA 20 y EMA 50 muestran cruces alcistas, lo que indica un posible movimiento ascendente para SOL en el futuro cercano.
ADA/USD
ADA/USD
Looking at the DOGE weekly price analysis, bulls and bears have been fighting for control, resulting in a relatively stable market for ADA. The bulls seem to be winning the battle, with ADA’s price surging by more than 6% in the past week. The token currently trades at $0.3862, with a 24-hour increase of 1.82%. The trading volume for ADA has also increased, indicating a possible surge in value in the coming days.
Al observar el análisis de precios semanal de DOGE, los alcistas y bajistas han estado luchando por el control, lo que ha resultado en un mercado relativamente estable para ADA. Los alcistas parecen estar ganando la batalla, con el precio de ADA subiendo más del 6% la semana pasada. El token se cotiza actualmente a 0,3862 dólares, con un aumento del 1,82% en 24 horas. El volumen de operaciones de ADA también ha aumentado, lo que indica un posible aumento de valor en los próximos días.
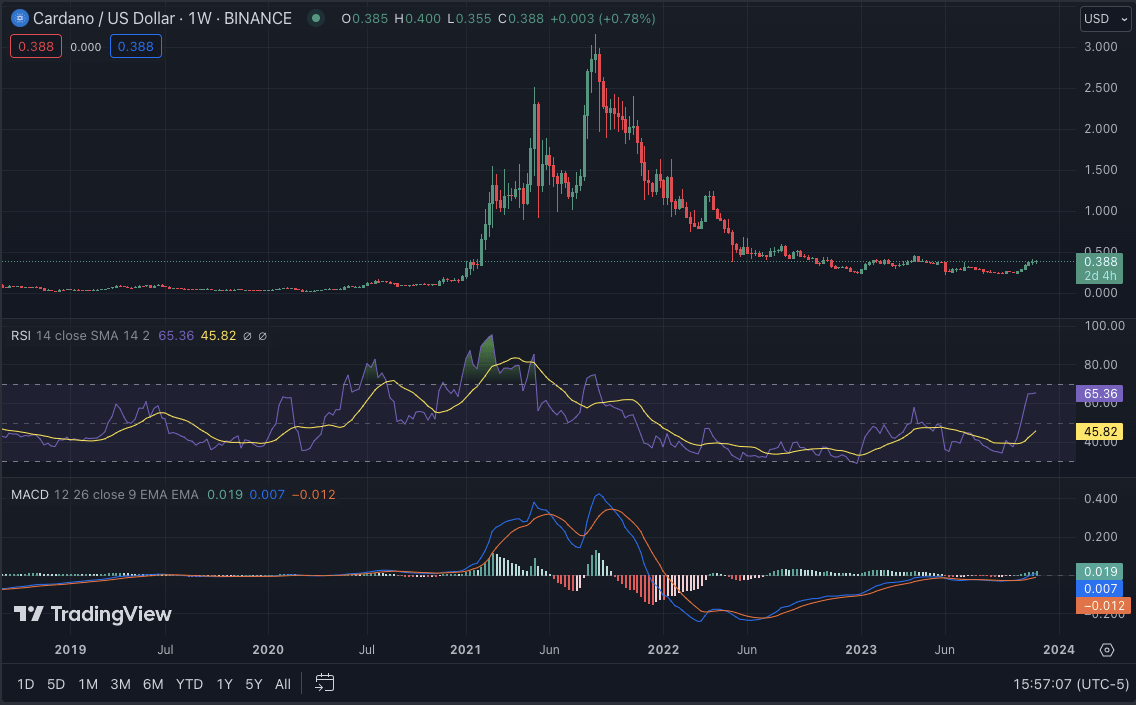
ADA/USD weekly chart, source: TradingView
Gráfico semanal ADA/USD, fuente: TradingView
The technical indicators for ADA show a potential bullish trend in the near future. The RSI is currently above 60, indicating strong buying pressure from investors. The MACD histogram also shows signs of a bullish trend, while the moving averages indicate buy signals. If bulls continue to dominate, ADA could reach its next resistance level at $0.4000. On the other hand, if bears take over, ADA’s price could drop to its support level of $0.03500.
Los indicadores técnicos de ADA muestran una posible tendencia alcista en el futuro próximo. El RSI se encuentra actualmente por encima de 60, lo que indica una fuerte presión de compra por parte de los inversores. El histograma MACD también muestra signos de una tendencia alcista, mientras que los promedios móviles indican señales de compra. Si los alcistas continúan dominando, ADA podría alcanzar su próximo nivel de resistencia en $0,4000. Por otro lado, si los bajistas toman el control, el precio de ADA podría caer a su nivel de soporte de $0,03500.
DOGE/USD
DOGE/USD
DOGE has been trading sideways for most of the week, fluctuating prices between $0.0700 and $0.08000. However, towards the end of the week, DOGE saw a slight dip in its price, reaching $0.19 before recovering to its current trading price of $0.07155. Over the past seven days, DOGE has seen a 7% decrease in value. At the time of writing, DOGE/USD is trading at $0.07735, with a slight increase of 1.90% in the past 24 hours.
DOGE ha estado cotizando lateralmente durante la mayor parte de la semana, fluctuando los precios entre $0,0700 y $0,08000. Sin embargo, hacia el final de la semana, DOGE experimentó una ligera caída en su precio, alcanzando los 0,19 dólares antes de recuperarse a su precio de negociación actual de 0,07155 dólares. En los últimos siete días, DOGE ha experimentado una disminución del 7% en su valor. En el momento de escribir este artículo, DOGE/USD se cotiza a 0,07735 dólares, con un ligero aumento del 1,90% en las últimas 24 horas.
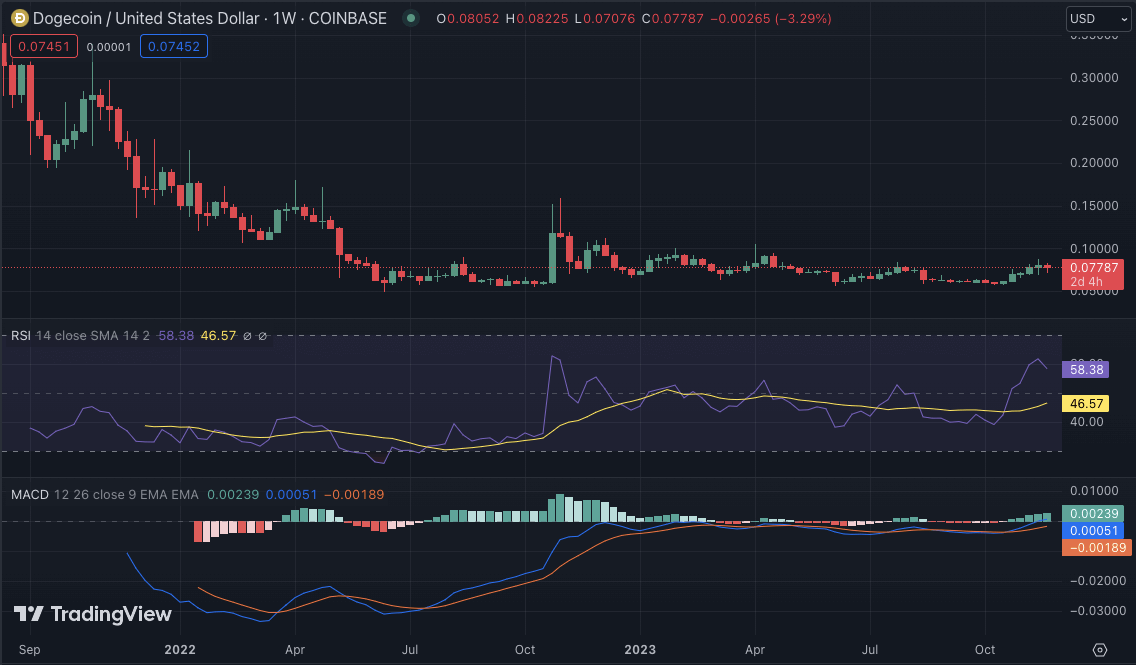
DOGE/USD weekly chart, Source: TradingView
Gráfico semanal DOGE/USD, Fuente: TradingView
The technical indicators for DOGE show a possible continuation of the bearish trend in the coming days. The RSI is currently below 60, indicating neutral sentiment in the market, and if it continues to drop, it could indicate a further downward trend for DOGE. The MACD also shows signs of a bearish crossover, and the 50-SMA is below the 200-SMA, confirming a negative outlook for DOGE.
Los indicadores técnicos de DOGE muestran una posible continuación de la tendencia bajista en los próximos días. El RSI se encuentra actualmente por debajo de 60, lo que indica un sentimiento neutral en el mercado, y si continúa cayendo, podría indicar una nueva tendencia a la baja para DOGE. El MACD también muestra signos de un cruce bajista y el 50-SMA está por debajo del 200-SMA, lo que confirma una perspectiva negativa para DOGE.
Conclusion
Conclusión
In conclusion, the weekly crypto price analysis shows a mixed sentiment in the market for major cryptocurrencies. The bulls and bears struggle for control, resulting in a relatively stable market. However, technical indicators show potential bullish or bearish trends for each token, depending on market sentiment and the direction of major cryptocurrencies such as Bitcoin and Ethereum. In the coming week, it will be interesting to see if the bulls or bears gain dominance and how it will affect the price movements of these cryptocurrencies.
En conclusión, el análisis semanal de precios de las criptomonedas muestra un sentimiento mixto en el mercado de las principales criptomonedas. Los alcistas y bajistas luchan por el control, lo que da como resultado un mercado relativamente estable. Sin embargo, los indicadores técnicos muestran posibles tendencias alcistas o bajistas para cada token, dependiendo del sentimiento del mercado y la dirección de las principales criptomonedas como Bitcoin y Ethereum. En la próxima semana, será interesante ver si los alcistas o los bajistas ganan dominio y cómo afectará eso a los movimientos de precios de estas criptomonedas.
 Crypto Intelligence
 DogeHome
 Crypto News Land
 Crypto Daily™
 Crypto Intelligence
 Crypto Daily™
 CaptainAltcoin
 Thecryptoupdates
 Crypto Intelligence


