

Ethereum's price today is showcasing a bullish surge that is drawing attention across the crypto community. Ethereum is a bellwether for the altcoin market, and today's price action suggests that investors are increasingly confident in the asset's value proposition.
今日のイーサリアムの価格は強気の急騰を示しており、暗号通貨コミュニティ全体で注目を集めています。イーサリアムはアルトコイン市場の先導者であり、今日の値動きは、投資家がこの資産の価値提案にますます自信を持っていることを示唆しています。
The technical chart for Ethereum indicates a strong push toward a key resistance level. After a period of consolidation, the price has broken out, suggesting a potential shift from a bearish to a bullish trend at around $2,100. This move aligns with a broader market recovery.
イーサリアムのテクニカルチャートは、主要な抵抗レベルに向けて力強い押し上げを示しています。値固め期間の後、価格は上抜け、2,100ドル付近で弱気トレンドから強気トレンドに移行する可能性を示唆しています。この動きは、より広範な市場の回復と一致しています。
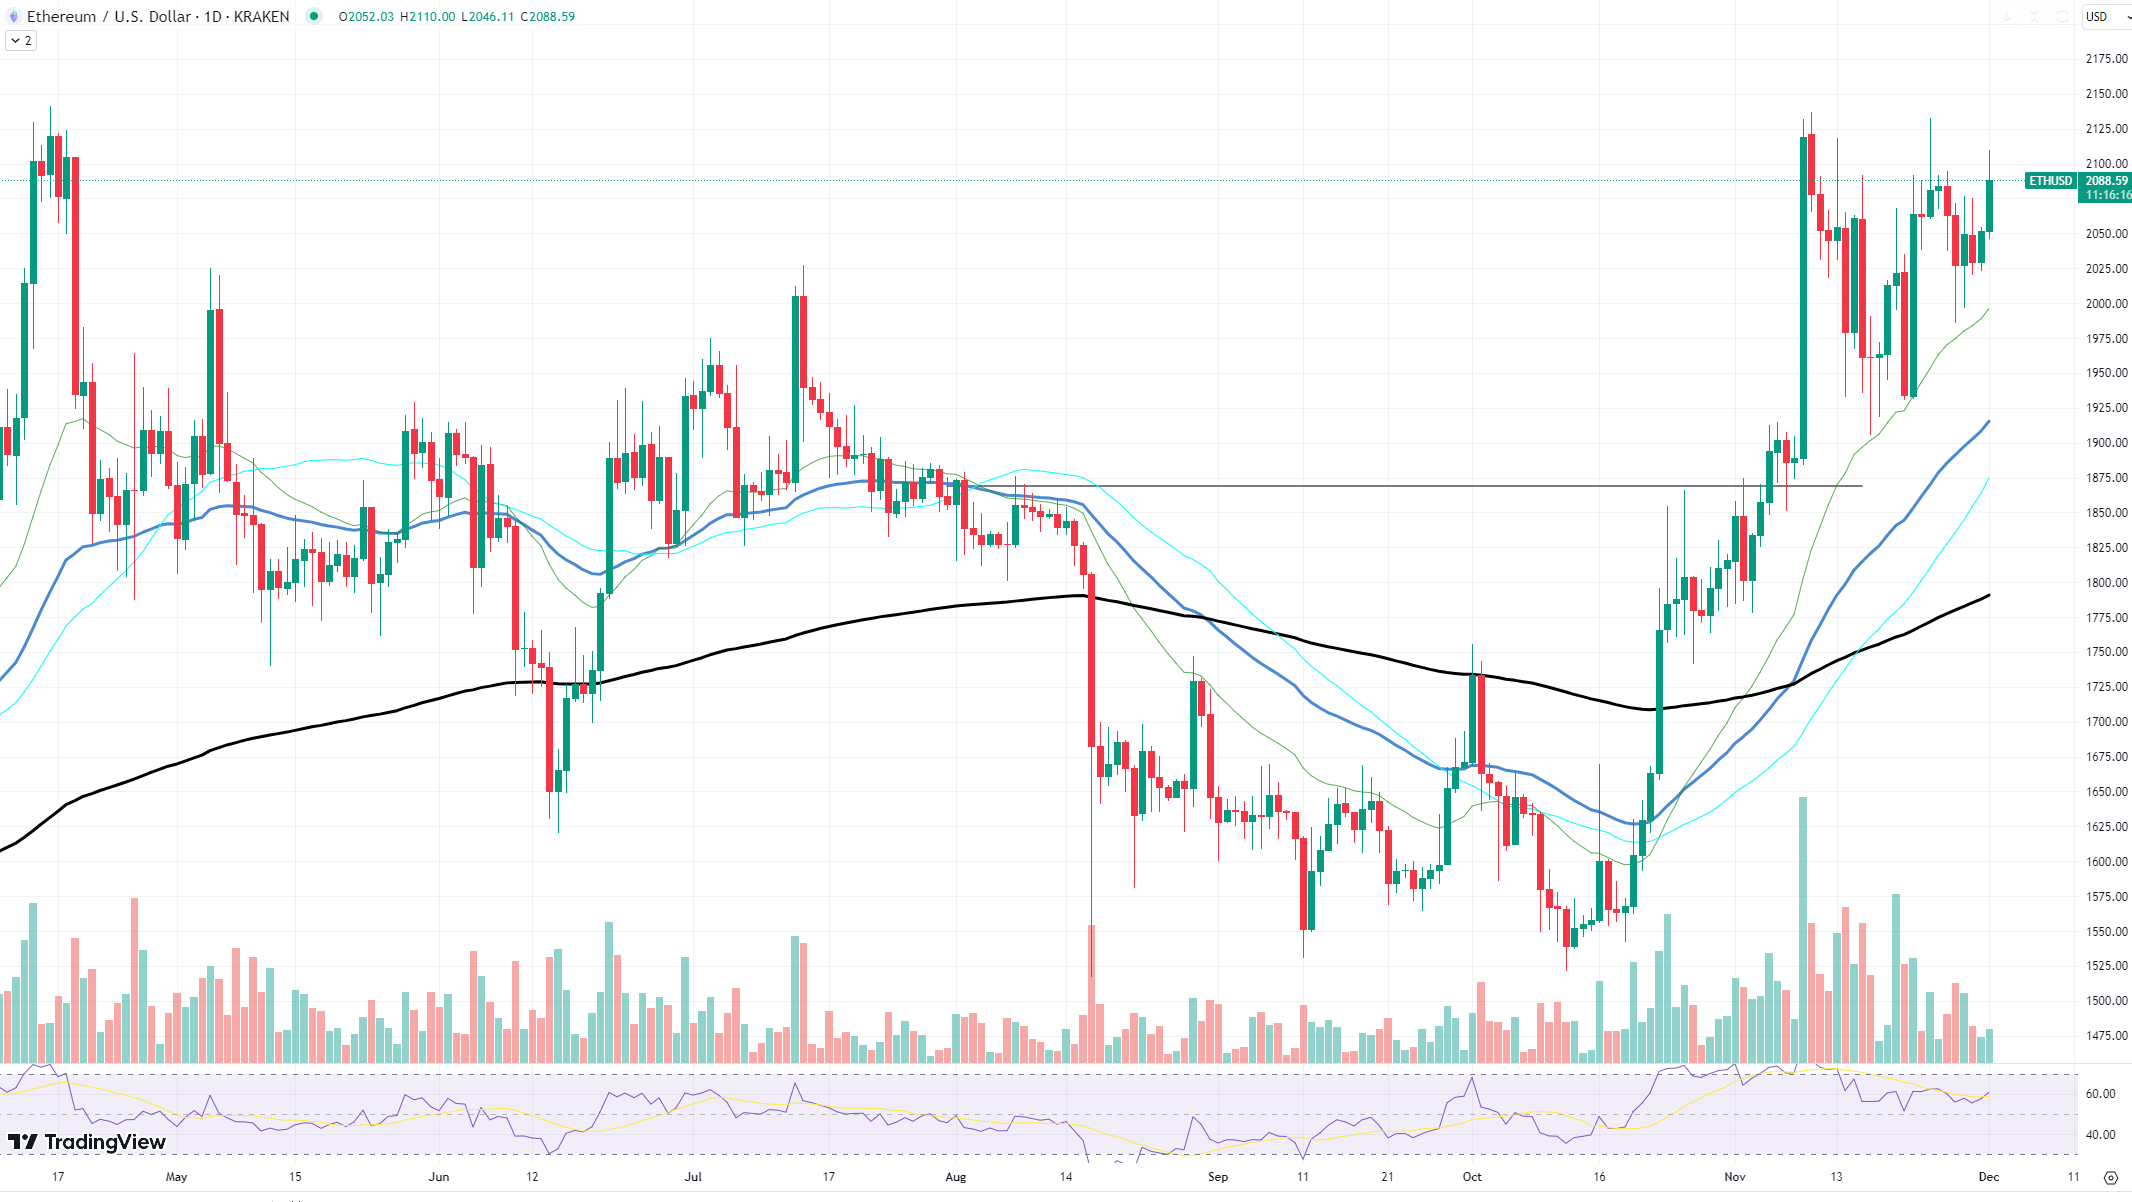 ETH/USD Chart by TradingView
TradingViewによるETH/USDチャート
Analyzing the chart, Ethereum has been tracing an ascending trajectory, supported by a rising trendline that underscores a series of higher lows – a classic indicator of bullish sentiment. The 50-day moving average, which is often looked upon for trend confirmation, is positioned below the current price, serving as a dynamic support level. The price is pushing toward the $2,100 level, which has historically acted as a significant resistance zone.
チャートを分析すると、イーサリアムは上昇軌道をたどっており、強気センチメントの古典的な指標である一連の安値を強調する上昇トレンドラインに支えられています。トレンドを確認するためによく注目される50日移動平均は、現在の価格よりも下に位置しており、動的なサポートレベルとして機能します。価格は歴史的に重要な抵抗ゾーンとして機能してきた2,100ドルの水準に向かって進んでいる。
A breakthrough above this resistance could signal the start of a new uptrend, potentially challenging previous highs. However, traders will be watching closely for sustained volume to accompany this price increase, as higher trade volumes would lend credence to the breakout and suggest stronger conviction among buyers.
この抵抗線を突破すれば、新たな上昇トレンドの始まりを示す可能性があり、過去の高値に挑戦する可能性があります。しかし、取引高が増加すればブレイクアウトの信憑性が高まり、買い手の確信が強まることが示唆されるため、トレーダーらはこの価格上昇に伴う取引高が継続するかどうかを注意深く監視しているだろう。
The Relative Strength Index (RSI), a momentum indicator, is currently hovering in the upper neutral zone, nearing overbought territory. While this could indicate that a pause or pullback is due, it also reflects the strong buying pressure that has driven the recent price increase.
モメンタム指標である相対力指数(RSI)は現在、中立ゾーン上部で推移しており、買われ過ぎの領域に近づいている。これは一時停止または反落の時期が来ていることを示している可能性がありますが、最近の価格上昇を引き起こした強い買い圧力も反映しています。
Dogecoin not joking
ドージコインは冗談じゃない
At the time of writing, Dogecoin's price hovers around $0.38, which has established itself as a significant resistance point. This level has been tested multiple times over recent weeks, with each attempt bringing increased selling pressure. However, the persistence of DOGE bulls is noteworthy, as they continue to push the price back up to this threshold, indicating a potential accumulation phase preceding a breakout.
本稿執筆時点では、ドージコインの価格は0.38ドル付近で推移しており、重要な抵抗点としての地位を確立している。この水準はここ数週間で何度も試されており、試行のたびに売り圧力が高まっている。しかし、DOGE強気派の粘り強さは注目に値し、価格をこの閾値まで押し戻し続けており、ブレイクアウトに先立つ潜在的な蓄積段階を示しています。
The technical indicators on the chart reinforce this narrative. The moving averages are aligned in a bullish formation, with the 50-day moving average serving as dynamic support below the current price. This could embolden the bulls, offering a psychological boost as they rally to break past the current resistance.
チャート上のテクニカル指標は、この物語を補強します。移動平均線は強気の形成に並んでおり、50 日移動平均線が現在の価格を下回る動的サポートとして機能します。これは強気派を勇気づけ、現在の抵抗を打ち破るために結集する際に心理的な後押しとなる可能性がある。
Furthermore, the formation of a small symmetrical triangle suggests that volatility may be on the horizon for Dogecoin. This pattern, characterized by converging trend lines, points to a period of consolidation that typically precedes significant price movement. Given the positioning of the price at the upper end of the triangle, there is an argument to be made for an impending bullish breakout.
さらに、対称的な小さな三角形の形成は、ドージコインのボラティリティが近づいている可能性があることを示唆しています。このパターンは、トレンドラインが収束することを特徴としており、通常、大きな価格変動に先立って行われる統合期間を示しています。価格がトライアングルの上端に位置していることを考えると、強気のブレイクアウトが差し迫っているという議論があります。
Examining the volume, we see a consistency that accompanies the consolidation pattern, hinting that a breakout could be accompanied by a substantial increase in trade volume. This would provide the necessary market confirmation for a genuine breakthrough, rather than a false breakout that could trap overzealous bulls.
取引量を調べると、統合パターンに伴う一貫性が見られ、ブレイクアウトには取引量の大幅な増加が伴う可能性があることが示唆されています。これは、過度の強気派を罠にはめる可能性のある誤ったブレイクアウトではなく、真のブレイクアウトに必要な市場の確認を提供することになるでしょう。
ADA's consolidation continues
ADAの統合は続く
The Cardano (ADA) market has entered a phase of consolidation, marked by a confluence of technical indicators that suggest brewing momentum. With the price oscillating around $0.38, the question on many investors' minds is whether this is the quiet before the storm of a significant breakout.
カルダノ (ADA) 市場は統合の段階に入り、勢いの醸成を示唆するテクニカル指標の融合が特徴です。価格が0.38ドル付近で推移しているため、多くの投資家の頭の中にある疑問は、これが大きなブレイクアウトの嵐の前の静けさなのかということだ。
A close examination of the daily chart reveals diverging moving averages, with the 50-day moving average trending upward, suggesting a bullish undercurrent, while the 200-day moving average is moving lower, indicating potential longer-term bearish sentiment. This divergence can often signal a period of market indecision, with shorter-term bullish sentiment wrestling against longer-term caution.
日足チャートを詳しく調べると、移動平均線が乖離していることがわかり、50日移動平均は上昇傾向にあり、強気の底流を示唆していますが、200日移動平均は下降傾向にあり、長期的な弱気センチメントの可能性を示しています。この乖離は、短期的な強気感情と長期的な警戒感が対立する、市場が優柔不断な時期を示している可能性があります。
The immediate resistance level for ADA sits at around $0.40, a threshold that has capped upward price movements in recent times. For a confirmed breakout, ADA bulls need to push and sustain the price above this level, ideally with an increase in volume to signify strong market conviction.
ADAの当面の抵抗線は0.40ドル付近にあり、これが最近の値動きの上限となっている。確実なブレイクアウトのためには、ADAの強気派は価格をこのレベル以上に押し上げ、維持する必要があり、理想的には市場の強い確信を示すために出来高を増加させる必要がある。
 TheCoinrise Media
 Thecoinrepublic.com
 DogeHome
 TheCoinrise Media
 TheCoinrise Media
 Cryptopolitan_News
 Coin Edition
 BlockchainReporter


