

Ethereum's price today is showcasing a bullish surge that is drawing attention across the crypto community. Ethereum is a bellwether for the altcoin market, and today's price action suggests that investors are increasingly confident in the asset's value proposition.
오늘 이더리움 가격은 암호화폐 커뮤니티 전반에 걸쳐 관심을 끌고 있는 강세를 보여주고 있습니다. 이더리움은 알트코인 시장의 지표이며 오늘날의 가격 움직임은 투자자들이 자산의 가치 제안에 점점 더 자신감을 갖고 있음을 시사합니다.
The technical chart for Ethereum indicates a strong push toward a key resistance level. After a period of consolidation, the price has broken out, suggesting a potential shift from a bearish to a bullish trend at around $2,100. This move aligns with a broader market recovery.
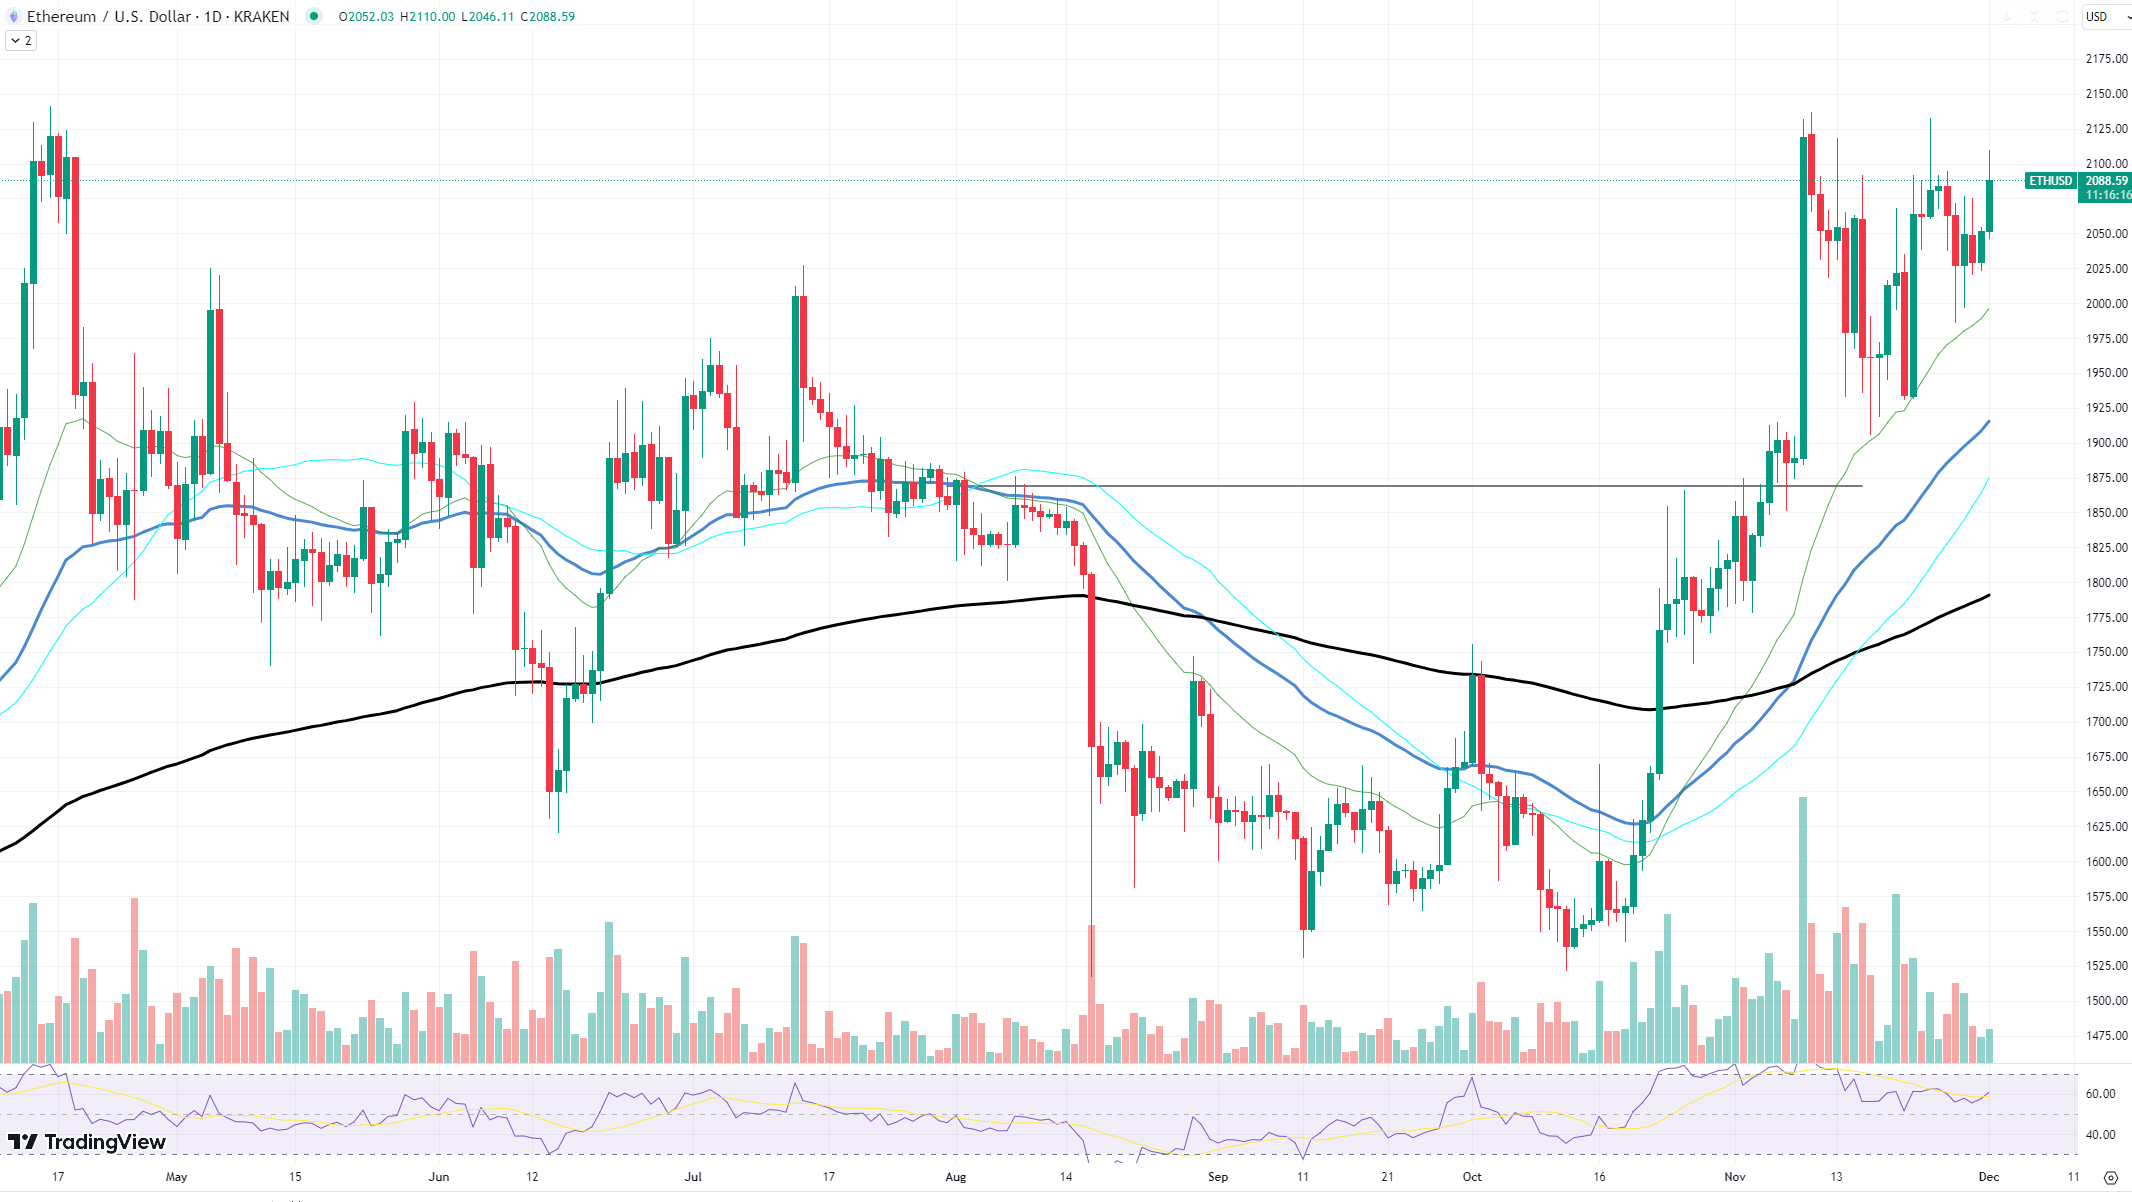 ETH/USD Chart by TradingView
TradingView ETH/USD 차트
Analyzing the chart, Ethereum has been tracing an ascending trajectory, supported by a rising trendline that underscores a series of higher lows – a classic indicator of bullish sentiment. The 50-day moving average, which is often looked upon for trend confirmation, is positioned below the current price, serving as a dynamic support level. The price is pushing toward the $2,100 level, which has historically acted as a significant resistance zone.
A breakthrough above this resistance could signal the start of a new uptrend, potentially challenging previous highs. However, traders will be watching closely for sustained volume to accompany this price increase, as higher trade volumes would lend credence to the breakout and suggest stronger conviction among buyers.
The Relative Strength Index (RSI), a momentum indicator, is currently hovering in the upper neutral zone, nearing overbought territory. While this could indicate that a pause or pullback is due, it also reflects the strong buying pressure that has driven the recent price increase.
모멘텀 지표인 상대강도지수(RSI)는 현재 과매수권에 근접한 중립권 상단에 머물고 있습니다. 이는 일시 중지 또는 하락이 예정되어 있음을 나타낼 수 있지만 최근 가격 인상을 주도한 강력한 구매 압력을 반영하기도 합니다.
Dogecoin not joking
도지코인 농담이 아닙니다
At the time of writing, Dogecoin's price hovers around $0.38, which has established itself as a significant resistance point. This level has been tested multiple times over recent weeks, with each attempt bringing increased selling pressure. However, the persistence of DOGE bulls is noteworthy, as they continue to push the price back up to this threshold, indicating a potential accumulation phase preceding a breakout.
The technical indicators on the chart reinforce this narrative. The moving averages are aligned in a bullish formation, with the 50-day moving average serving as dynamic support below the current price. This could embolden the bulls, offering a psychological boost as they rally to break past the current resistance.
차트의 기술 지표는 이러한 설명을 강화합니다. 이동 평균은 강세 형태로 정렬되어 있으며 50일 이동 평균은 현재 가격 아래에서 동적 지지 역할을 합니다. 이는 황소를 대담하게 만들어 현재의 저항을 돌파하기 위해 집결할 때 심리적 활력을 제공할 수 있습니다.
Furthermore, the formation of a small symmetrical triangle suggests that volatility may be on the horizon for Dogecoin. This pattern, characterized by converging trend lines, points to a period of consolidation that typically precedes significant price movement. Given the positioning of the price at the upper end of the triangle, there is an argument to be made for an impending bullish breakout.
또한, 작은 대칭 삼각형의 형성은 도지코인의 변동성이 곧 나타날 수 있음을 시사합니다. 추세선이 수렴하는 것이 특징인 이 패턴은 일반적으로 상당한 가격 변동이 발생하기 전에 통합 기간이 있음을 나타냅니다. 가격이 삼각형 상단에 위치한다는 점을 감안할 때 강세 돌파가 임박했다는 주장이 제기되고 있습니다.
Examining the volume, we see a consistency that accompanies the consolidation pattern, hinting that a breakout could be accompanied by a substantial increase in trade volume. This would provide the necessary market confirmation for a genuine breakthrough, rather than a false breakout that could trap overzealous bulls.
ADA's consolidation continues
ADA의 통합은 계속됩니다
The Cardano (ADA) market has entered a phase of consolidation, marked by a confluence of technical indicators that suggest brewing momentum. With the price oscillating around $0.38, the question on many investors' minds is whether this is the quiet before the storm of a significant breakout.
A close examination of the daily chart reveals diverging moving averages, with the 50-day moving average trending upward, suggesting a bullish undercurrent, while the 200-day moving average is moving lower, indicating potential longer-term bearish sentiment. This divergence can often signal a period of market indecision, with shorter-term bullish sentiment wrestling against longer-term caution.
The immediate resistance level for ADA sits at around $0.40, a threshold that has capped upward price movements in recent times. For a confirmed breakout, ADA bulls need to push and sustain the price above this level, ideally with an increase in volume to signify strong market conviction.
ADA의 즉각적인 저항 수준은 약 $0.40이며, 이는 최근 가격 상승을 제한하는 임계값입니다. 확고한 돌파를 위해서는 ADA 황소가 이 수준 이상으로 가격을 밀어붙이고 유지해야 하며, 이상적으로는 강한 시장 확신을 나타내기 위해 거래량을 늘려야 합니다.
 Optimisus
 Optimisus
 DeFi Planet
 Crypto Daily™
 BlockchainReporter
 TheCoinrise Media
 DogeHome
 Crypto Daily™
 Crypto Daily™


