

Ethereum's price today is showcasing a bullish surge that is drawing attention across the crypto community. Ethereum is a bellwether for the altcoin market, and today's price action suggests that investors are increasingly confident in the asset's value proposition.
今天以太坊的价格呈现出看涨的势头,引起了整个加密货币社区的关注。以太坊是山寨币市场的领头羊,今天的价格走势表明投资者对该资产的价值主张越来越有信心。
The technical chart for Ethereum indicates a strong push toward a key resistance level. After a period of consolidation, the price has broken out, suggesting a potential shift from a bearish to a bullish trend at around $2,100. This move aligns with a broader market recovery.
以太坊的技术图表显示,该货币对关键阻力位有强劲推动力。经过一段时间的盘整后,价格出现突破,表明可能在 2,100 美元左右从看跌趋势转向看涨趋势。此举与更广泛的市场复苏相一致。
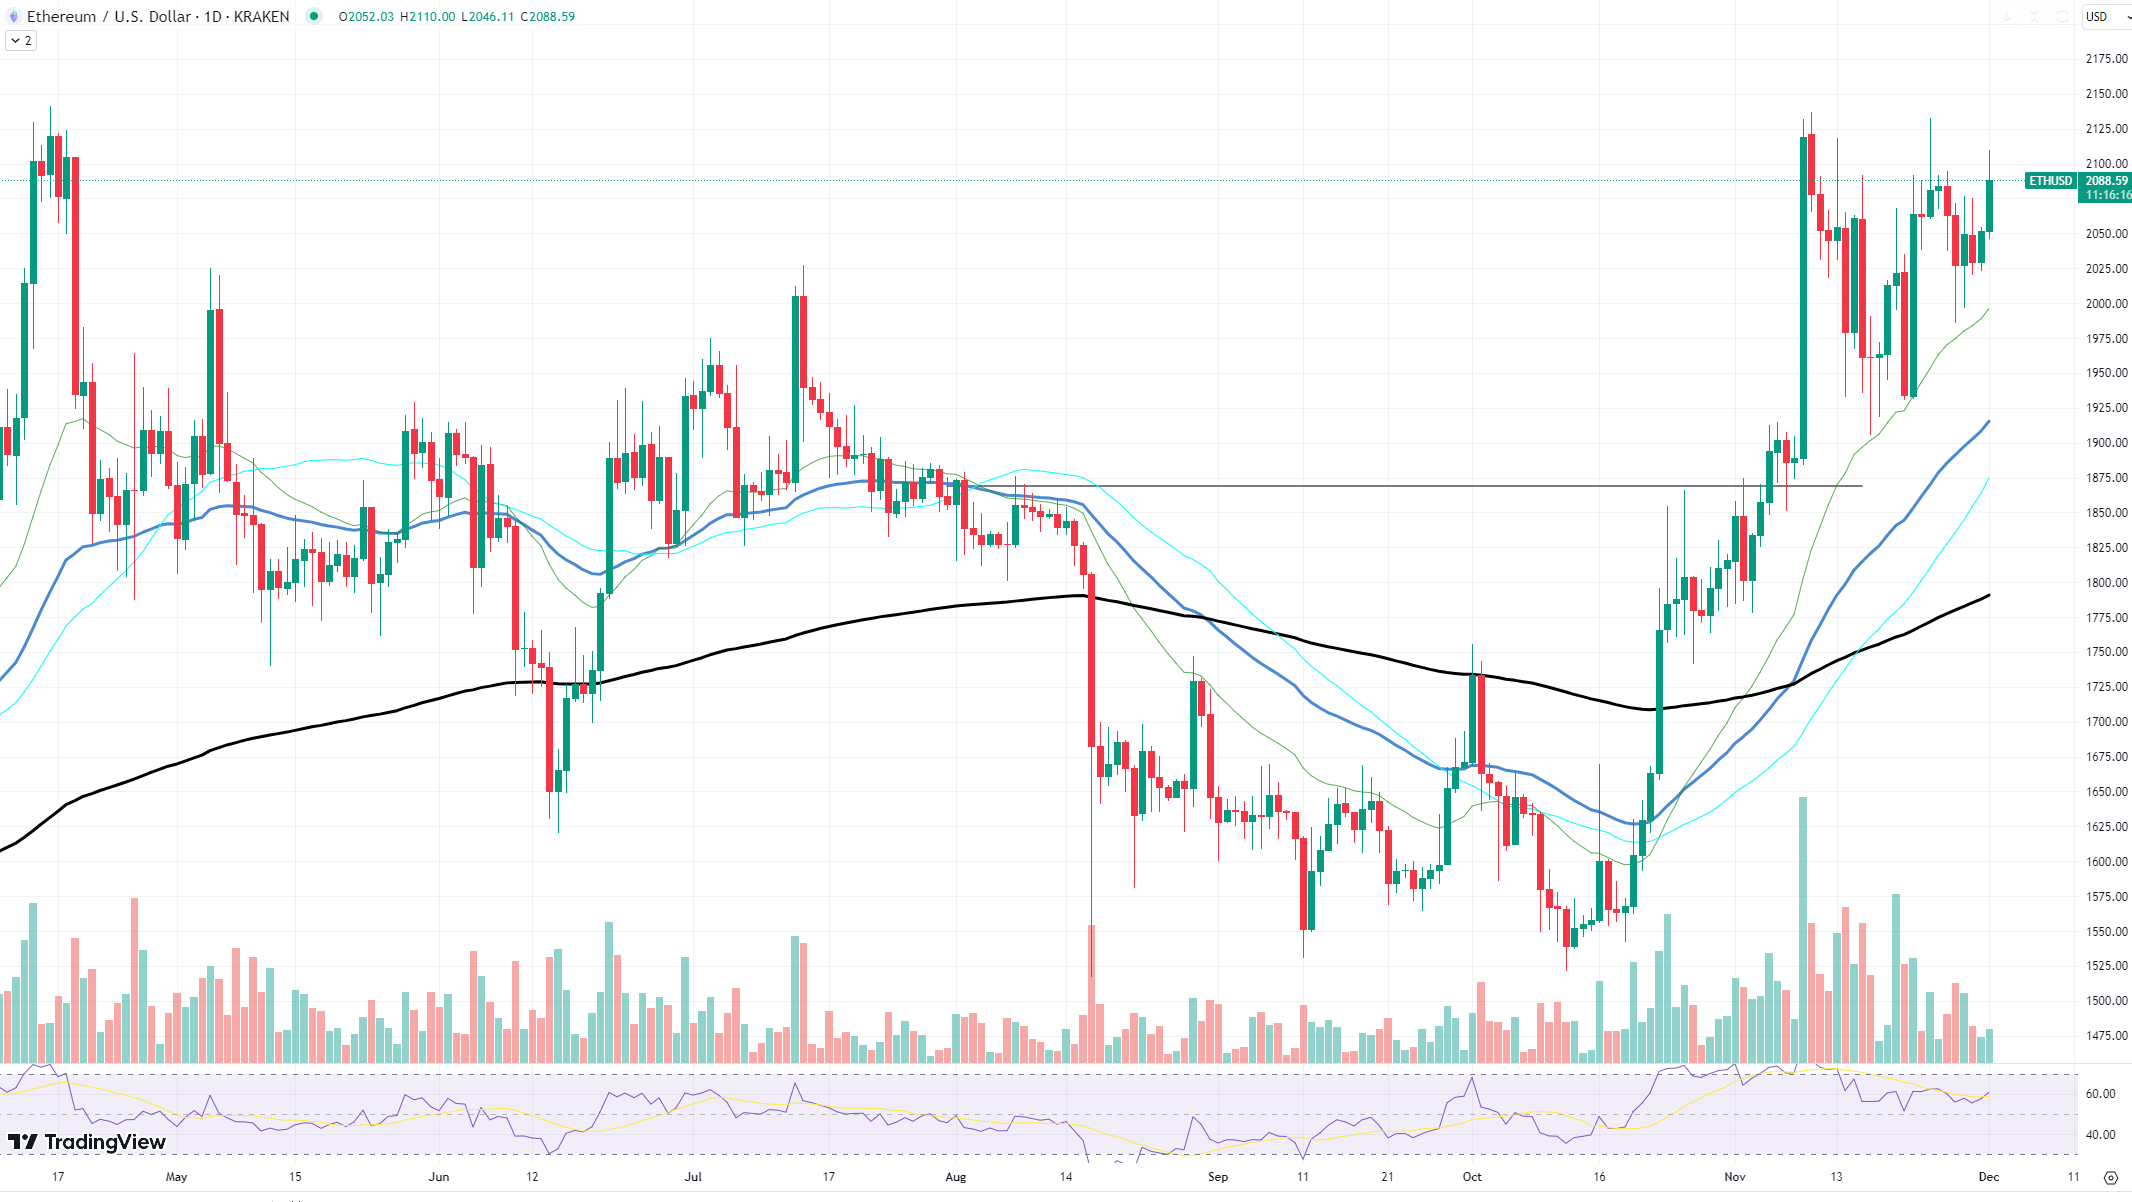 ETH/USD Chart by TradingView
ETH/USD 图表(TradingView)
Analyzing the chart, Ethereum has been tracing an ascending trajectory, supported by a rising trendline that underscores a series of higher lows – a classic indicator of bullish sentiment. The 50-day moving average, which is often looked upon for trend confirmation, is positioned below the current price, serving as a dynamic support level. The price is pushing toward the $2,100 level, which has historically acted as a significant resistance zone.
分析图表,以太坊一直在追踪上升轨迹,受到上升趋势线的支撑,该趋势线强调了一系列更高的低点——这是看涨情绪的经典指标。 50 日移动平均线通常被用来确认趋势,它位于当前价格下方,作为动态支撑位。价格正向 2,100 美元水平推进,该水平历来是一个重要的阻力区域。
A breakthrough above this resistance could signal the start of a new uptrend, potentially challenging previous highs. However, traders will be watching closely for sustained volume to accompany this price increase, as higher trade volumes would lend credence to the breakout and suggest stronger conviction among buyers.
突破该阻力位可能标志着新的上升趋势的开始,并可能挑战之前的高点。然而,交易员将密切关注伴随价格上涨而持续的成交量,因为交易量的增加将证明价格的突破,并表明买家的信心更强。
The Relative Strength Index (RSI), a momentum indicator, is currently hovering in the upper neutral zone, nearing overbought territory. While this could indicate that a pause or pullback is due, it also reflects the strong buying pressure that has driven the recent price increase.
动量指标相对强弱指数(RSI)目前徘徊在中性区上部,接近超买区域。虽然这可能表明价格即将暂停或回调,但也反映出推动近期价格上涨的强劲购买压力。
Dogecoin not joking
狗狗币不是开玩笑
At the time of writing, Dogecoin's price hovers around $0.38, which has established itself as a significant resistance point. This level has been tested multiple times over recent weeks, with each attempt bringing increased selling pressure. However, the persistence of DOGE bulls is noteworthy, as they continue to push the price back up to this threshold, indicating a potential accumulation phase preceding a breakout.
截至撰写本文时,狗狗币的价格徘徊在 0.38 美元左右,这已成为一个重要的阻力点。最近几周,这一水平已被多次测试,每次尝试都会带来更大的抛售压力。然而,DOGE 多头的持续性值得注意,因为他们继续将价格推回到这一阈值,这表明突破前可能存在吸筹阶段。
The technical indicators on the chart reinforce this narrative. The moving averages are aligned in a bullish formation, with the 50-day moving average serving as dynamic support below the current price. This could embolden the bulls, offering a psychological boost as they rally to break past the current resistance.
图表上的技术指标强化了这一说法。移动平均线呈看涨形态,50 日移动平均线作为当前价格下方的动态支撑。这可能会鼓舞多头,在他们反弹突破当前阻力位时提供心理提振。
Furthermore, the formation of a small symmetrical triangle suggests that volatility may be on the horizon for Dogecoin. This pattern, characterized by converging trend lines, points to a period of consolidation that typically precedes significant price movement. Given the positioning of the price at the upper end of the triangle, there is an argument to be made for an impending bullish breakout.
此外,小对称三角形的形成表明狗狗币可能即将出现波动。这种模式以趋势线汇聚为特征,表明通常在价格大幅波动之前会出现一段盘整期。鉴于价格位于三角形的上端,有理由认为即将出现看涨突破。
Examining the volume, we see a consistency that accompanies the consolidation pattern, hinting that a breakout could be accompanied by a substantial increase in trade volume. This would provide the necessary market confirmation for a genuine breakthrough, rather than a false breakout that could trap overzealous bulls.
通过检查交易量,我们发现伴随着盘整模式的一致性,这表明突破可能伴随着交易量的大幅增加。这将为真正的突破提供必要的市场确认,而不是可能困住过度热心多头的虚假突破。
ADA's consolidation continues
ADA 整合仍在继续
The Cardano (ADA) market has entered a phase of consolidation, marked by a confluence of technical indicators that suggest brewing momentum. With the price oscillating around $0.38, the question on many investors' minds is whether this is the quiet before the storm of a significant breakout.
卡尔达诺(ADA)市场已进入盘整阶段,其标志是一系列技术指标表明势头正在酝酿。随着价格在 0.38 美元左右波动,许多投资者心中的疑问是这是否是重大突破暴风雨前的平静。
A close examination of the daily chart reveals diverging moving averages, with the 50-day moving average trending upward, suggesting a bullish undercurrent, while the 200-day moving average is moving lower, indicating potential longer-term bearish sentiment. This divergence can often signal a period of market indecision, with shorter-term bullish sentiment wrestling against longer-term caution.
仔细观察日线图,可以发现均线呈背离状态,50日均线趋势向上,暗示看涨暗流,而200日均线则走低,表明潜在的长期看跌情绪。这种背离往往预示着一段时期的市场犹豫不决,短期看涨情绪与长期谨慎情绪之间的斗争。
The immediate resistance level for ADA sits at around $0.40, a threshold that has capped upward price movements in recent times. For a confirmed breakout, ADA bulls need to push and sustain the price above this level, ideally with an increase in volume to signify strong market conviction.
ADA 的直接阻力位约为 0.40 美元,这是近期限制价格上涨的门槛。为了确认突破,ADA 多头需要将价格推高并维持在该水平之上,理想情况下成交量增加以表明市场信心强劲。
 Optimisus
 Optimisus
 DeFi Planet
 Crypto Daily™
 BlockchainReporter
 TheCoinrise Media
 DogeHome
 Crypto Daily™
 Crypto Daily™


