The XRP price has been treading water in recent days. After XRP rose by more than 52% in just 18 days from mid-October to early November, the price is currently in a clear consolidation phase in the shorter time frames. However, a look at the 1-month chart of the XRP/USD trading pair shows that the XRP price has exhibited strong bullish months.
ここ数日、XRP価格は低迷している。 XRPは10月中旬から11月上旬までのわずか18日間で52%以上上昇した後、価格は現在、より短い時間枠で明確な値固め段階に入っています。しかし、XRP/USD取引ペアの1か月チャートを見ると、XRP価格が強い強気の月を示していることがわかります。
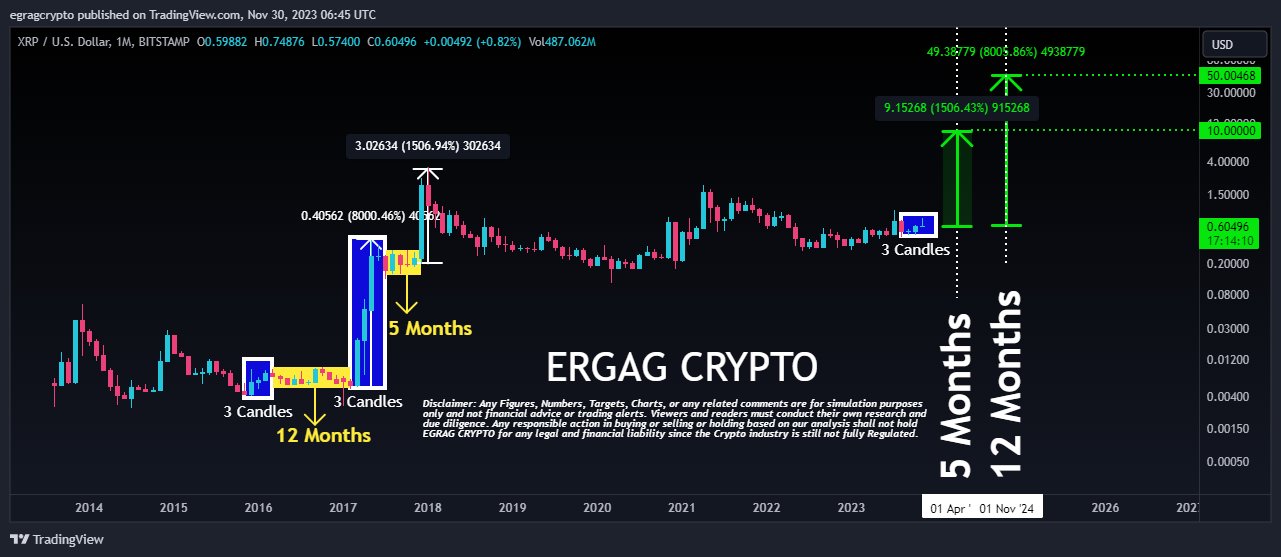
In this sense, Crypto analyst Egrag has drawn attention to an extremely rare phenomenon in the XRP monthly price chart. The pattern in question is a series of three consecutive monthly green candles, which have only been documented twice in the history of the cryptocurrency.
この意味で、仮想通貨アナリストのEgrag氏は、XRP月次価格チャートにおける極めて珍しい現象に注目を集めました。問題のパターンは、毎月 3 回連続する緑色のローソク足であり、仮想通貨の歴史の中で記録されたのは 2 回だけです。
As the market approaches the monthly close today, a confirmation by a close above $0.5987 could mean the third monthly green candle for XRP. “Get ready—within the next [few] hours, we’re poised to seal another trio of consecutive green candles,” Egrag noted.
今日市場が月次終値に近づいているため、0.5987ドルを上回る終値で確認されれば、XRPにとって3回目の月次青キャンドルが出現することを意味する可能性がある。 「準備を整えてください。今後[数]時間以内に、私たちはさらに3本の連続した緑のろうそくを封印する準備ができています」とエグラッグ氏は述べた。
Here’s What This Could Mean For XRP Price
これがXRP価格に何を意味するか
Delving into the specifics, Egrag elucidates two distinct historical precedents post such formations. In the first scenario, a 5-month consolidation phase was observed after XRP recorded three consecutive green candles from March to May 2017.
詳細を掘り下げて、Egrag はそのような形成後の 2 つの異なる歴史的先例を明らかにしています。最初のシナリオでは、XRPが2017年3月から5月にかけて3回連続の青のローソク足を記録した後、5か月間の値固めフェーズが観察されました。
However, the consolidation phase had an extremely bullish effect. After it ended, the XRP price experienced a staggering 1,500% surge within just two months. Egrag suggests that if XRP’s price action were to emulate this historical pattern, investors can anticipate a potential surge to $10, starting from the 1st of April 2024.
しかし、統合局面では非常に強気の効果があった。それが終了した後、XRP価格はわずか2か月以内に1,500%という驚異的な急騰を経験しました。 Egrag氏は、XRPの価格行動がこの歴史的なパターンを模倣した場合、投資家は2024年4月1日から始まる10ドルへの潜在的な高騰を予測できると示唆しています。
The second instance Egrag refers to the period from December 2015 to February 2016. During this time, the price rose by approximately 102% in three consecutive green months. What followed was a lengthier 12-month consolidation phase. But the wait was worth it again.
2 番目のインスタンス Egrag は、2015 年 12 月から 2016 年 2 月までの期間を指します。この期間中、価格は 3 連続の緑色の月で約 102% 上昇しました。その後、12 か月にわたる長期にわたる統合フェーズが続きました。しかし、またしても待った価値はありました。
In March 2018, the XRP price started an extraordinary 8,000% rally. A replication of this scenario would imply a potential skyrocketing of XRP’s price to $50, beginning on the 1st of November 2024.
2018年3月、XRP価格は8,000%という驚異的な上昇を開始しました。このシナリオが再現されると、2024 年 11 月 1 日から XRP の価格が 50 ドルに急騰する可能性が示唆されます。

Notably, Egrag offers an average price target standing at $30. He stated, “XRP army stay steady, the average of these two targets lands at $30, you know that I always whisper to you my secret target of $27. Hallelujah, the anticipation is palpable!”
特に、Egrag は平均目標株価を 30 ドルとしています。彼は、「XRP軍は安定しており、これら2つの目標の平均は30ドルに達します。ご存知のとおり、私はいつも秘密の目標を27ドルとささやきます。ハレルヤ、期待は明らかです!」
Price Analysis: 1-Day Chart
価格分析: 1日チャート
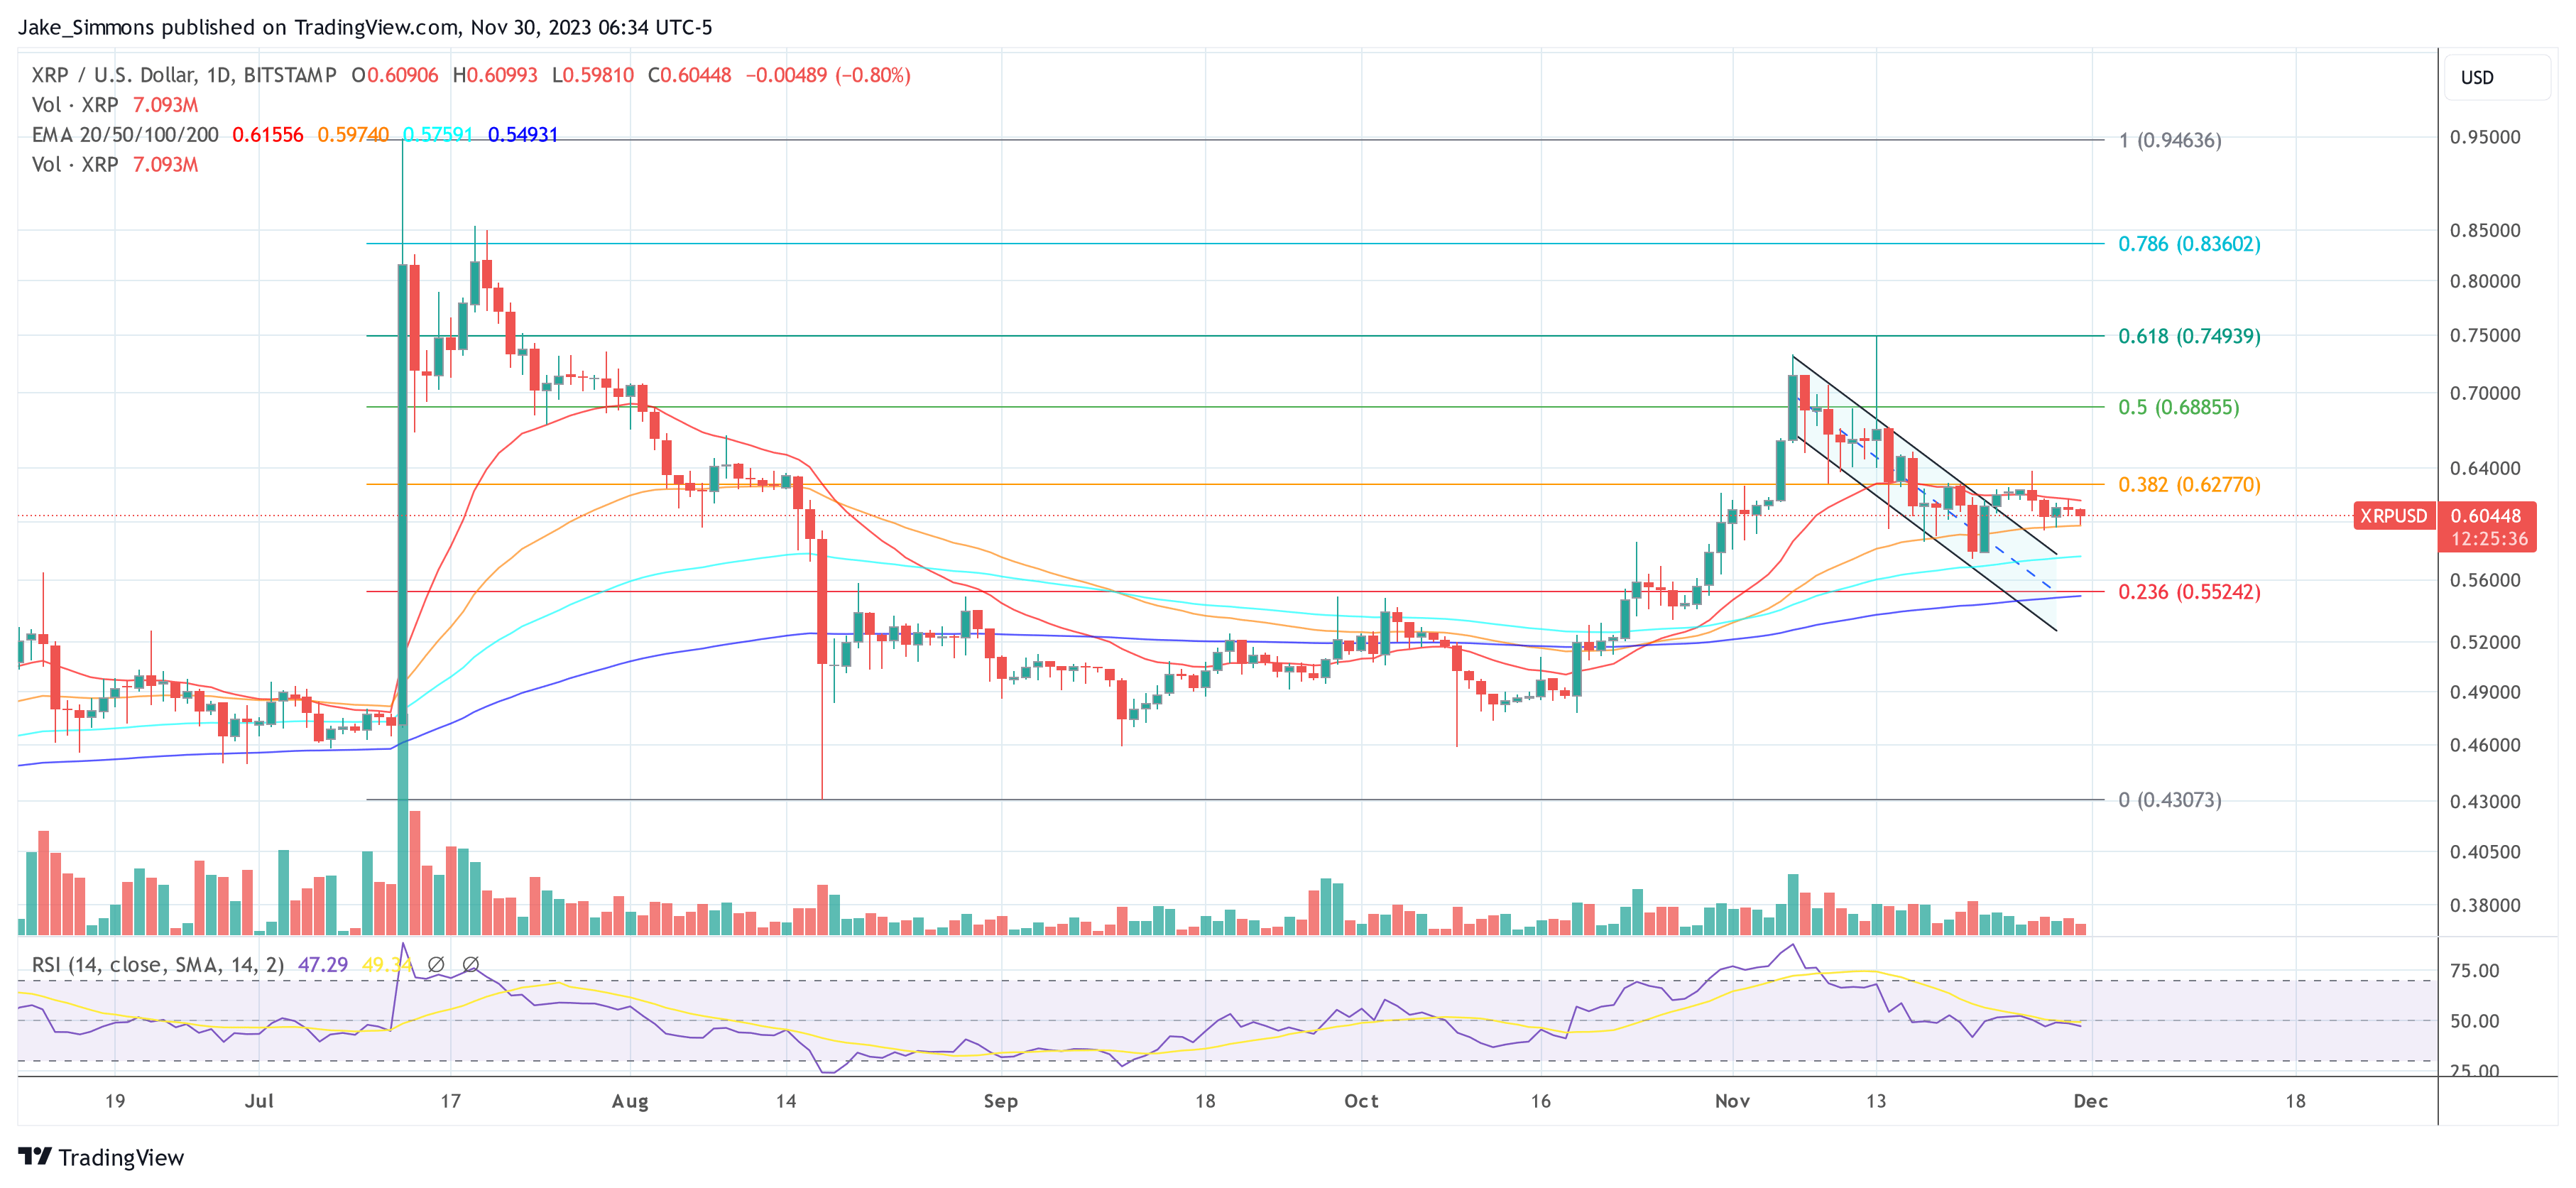
At press time, XRP was trading at $0.60333. A week ago, the price managed to break out of a downtrend channel. However, the bullish momentum quickly fizzled out after the price was rejected at the 0.382 Fibonacci retracement level at $0.627.
記事執筆時点では、XRPは0.60333ドルで取引されていました。 1週間前、価格はなんとか下降トレンドチャンネルを抜け出すことができた。しかし、0.627ドルの0.382フィボナッチリトレースメントレベルで価格が拒否された後、強気の勢いはすぐに消えた。
Related Reading: Bitcoin Decouples with XRP, BNB But Correlates With Dogecoin and Cardano
関連記事: ビットコインはXRP、BNBと切り離されるが、ドージコインやカルダノとは相関する
For four days now, the XRP price has been squeezed into a tight range between the 20-day and 50-day EMA (Exponential Moving Average), with a breakout to the downside or upside getting closer and closer. In the event of an upside breakout, the price level at $0.627 would be decisive. Then, the price could tackle the 0.5 Fibonacci retracement level at $0.688.
ここ4日間、XRP価格は20日と50日のEMA(指数移動平均)の間の狭い範囲に押し込まれており、下値または上値へのブレイクアウトがますます近づいています。上値ブレイクアウトの場合、0.627ドルの価格水準が決定的となるだろう。その後、価格は0.688ドルの0.5フィボナッチリトレースメントレベルに達する可能性があります。
However, if a breakout to the downside happens, a 100-day EMA at $0.575 would be the first support. This must hold to prevent the price from falling towards the 0.236 Fibonacci retracement level at $0.552, which is also close to the 200-day EMA. The convergence of both indicators signifies a price level that the bulls must defend at all costs.
しかし、下値へのブレイクアウトが起こった場合、0.575ドルの100日EMAが最初のサポートとなるだろう。これは、価格が0.552ドルの0.236フィボナッチリトレースメントレベルに向けて下落するのを防ぐために維持する必要があり、これも200日EMAに近い。両方の指標の収束は、強気派が何としても守らなければならない価格水準を示しています。


 Crypto Daily™
 Crypto Daily™
 DogeHome
 TheCoinrise Media
 Thecoinrepublic.com
 TheCoinrise Media
 TheCoinrise Media
 Cryptopolitan_News


