The XRP price has been treading water in recent days. After XRP rose by more than 52% in just 18 days from mid-October to early November, the price is currently in a clear consolidation phase in the shorter time frames. However, a look at the 1-month chart of the XRP/USD trading pair shows that the XRP price has exhibited strong bullish months.
最近幾天 XRP 價格一直停滯不前。從 10 月中旬到 11 月初,XRP 在短短 18 天內上漲了 52% 以上,目前價格在較短的時間內處於明顯的盤整階段。然而,從 XRP/USD 交易對的 1 個月圖表來看,XRP 價格已表現出強勁的看漲月份。
In this sense, Crypto analyst Egrag has drawn attention to an extremely rare phenomenon in the XRP monthly price chart. The pattern in question is a series of three consecutive monthly green candles, which have only been documented twice in the history of the cryptocurrency.
從這個意義上說,加密貨幣分析師 Egrag 引起了人們對 XRP 月度價格圖表中極其罕見的現象的關注。所討論的模式是一系列連續三個月的綠色蠟燭,這種模式在加密貨幣的歷史上只被記錄過兩次。
As the market approaches the monthly close today, a confirmation by a close above $0.5987 could mean the third monthly green candle for XRP. “Get ready—within the next [few] hours, we’re poised to seal another trio of consecutive green candles,” Egrag noted.
隨著市場今天接近月度收盤價,收盤價高於 0.5987 美元的確認可能意味著 XRP 出現第三個月度綠色蠟燭。 「做好準備——在接下來的幾個小時內,我們準備密封另外三支連續的綠色蠟燭,」埃格拉格指出。
Here’s What This Could Mean For XRP Price
這對 XRP 價格意味著什麼
Delving into the specifics, Egrag elucidates two distinct historical precedents post such formations. In the first scenario, a 5-month consolidation phase was observed after XRP recorded three consecutive green candles from March to May 2017.
埃格拉格深入研究具體細節,闡明了此類形成後的兩個截然不同的歷史先例。在第一種情況下,XRP 從 2017 年 3 月到 5 月連續錄得三個綠色蠟燭後,觀察到了為期 5 個月的盤整階段。
However, the consolidation phase had an extremely bullish effect. After it ended, the XRP price experienced a staggering 1,500% surge within just two months. Egrag suggests that if XRP’s price action were to emulate this historical pattern, investors can anticipate a potential surge to $10, starting from the 1st of April 2024.
然而,盤整階段產生了極為看漲的影響。結束後,XRP 價格在短短兩個月內就飆升了 1,500%。 Egrag 表示,如果 XRP 的價格走勢效仿這一歷史模式,投資者可以預期從 2024 年 4 月 1 日開始,XRP 的價格可能會飆升至 10 美元。
The second instance Egrag refers to the period from December 2015 to February 2016. During this time, the price rose by approximately 102% in three consecutive green months. What followed was a lengthier 12-month consolidation phase. But the wait was worth it again.
第二個例子Egrag指的是2015年12月至2016年2月期間。在此期間,價格連續三個月上漲約102%。接下來是更長的 12 個月整合階段。但等待再次是值得的。
In March 2018, the XRP price started an extraordinary 8,000% rally. A replication of this scenario would imply a potential skyrocketing of XRP’s price to $50, beginning on the 1st of November 2024.
2018 年 3 月,XRP 價格開始了 8,000% 的非凡上漲。如果複製這種情況,XRP 的價格可能會從 2024 年 11 月 1 日開始飆升至 50 美元。
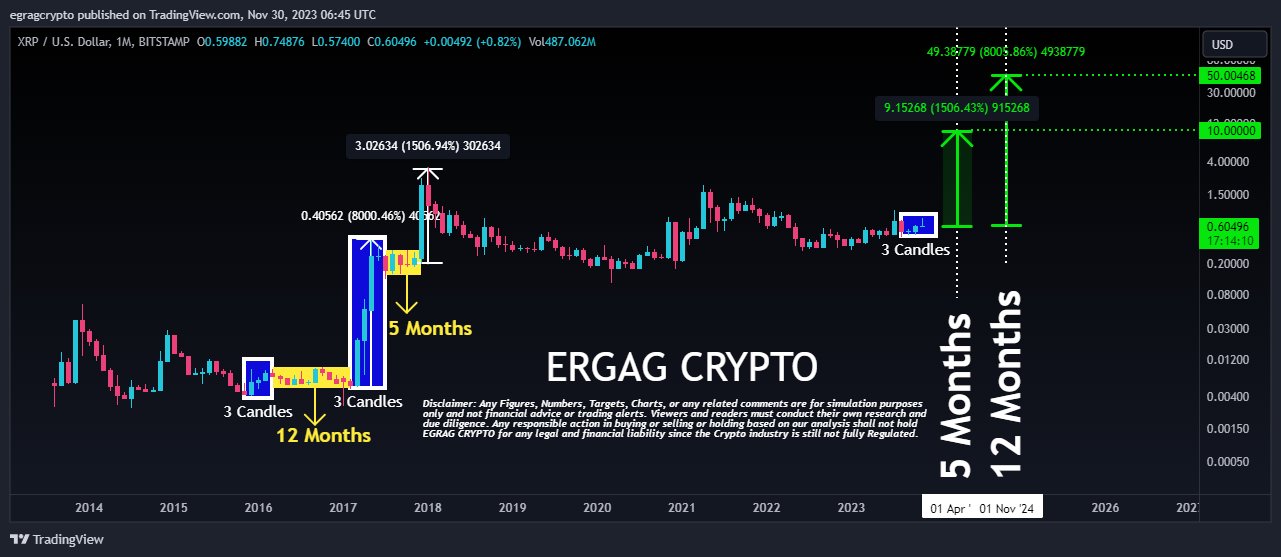
Notably, Egrag offers an average price target standing at $30. He stated, “XRP army stay steady, the average of these two targets lands at $30, you know that I always whisper to you my secret target of $27. Hallelujah, the anticipation is palpable!”
值得注意的是,Egrag 給出的平均目標價為 30 美元。他表示,「XRP 軍隊保持穩定,這兩個目標的平均值為 30 美元,你知道我總是低聲告訴你我的秘密目標是 27 美元。哈利路亞,期待之情溢於言表!”
Price Analysis: 1-Day Chart
價格分析:1 日圖
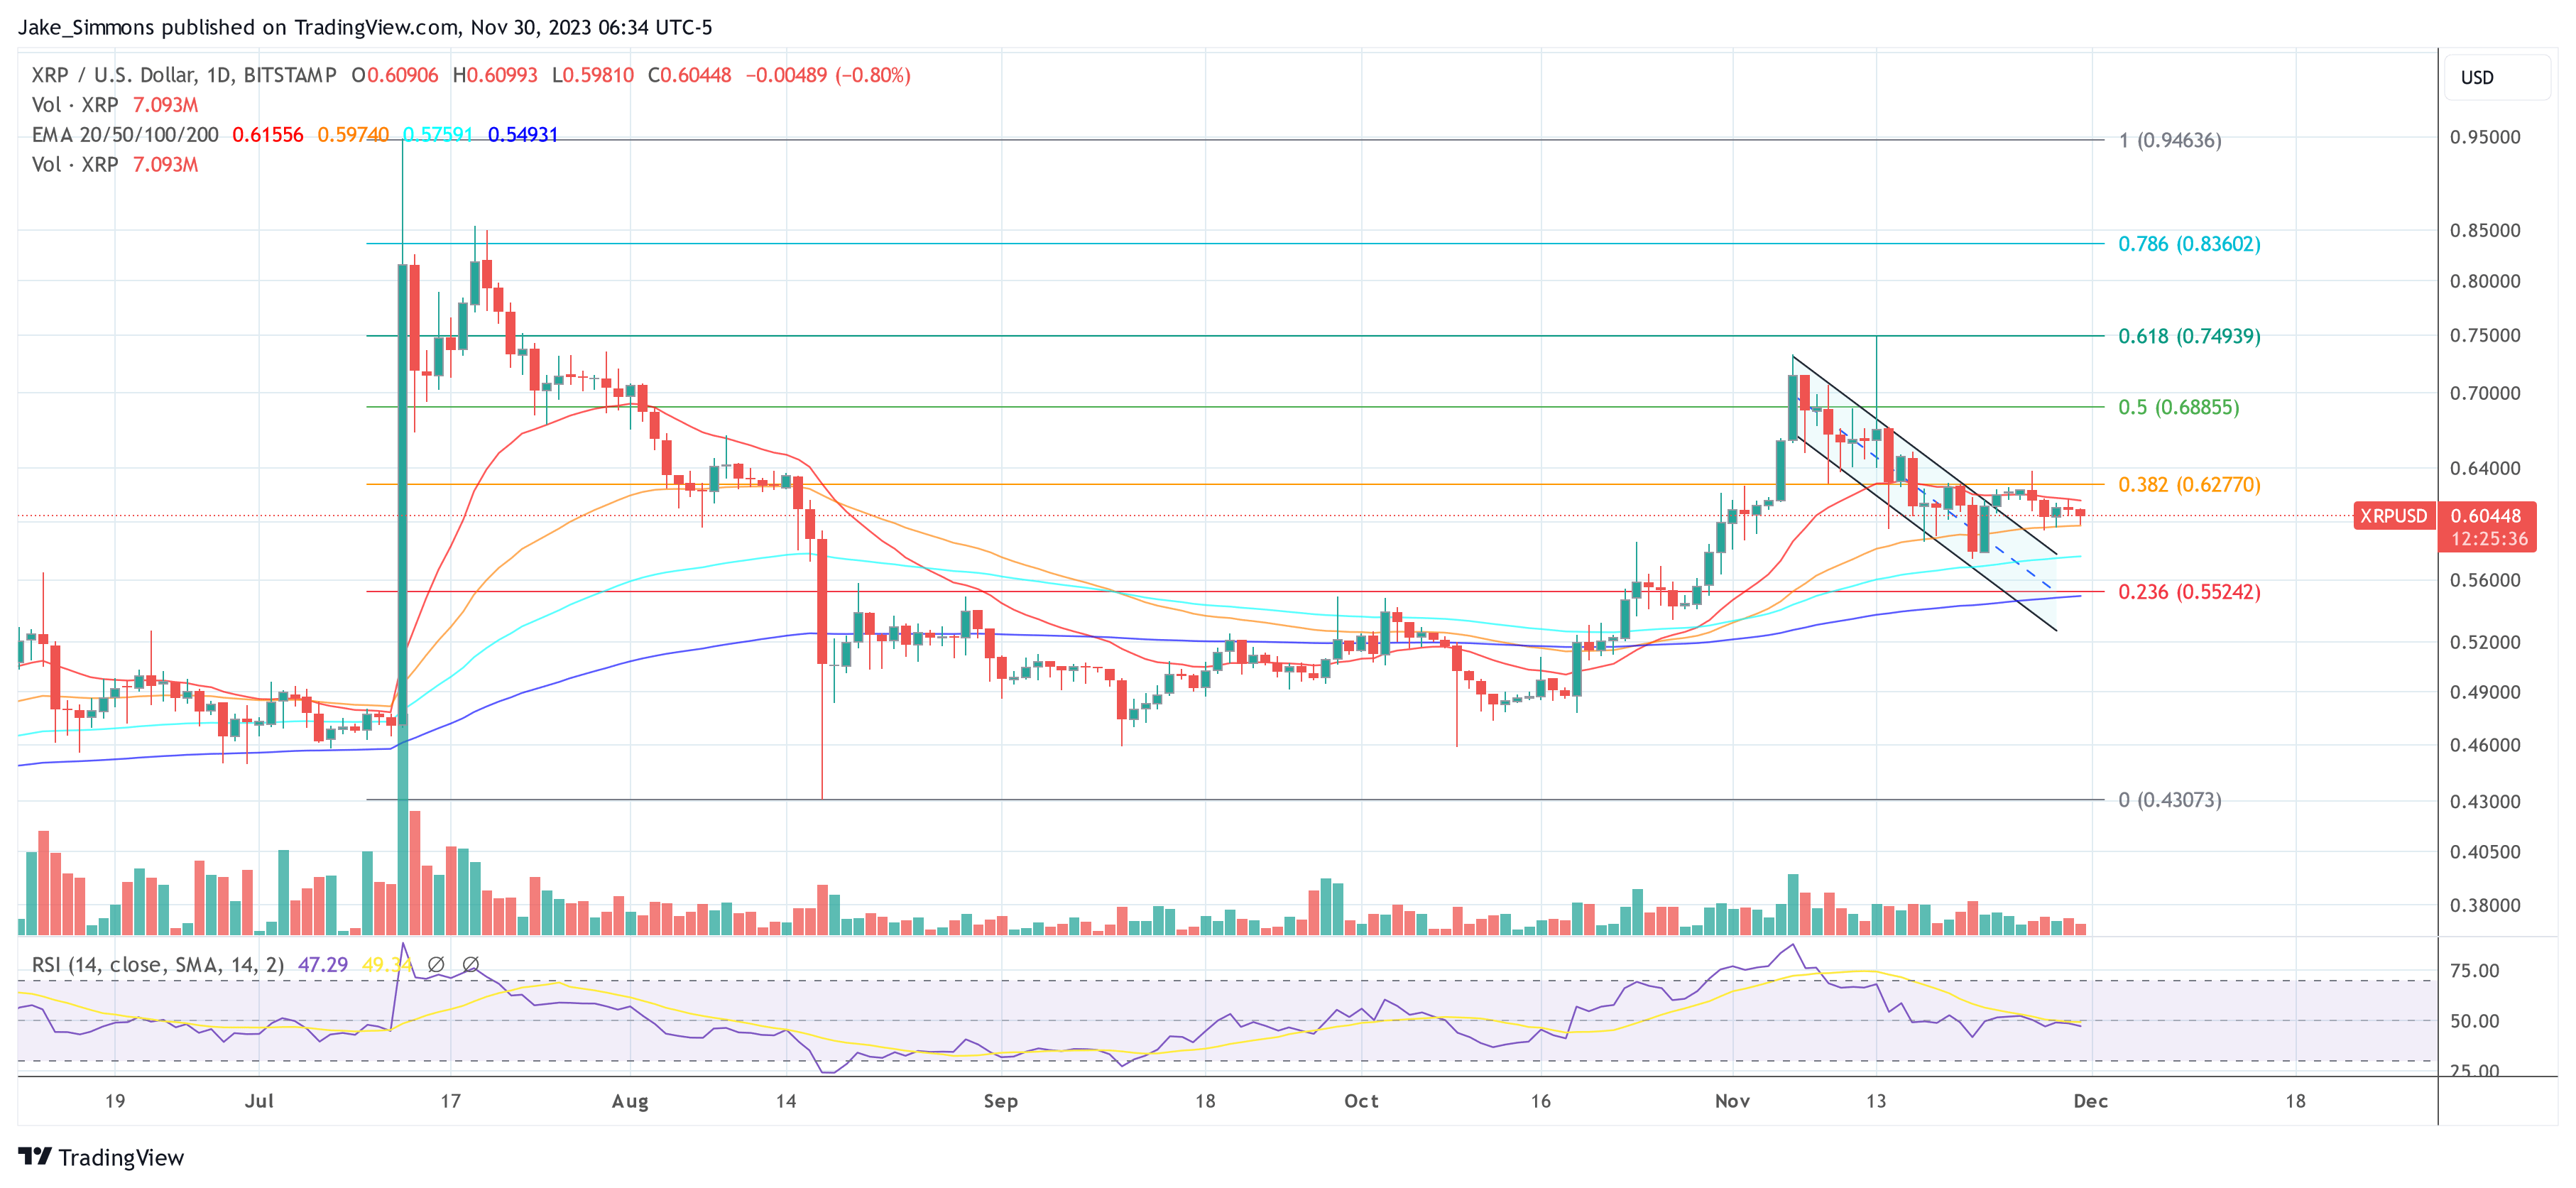
At press time, XRP was trading at $0.60333. A week ago, the price managed to break out of a downtrend channel. However, the bullish momentum quickly fizzled out after the price was rejected at the 0.382 Fibonacci retracement level at $0.627.
截至發稿時,XRP 交易價格為 0.60333 美元。一週前,價格成功突破下降通道。然而,在價格在 0.382 斐波那契回檔位 0.627 美元處被拒絕後,看漲勢頭很快就消失了。
Related Reading: Bitcoin Decouples with XRP, BNB But Correlates With Dogecoin and Cardano
相關閱讀:比特幣與 XRP、BNB 脫鉤,但與狗狗幣和卡爾達諾相關
For four days now, the XRP price has been squeezed into a tight range between the 20-day and 50-day EMA (Exponential Moving Average), with a breakout to the downside or upside getting closer and closer. In the event of an upside breakout, the price level at $0.627 would be decisive. Then, the price could tackle the 0.5 Fibonacci retracement level at $0.688.
四天來,XRP 價格一直被擠壓在 20 日和 50 日 EMA(指數移動平均線)之間的窄幅區間內,向下或向上突破越來越近。如果出現向上突破,0.627 美元的價格水準將是決定性的。然後,價格可能會突破 0.5 斐波那契回檔位 0.688 美元。
However, if a breakout to the downside happens, a 100-day EMA at $0.575 would be the first support. This must hold to prevent the price from falling towards the 0.236 Fibonacci retracement level at $0.552, which is also close to the 200-day EMA. The convergence of both indicators signifies a price level that the bulls must defend at all costs.
然而,如果向下突破,0.575 美元的 100 日均線將是第一個支撐位。必須保持這一點,以防止價格跌向 0.236 斐波那契回檔位 0.552 美元,該水平也接近 200 日均線。兩個指標的收斂性顯示多頭必須不惜一切代價捍衛價格水準。


 DogeHome
 TheCoinrise Media
 TheCoinrise Media
 DogeHome
 Crypto Daily™
 U_Today
 Coinstelegram
 FrankNez
 DogeHome


