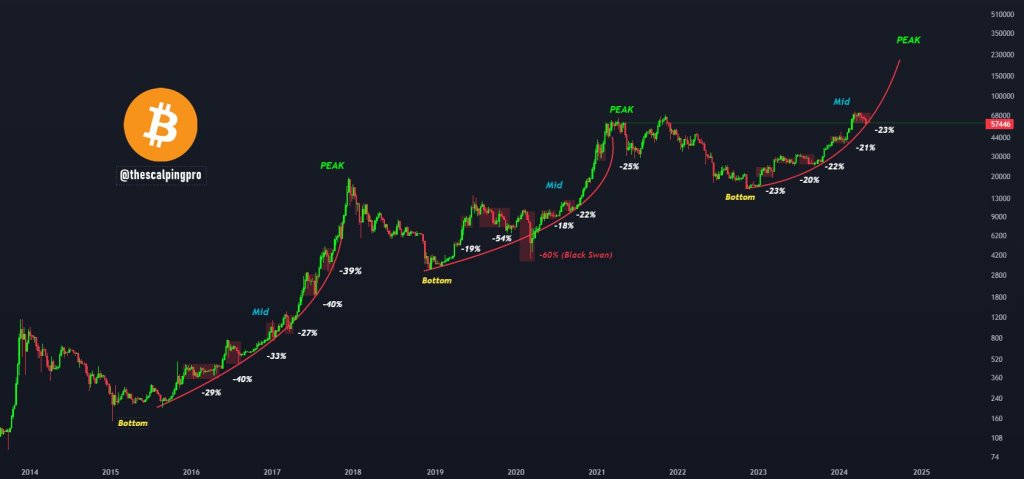
As Bitcoin plunges, liquidating leveraged long positions in its wake, an analyst in a post on X posits that this could be a prime opportunity for accumulation, citing historical patterns of pullbacks followed by impressive recoveries.
ビットコインが急落し、その後レバレッジを利かせたロングポジションが清算される中、あるアナリストはXへの投稿で、下落後に目覚ましい回復が続くという過去のパターンを引用し、これが蓄積の絶好の機会になる可能性があると主張した。
Time to Load Up on the Bitcoin Dip?
ビットコインの下落に乗り出す時が来た?
The analyst presented a chart indicating that Bitcoin is within historical retracement ranges. Historically, when this occurs, prices tend to rebound sharply, surging higher to the delight of holders. 
アナリストは、ビットコインが過去のリトレースメント範囲内にあることを示すチャートを提示した。歴史的に、これが起こると価格は急激に反発し、保有者を喜ばせるほど高騰する傾向があります。
BTC Historical Retracements | Source: Analyst on X
BTC ヒストリトレースメント |出典: X のアナリスト
Solid data supports this assessment. The analyst noted that since Bitcoin bottomed at $15,500 in 2022, there have been four distinct pullbacks, all within the -20% to -23% range. For the savvy, the trader continued, each of these downturns presented an opportunity to accumulate at a discount.
確かなデータがこの評価を裏付けています。同アナリストは、ビットコインが2022年に1万5500ドルで底を打って以来、4回の明確な下落があり、すべて-20%から-23%の範囲内にあると指摘した。賢い人にとって、これらの景気低迷はそれぞれ、割引価格で積み立てられる機会を提供した、とトレーダーは続けた。
Related Reading: Shiba Inu Fees on Fire: What's Behind the 500% Surge?
関連記事: 柴犬の料金が炎上: 500% の高騰の裏に何があるのか?
Therefore, if history repeats itself, Bitcoin may be available at a discount at spot rates. At spot rates, the coin is down by around 23% from its all-time high of $73,800 in mid-March. 
したがって、歴史が繰り返される場合、ビットコインはスポットレートで割引価格で入手できるようになる可能性があります。スポットレートでは、このコインは3月中旬の史上最高値7万3800ドルから約23%下落している。
Bitcoin Price Trending Downward on the Daily Chart | Source: BTCUSDT on Binance, TradingView
ビットコイン価格は日足チャートで下落傾向 |出典: Binance の BTCUSDT、TradingView
Predicting future price movements is uncertain. However, based on the candlestick arrangement, BTC faces resistance at the $60,000 to $61,000 zone. A clear breakout above this zone could validate the analyst's forecast, potentially triggering a new leg up that could reach $74,000 in the coming weeks.
将来の価格変動を予測することは不確実です。しかし、ローソク足の配置に基づくと、BTCは60,000ドルから61,000ドルのゾーンで抵抗に直面しています。このゾーンを明確に上抜ければ、アナリストの予測が検証され、新たな上昇を引き起こす可能性があり、今後数週間で74,000ドルに達する可能性があります。
Shrinking Spot ETF Inflows, United States Federal Reserve Turns Dovish
スポットETF流入が縮小、米連邦準備理事会がハト派に転じる
Despite the optimism, the possibility of BTC falling below the $52,000 and $50,000 support levels cannot be dismissed. This bearish outlook is also supported by data.
楽観的な見方にもかかわらず、BTCが52,000ドルと50,000ドルのサポートレベルを下回る可能性は無視できません。この弱気見通しはデータによっても裏付けられている。
For example, on May 1, spot Bitcoin exchange-traded funds (ETFs) redeemed $563.7 million worth of BTC. During the coin's rally from February to mid-March, inflows were in the hundreds of billions.
たとえば、5月1日、スポットビットコイン上場投資信託(ETF)は5億6,370万ドル相当のBTCを償還した。 2月から3月中旬までのコインの上昇期間中、流入額は数千億ドルに上った。
The excitement was palpable even as Grayscale liquidated GBTC, reducing BTC. The recent spike in outflows suggests that sellers are now in control and spot ETF holders are panicking and looking to exit.
Grayscale が GBTC を清算して BTC を減らしたときでも、その興奮は明白でした。最近の流出急増は、売り手が主導権を握っており、スポットETF保有者がパニックに陥り、手放そうとしていることを示唆している。
Related Reading: Shiba Inu Team Unveils Two-Phase Hard Fork Strategy for Shibarium
関連記事: 柴犬チーム、Shibarium の 2 フェーズのハードフォーク戦略を発表
Despite the negative sentiment and predictions of Bitcoin falling to $52,000, another analyst remains positive. Citing the United States Federal Reserve reducing Quantitative Tightening (QT) runoff from $65 billion to $45 billion, the analyst believes that Bitcoin prices could benefit from the "dovish" environment.
ネガティブなセンチメントとビットコインが5万2000ドルまで下落するとの予測にもかかわらず、別のアナリストは依然としてポジティブな見方をしている。米国連邦準備制度が量的引き締め(QT)の流出額を650億ドルから450億ドルに削減したことを引用し、アナリストはビットコイン価格が「ハト派」環境から恩恵を受ける可能性があると信じている。
Notably, the central bank has indicated that it is unlikely to raise interest rates. Instead, they are considering cutting rates if supportive data shows that inflation is falling towards the 2% benchmark level. Currently, inflation remains elevated but lower than the 2021 averages.
注目すべきは、中央銀行が金利を引き上げる可能性は低いと示唆していることである。その代わり、インフレ率が2%の基準水準に向けて低下していることを裏付けるデータが示された場合、利下げを検討している。現在、インフレ率は依然として高止まりしているが、2021年の平均よりは低い。
Feature image from Canva, chart from TradingView
Canvaからのフィーチャー画像、TradingViewからのチャート


 DogeHome
 Optimisus
 Crypto News Land
 Optimisus
 Cryptopolitan_News
 Cryptopolitan


