

Bitcoin (BTC) is on target to end the week in the red, but a positive sign for the bulls is that the price has recovered from the intra-week low of about $61,000 to over $65,000. This shows that traders remain long-term bullish and are buying the dips.
비트코인(BTC)은 한 주를 적자로 마감할 예정이지만, 가격이 주중 최저치인 약 61,000달러에서 65,000달러 이상으로 회복되었다는 점은 강세장에 긍정적인 신호입니다. 이는 거래자들이 장기적으로 강세를 유지하고 하락세를 매수하고 있음을 보여줍니다.
CryptoQuant CEO Ki Young Ju expects inflows into spot Bitcoin exchange-traded funds (ETFs) to increase if Bitcoin nears support levels. Young Ju said the new Bitcoin whales, who purchased Bitcoin ETFs, have an on-chain cost basis of $56,000. He anticipates buying to pick up if Bitcoin’s price reaches $56,000.
CryptoQuant CEO 주기영은 비트코인이 지원 수준에 가까워지면 현물 비트코인 상장지수펀드(ETF)로의 유입이 증가할 것으로 예상합니다. 영주는 비트코인 ETF를 구매한 새로운 비트코인 고래의 온체인 비용 기준이 56,000달러라고 말했습니다. 그는 비트코인 가격이 56,000달러에 도달하면 매수세가 상승할 것으로 예상합니다.
Another positive sign that could support Bitcoin’s price is that outflows from the Grayscale Bitcoin Trust (GBTC) are slowing down. According to Fairside Investors data, the outflows from GBTC dropped to just $170 million on March 22. This suggests that the selling pressure could be reducing. If Bitcoin ends March above $61,130, it would be the first-ever seven-month winning streak.
비트코인 가격을 뒷받침할 수 있는 또 다른 긍정적인 신호는 그레이스케일 비트코인 트러스트(GBTC)의 유출이 둔화되고 있다는 것입니다. Fairside Investors 데이터에 따르면 GBTC의 유출은 3월 22일에 1억 7천만 달러로 감소했습니다. 이는 매도 압력이 줄어들 수 있음을 시사합니다. 비트코인이 3월을 61,130달러 이상으로 마감한다면 이는 사상 최초의 7개월 연속 연승 기록이 될 것입니다.
Could a recovery in Bitcoin trigger buying in select altcoins? Let’s look at the top 5 cryptocurrencies that look strong on the charts.
비트코인의 회복이 특정 알트코인의 구매를 유발할 수 있습니까? 차트에서 강세를 보이는 상위 5개 암호화폐를 살펴보겠습니다.
Bitcoin price analysis
비트코인 가격 분석
Bitcoin has been trading near the 20-day exponential moving average ($65,364) for the past few days, indicating a battle between the bulls and the bears for supremacy.
비트코인은 지난 며칠 동안 20일 지수 이동 평균(65,364달러) 근처에서 거래되어 패권을 놓고 황소와 곰 사이의 싸움을 나타냈습니다.
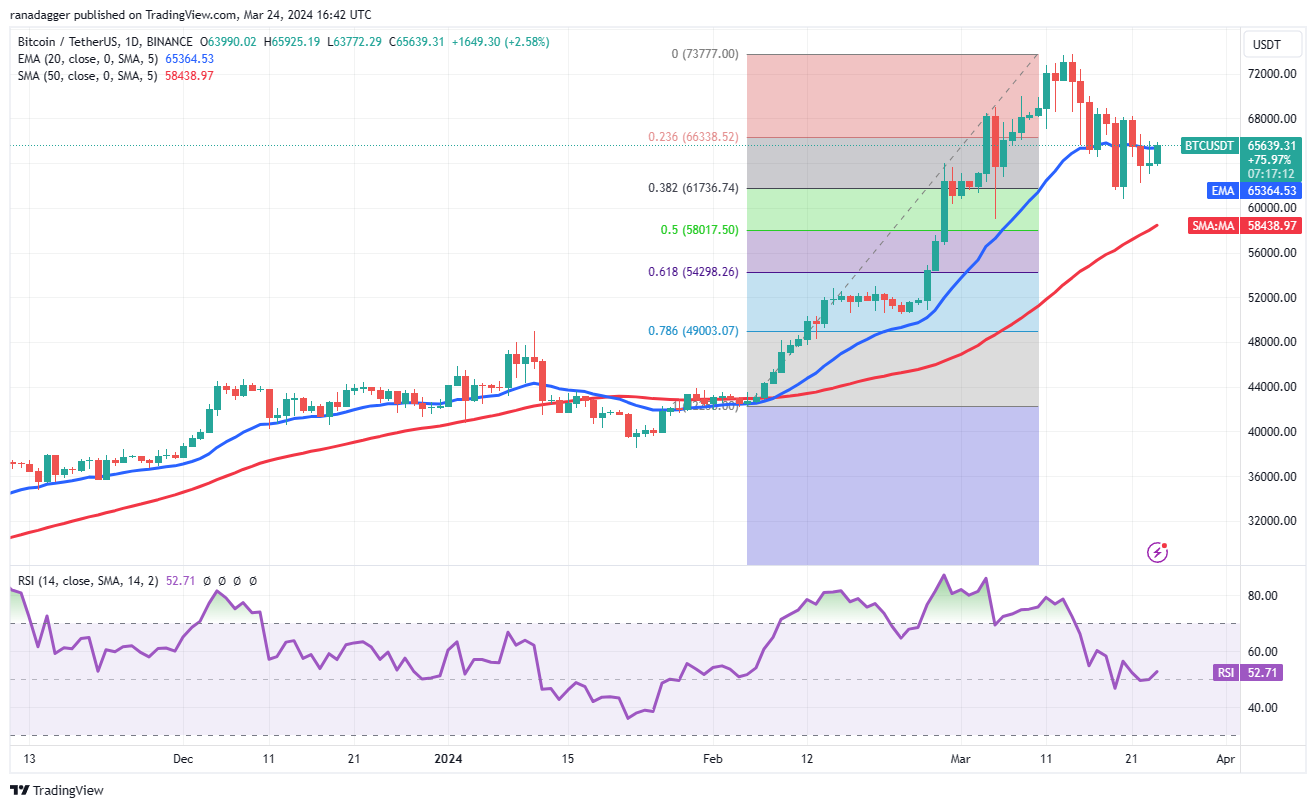
The 20-day EMA is gradually flattening out, and the relative strength index (RSI) is near the midpoint, indicating a balance between supply and demand. The BTC/USDT pair could swing between $60,775 and $69,000 in the near term.
20일 EMA는 점차 평탄화되고 있으며, 상대강도지수(RSI)는 중간점에 가까워 수요와 공급의 균형을 나타냅니다. BTC/USDT 쌍은 단기적으로 $60,775에서 $69,000 사이에서 변동될 수 있습니다.
If the price remains below the 20-day EMA, the support zone between the 50-day simple moving average ($58,438) and $60,775 may come under pressure. If this zone cracks, the correction could deepen to the 61.8% Fibonacci retracement level of $54,298.
가격이 20일 EMA 아래로 유지되면 50일 단순 이동 평균($58,438)과 $60,775 사이의 지지 영역이 압박을 받을 수 있습니다. 이 영역에 균열이 생기면 조정 범위는 61.8% 피보나치 되돌림 수준인 $54,298까지 깊어질 수 있습니다.
On the upside, a break and close above $69,000 could open the doors for a retest of $73,777. If this resistance is scaled, the pair may ascend to $80,000.
긍정적인 측면에서는 $69,000를 초과하는 중단 및 마감이 이루어지면 $73,777의 재테스트를 위한 문이 열릴 수 있습니다. 이 저항이 확장되면 쌍은 $80,000까지 오를 수 있습니다.
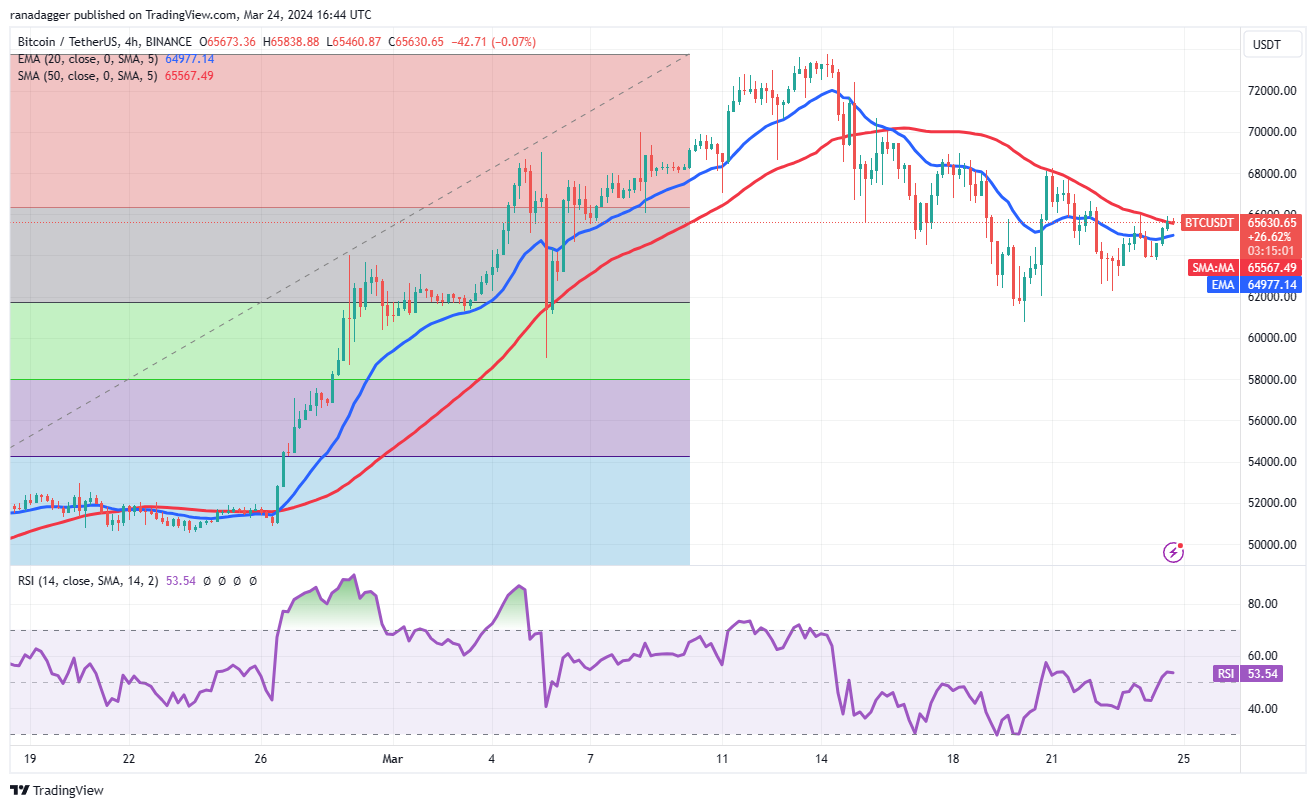
The 4-hour chart shows the bears are capping the relief rallies at the 50-SMA. Hence, this becomes an important level to watch out for. If bulls push the price above the 50-SMA, it will suggest that the bearish pressure could be reducing. The pair may then rise to $69,000, which is likely to act as a major hurdle.
4시간 차트는 하락세가 50-SMA에서 구호 집회를 마감하고 있음을 보여줍니다. 따라서 이는 주의해야 할 중요한 수준이 됩니다. 황소가 가격을 50-SMA 이상으로 올리면 약세 압력이 줄어들 수 있음을 시사합니다. 그러면 그 쌍은 $69,000까지 상승할 수 있는데, 이는 큰 장애물로 작용할 가능성이 높습니다.
The immediate support to watch on the downside is $62,260 and then $60,775. If bears sink the price below this support zone, the selling could pick up, and the pair may slide to $59,000.
하락세를 관찰할 수 있는 즉각적인 지지선은 $62,260이고 그 다음에는 $60,775입니다. 하락세가 이 지지대 아래로 가격이 하락하면 매도세가 상승할 수 있으며 가격은 $59,000까지 하락할 수 있습니다.
Dogecoin price analysis
도지코인 가격 분석
Dogecoin (DOGE) has been range-bound between $0.12 and $0.19 for the past few days. The bulls cleared the $0.16 hurdle on March 24, opening the doors for a rise to $0.19.
Dogecoin(DOGE)은 지난 며칠 동안 0.12달러에서 0.19달러 사이의 범위를 유지했습니다. 상승세는 3월 24일에 0.16달러 장애물을 통과하여 0.19달러 상승의 문을 열었습니다.
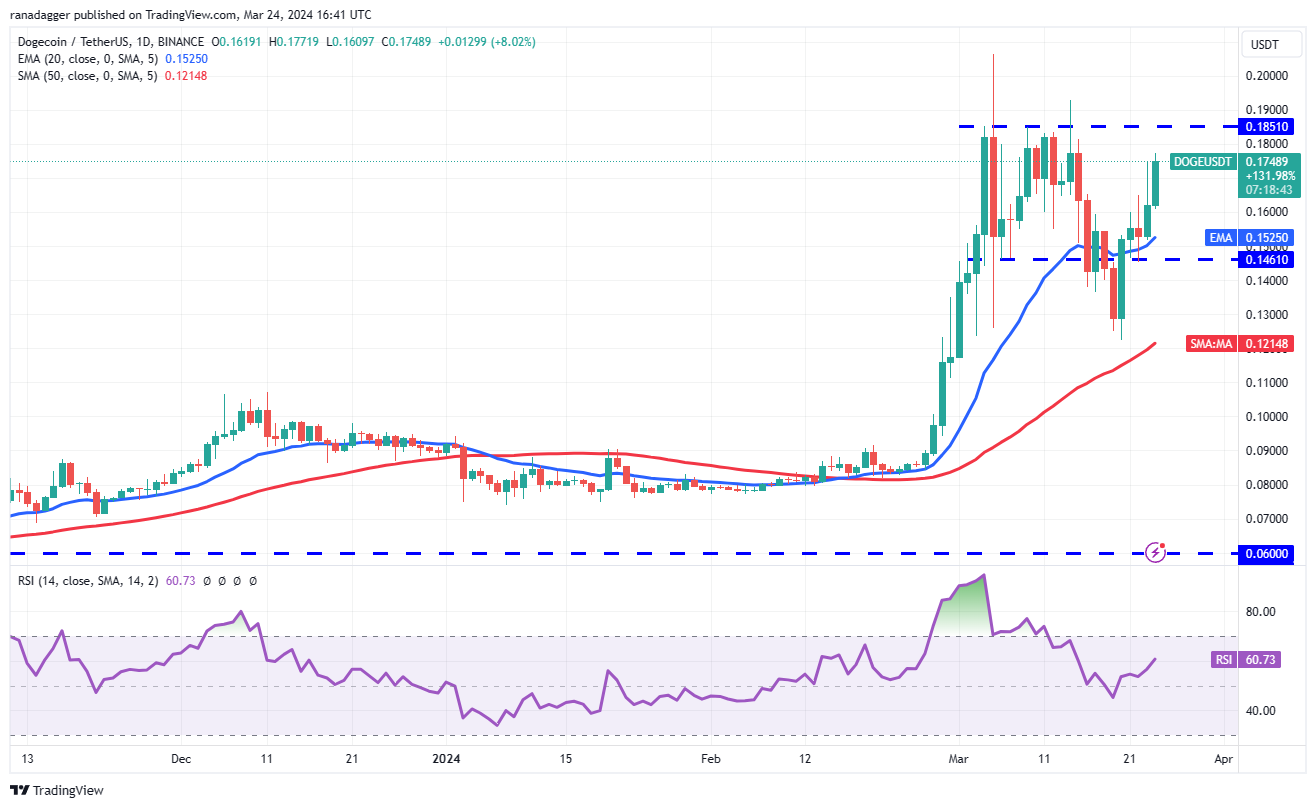
The 20-day EMA ($0.15) has started to turn up, and the RSI is in positive territory, indicating that the bulls are attempting a comeback. A break and close above $0.19 could start the journey toward $0.23 and later $0.30.
20일 EMA($0.15)가 상승하기 시작했고 RSI가 플러스 영역에 있어 상승세가 회복을 시도하고 있음을 나타냅니다. $0.19를 초과하는 중단 및 마감은 $0.23 및 이후 $0.30을 향한 여정을 시작할 수 있습니다.
Instead, if the price turns down sharply from $0.19, it will suggest that the bears remain active at higher levels. The DOGE/USDT pair could slide toward the solid support at $0.12. The bears will have to sink the price below the 50-day SMA ($0.12) to indicate that the uptrend could be over.
대신 가격이 0.19달러에서 급격히 하락하면 하락세는 더 높은 수준에서 계속 활발하게 활동한다는 의미입니다. DOGE/USDT 쌍은 $0.12의 견고한 지지선을 향해 미끄러질 수 있습니다. 하락세는 상승 추세가 끝났음을 나타내기 위해 가격을 50일 SMA($0.12) 아래로 내려야 합니다.
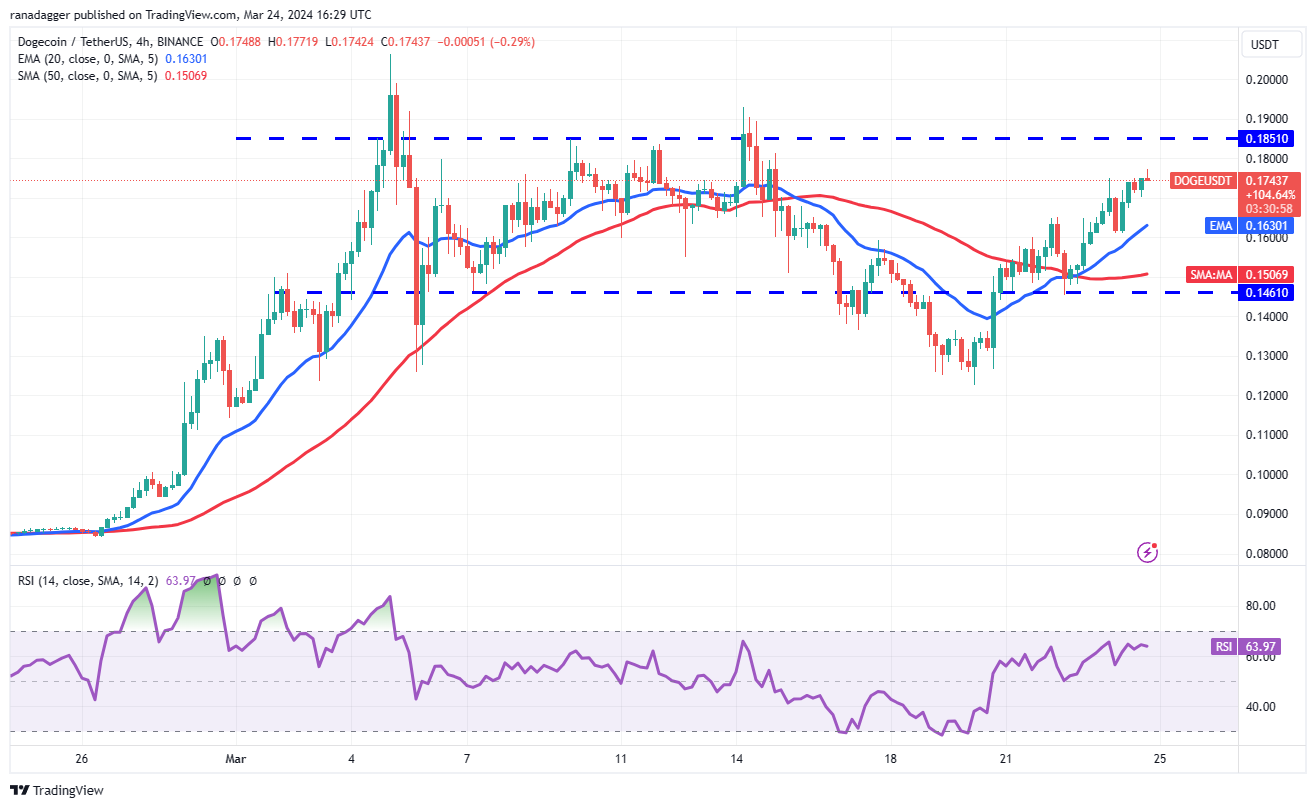
The 4-hour chart shows that the bulls are buying the dips to the 20-EMA, indicating a positive sentiment. Buyers will try to push the price to the overhead resistance of $0.19, where the bears may again mount a strong defense. If bulls do not cede ground to the bears from $0.19, the likelihood of a rally above $0.20 increases.
4시간 차트를 보면 상승세가 20-EMA 하락세를 매수하고 있어 긍정적인 심리를 나타냅니다. 구매자는 가격을 0.19달러의 저항선까지 끌어올리려고 노력할 것이며, 하락세가 다시 강력한 방어력을 발휘할 수 있습니다. 강세장이 $0.19에서 약세에게 양보하지 않으면 $0.20 이상으로 상승할 가능성이 높아집니다.
The first sign of weakness will be a break and close below the 20-EMA. That may open the doors for a fall to $0.14.
약세의 첫 번째 징후는 20-EMA 아래에서 돌파 및 종가가 될 것입니다. 이는 $0.14까지 하락할 수 있는 문을 열 수 있습니다.
Toncoin price analysis
톤코인 가격 분석
Toncoin (TON) surged above the $4.60 resistance on March 23, indicating the start of the next leg of the uptrend.
톤코인(TON)은 3월 23일 저항선인 4.60달러 위로 급등하며 다음 상승 추세의 시작을 알렸습니다.
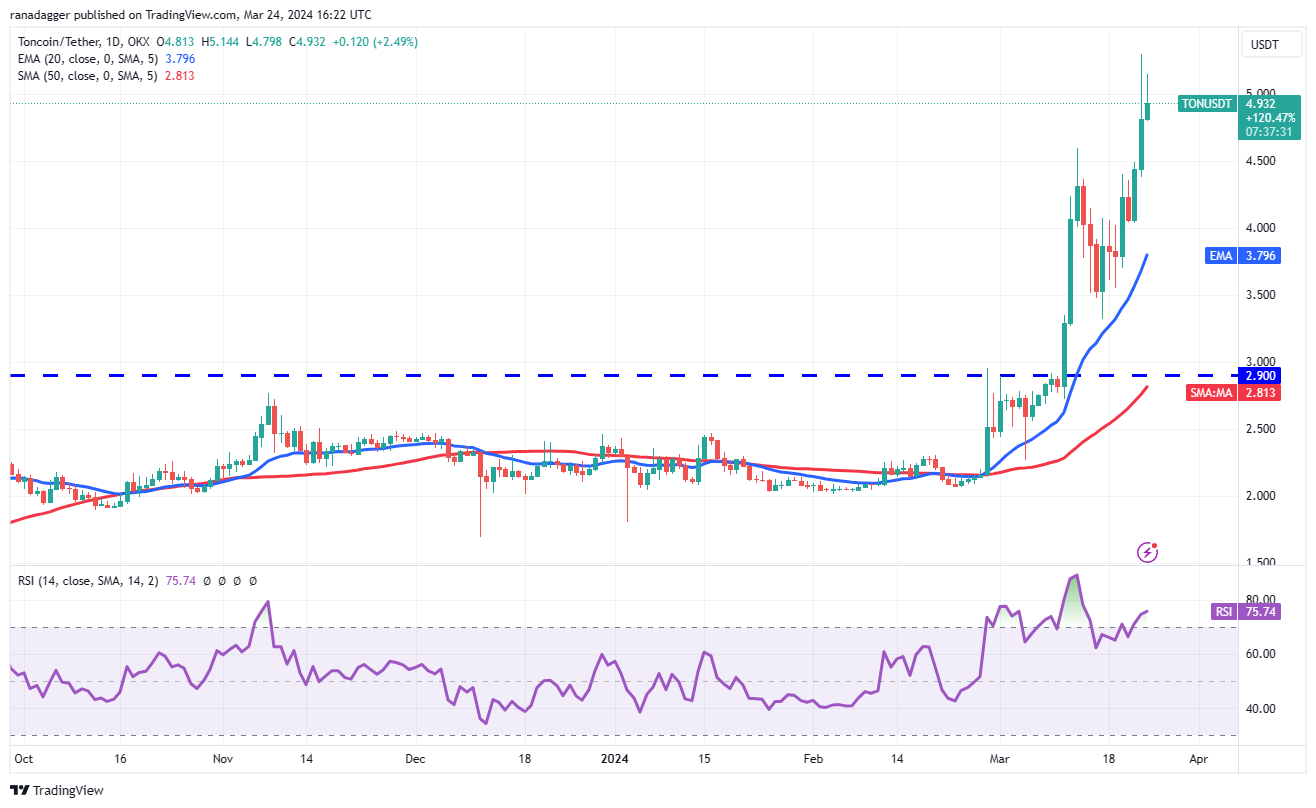
The upsloping moving averages and the RSI in the overbought zone signal that buyers are in command. The long wick on the March 23 and 24 candlesticks shows profit booking above $5, but if the bulls do not give up much ground from the current level, the TON/USDT pair could extend the rally to $5.64.
상승하는 이동평균선과 과매수 구간의 RSI는 매수자가 지배하고 있다는 신호입니다. 3월 23일과 24일 캔들스틱의 긴 심지는 5달러 이상의 이익 예약을 보여주지만, 강세장이 현재 수준에서 큰 폭을 포기하지 않는다면 TON/USDT 쌍은 랠리를 5.64달러까지 연장할 수 있습니다.
If bears want to prevent the upside, they will have to drag and sustain the price below $4.60. That may tempt short-term traders to book profits, pulling the pair to the 20-day EMA ($3.79).
하락세가 상승을 막고 싶다면 가격을 $4.60 아래로 끌고 유지해야 합니다. 이는 단기 거래자들이 이익을 기록하도록 유혹하여 해당 쌍을 20일 EMA($3.79)로 끌어올릴 수 있습니다.
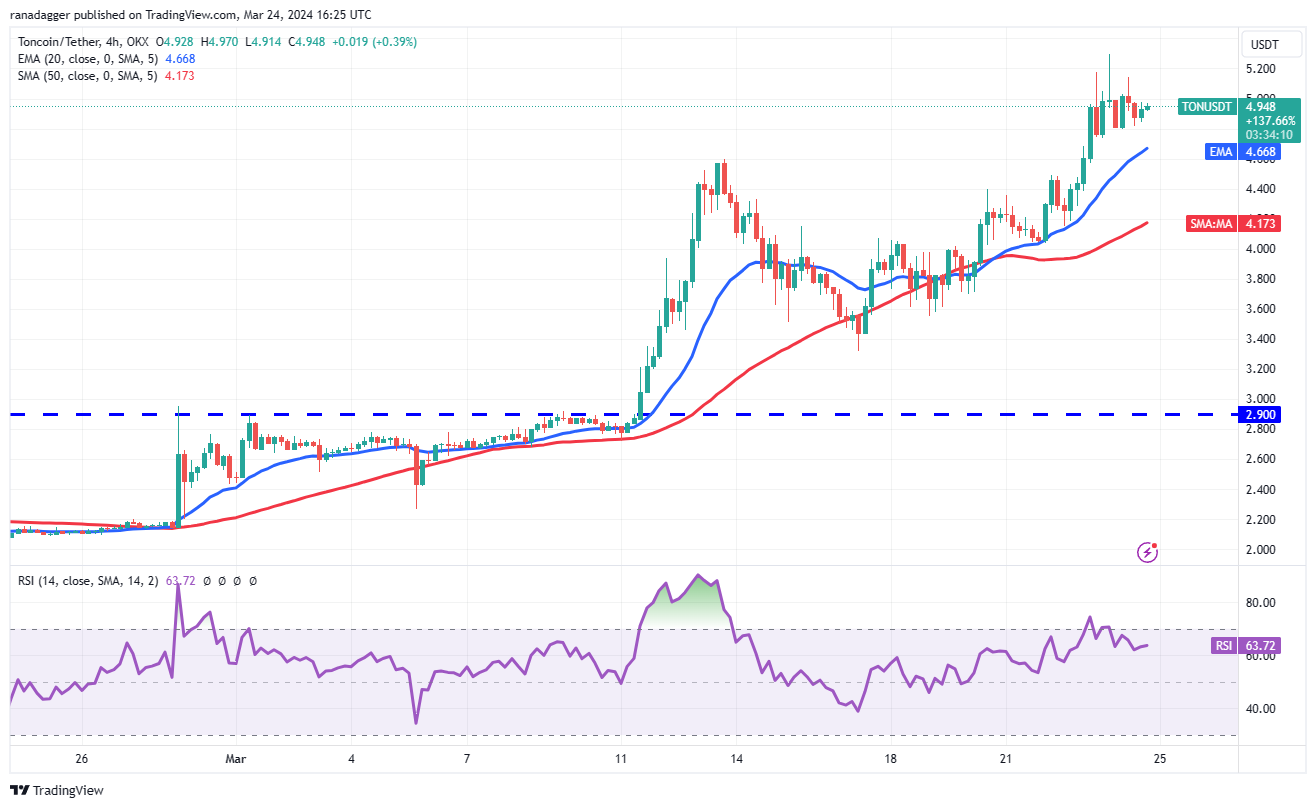
The 4-hour chart shows that the bears are aggressively defending the $5 resistance, but have failed to sink the pair below the 20-EMA. This is a positive sign as it suggests that the traders are holding to their positions as they anticipate another leg higher.
4시간 차트를 보면 하락세가 5달러 저항선을 적극적으로 방어하고 있지만 20-EMA 아래로 하락하는 데 실패했음을 알 수 있습니다. 이는 거래자들이 한 단계 더 높은 상승을 기대하면서 포지션을 유지하고 있음을 시사하는 긍정적인 신호입니다.
The first support on the downside is the 20-EMA. A slide below this support will suggest that the short-term traders may be booking profits. That could pull the price to the 50-SMA and later to $3.50.
아래쪽에 대한 첫 번째 지원은 20-EMA입니다. 이 지원 아래의 슬라이드는 단기 거래자가 이익을 얻을 수 있음을 시사합니다. 그러면 가격이 50-SMA로, 나중에는 3.50달러로 끌어올릴 수 있습니다.
Related: Terra founder Do Kwon released in Montenegro
관련 항목: 테라 창업자 도권 몬테네그로에서 석방
Stacks price analysis
스택 가격 분석
The bulls propelled Stacks (STX) above the $3.40 overhead resistance on March 20, indicating that the uptrend remains intact.
상승세는 3월 20일 Stacks(STX)를 오버헤드 저항인 $3.40 이상으로 끌어올려 상승 추세가 그대로 유지되었음을 나타냅니다.
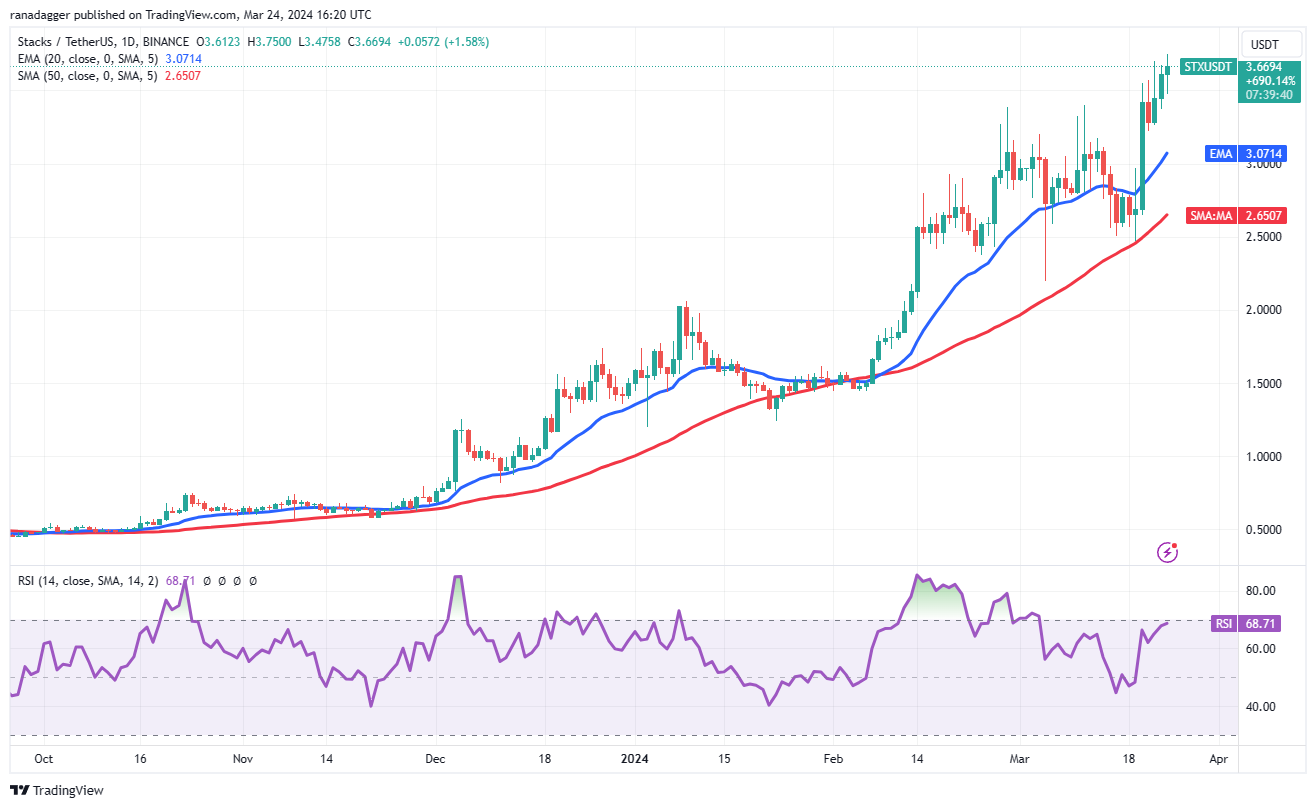
Both moving averages are sloping up, and the RSI is near the overbought zone, indicating that bulls have an advantage. If buyers maintain the price above $3.40, the uptrend is likely to pick up momentum, and the STX/USDT pair could rally to $4.29.
두 이동 평균 모두 상승하고 있으며 RSI는 과매수 영역 근처에 있어 황소가 유리하다는 것을 나타냅니다. 구매자가 가격을 $3.40 이상으로 유지한다면 상승 추세는 탄력을 받을 가능성이 높으며 STX/USDT 쌍은 $4.29까지 상승할 수 있습니다.
Contrary to this assumption, if the price turns down and skids below $3.40, it will signal that the markets have rejected the higher levels. The pair may slump to the 20-day EMA ($3.07). A bounce off this level will suggest that the uptrend remains intact, but a break below the 20-day EMA could sink the pair to the 50-day SMA ($2.65).
이 가정과는 반대로 가격이 하락하고 $3.40 아래로 미끄러지면 시장이 더 높은 수준을 거부했다는 신호가 됩니다. 20일 EMA($3.07)까지 하락할 수 있습니다. 이 수준에서 반등하면 상승 추세가 그대로 유지되지만 20일 EMA를 하향 돌파하면 50일 SMA($2.65)까지 하락할 수 있습니다.
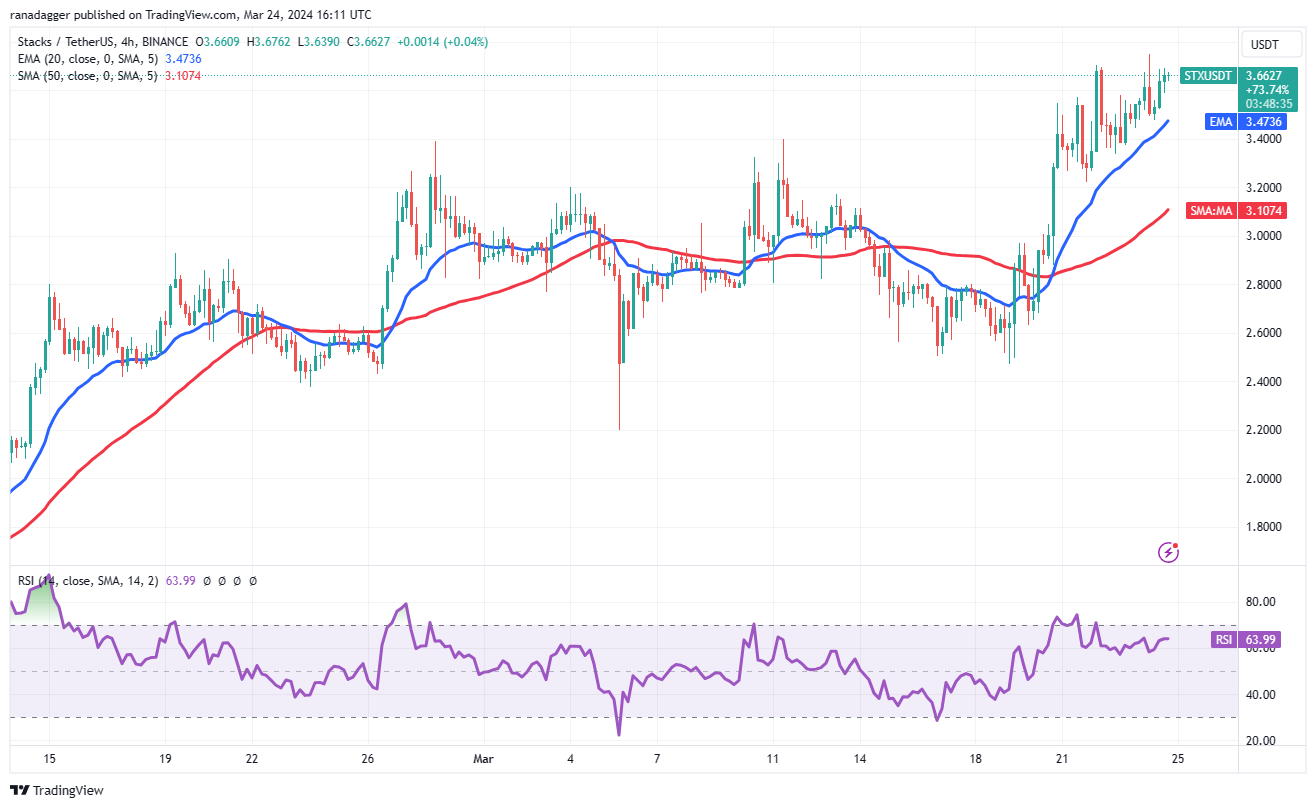
The 4-hour chart shows that the bulls are buying the dips to the 20-EMA, signaling that the sentiment remains positive. There is a minor resistance at $3.75, but if this level is crossed, the pair may reach $4.
4시간 차트를 보면 강세론자들이 20-EMA까지 하락세를 매수하고 있음을 알 수 있으며 이는 정서가 여전히 긍정적임을 나타냅니다. $3.75에 약간의 저항이 있지만 이 수준을 넘으면 $4에 도달할 수 있습니다.
The crucial support to watch on the downside is the 20-EMA. If this level gives way, it will suggest that the bulls are rushing to the exit. The pair may then drop to $3.22. A break below this support could accelerate selling and sink the pair below the 50-SMA.
하락세에서 주목해야 할 중요한 지지선은 20-EMA입니다. 이 수준이 무너지면 황소가 출구로 돌진하고 있음을 시사합니다. 그러면 그 쌍은 $3.22까지 떨어질 수 있습니다. 이 지지선 아래로 떨어지면 매도가 가속화되고 50-SMA 아래로 하락할 수 있습니다.
Fantom price analysis
팬텀 가격 분석
Fantom’s (FTM) long wick on the March 22 candlestick shows profit booking near $1.23. The selling accelerated on March 23, and the bears are attempting to sink the price below $1.02.
3월 22일 촛대에 있는 Fantom(FTM)의 긴 심지는 $1.23 근처의 이익 예약을 보여줍니다. 매도는 3월 23일에 가속화되었고 하락세는 가격을 1.02달러 아래로 낮추려고 시도하고 있습니다.
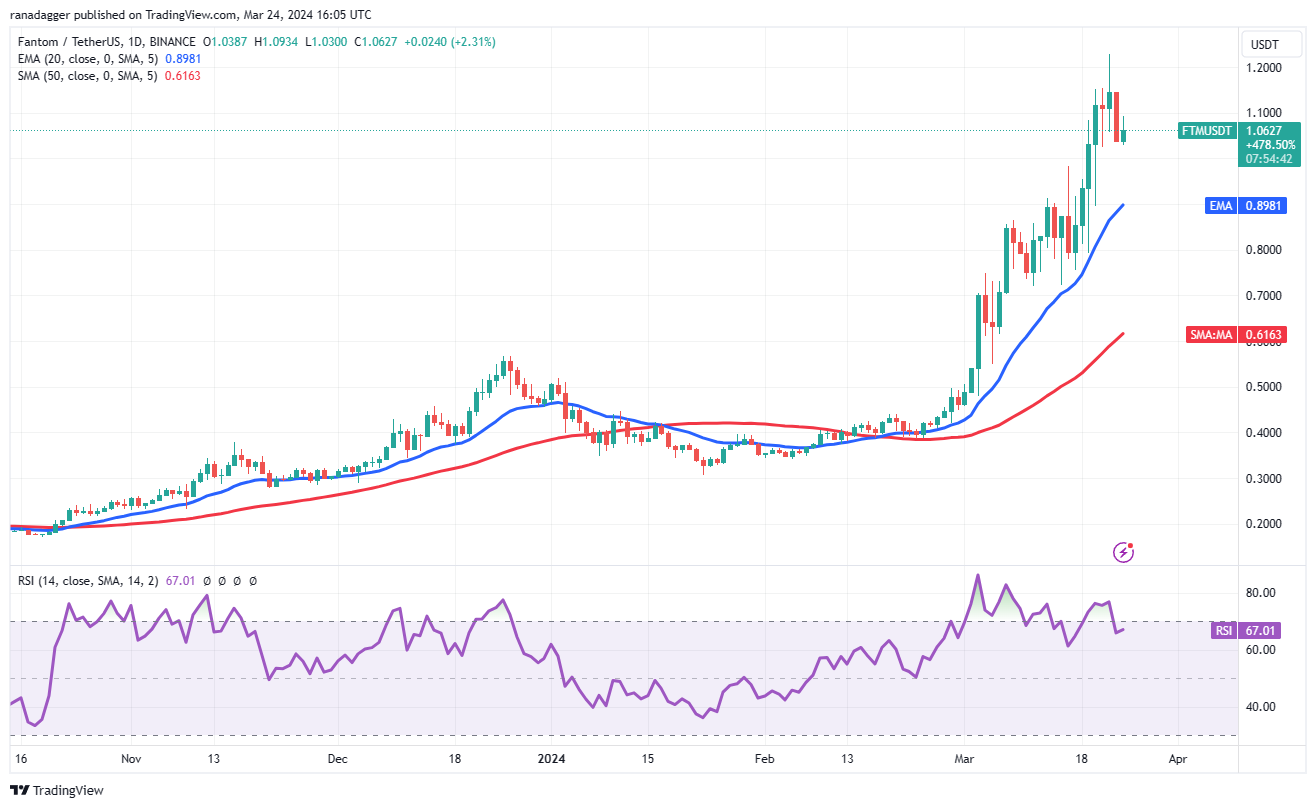
If they succeed, the FTM/USDT pair could tumble to the 20-day EMA ($0.89). This remains the key short-term level to watch out for. If the price rebounds off the 20-day EMA with strength, it will signal that lower levels continue to attract buyers. The pair may then retest the $1.23 level. A break above it could clear the path for a rally to $1.50 and eventually to $2.
성공하면 FTM/USDT 쌍은 20일 EMA($0.89)로 하락할 수 있습니다. 이는 단기적으로 주의해야 할 핵심 수준으로 남아 있습니다. 가격이 20일 EMA에서 강세를 보이며 반등한다면 낮은 수준이 계속해서 구매자를 끌어들이고 있다는 신호가 될 것입니다. 그런 다음 쌍은 $1.23 수준을 다시 테스트할 수 있습니다. 그 이상으로 돌파하면 1.50달러, 결국 2달러까지 상승할 수 있는 경로가 확보될 수 있습니다.
This optimistic view will be negated in the near term if the price turns down sharply and plummets below the 20-day EMA. That could tug the price to the next significant support at $0.72.
가격이 급격히 하락하고 20일 EMA 아래로 급락한다면 이러한 낙관적인 견해는 단기적으로 무효화될 것입니다. 이는 $0.72의 다음 중요한 지지선까지 가격을 끌어올 수 있습니다.
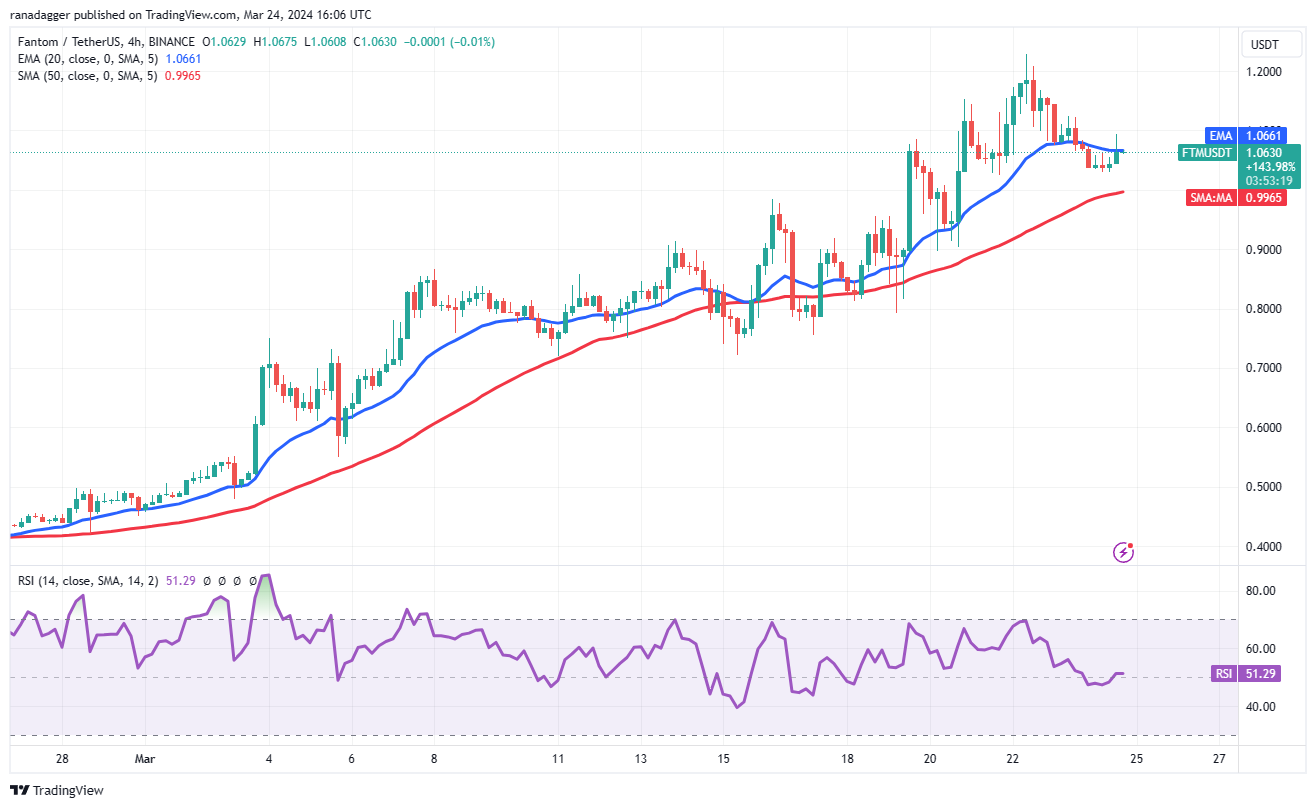
The bears pulled the price below the 20-EMA on the 4-hour chart, but a positive sign is that the bulls have not allowed the 50-SMA to be challenged. Buyers are trying to push the price back above the 20-EMA. If they manage to do that, the pair could rise to $1.12 and then to $1.16.
하락세는 4시간 차트에서 가격을 20-EMA 아래로 끌어내렸지만 상승세가 50-SMA에 도전하는 것을 허용하지 않았다는 점은 긍정적인 신호입니다. 구매자들은 가격을 20-EMA 이상으로 되돌리려고 노력하고 있습니다. 만약 그렇게 한다면 그 쌍은 $1.12까지 상승한 다음 $1.16까지 상승할 수 있습니다.
Alternatively, if the price turns down from the overhead resistance and breaks below the 50-SMA, it will suggest that the bears are aggressively selling at higher levels. The pair may then start a downward move to $0.80.
또는 가격이 오버헤드 저항에서 하락하여 50-SMA 아래로 떨어지면 하락세가 더 높은 수준에서 공격적으로 매도하고 있음을 의미합니다. 그러면 해당 쌍은 $0.80까지 하락세를 시작할 수 있습니다.
This article does not contain investment advice or recommendations. Every investment and trading move involves risk, and readers should conduct their own research when making a decision.
이 글에는 투자 조언이나 추천이 포함되어 있지 않습니다. 모든 투자 및 거래 활동에는 위험이 수반되므로 독자는 결정을 내릴 때 스스로 조사해야 합니다.
 Crypto Daily™
 Crypto Daily™
 DogeHome
 TheCoinrise Media
 Thecoinrepublic.com
 TheCoinrise Media
 TheCoinrise Media
 Cryptopolitan_News


