

Bitcoin (BTC) is on target to end the week in the red, but a positive sign for the bulls is that the price has recovered from the intra-week low of about $61,000 to over $65,000. This shows that traders remain long-term bullish and are buying the dips.
ビットコイン(BTC)は赤字で週を終えることを目標にしているが、強気派にとって明るい兆しは、価格が週内安値の約6万1000ドルから6万5000ドル以上まで回復したことだ。これはトレーダーが長期的に強気を維持し、押し目買いをしていることを示している。
CryptoQuant CEO Ki Young Ju expects inflows into spot Bitcoin exchange-traded funds (ETFs) to increase if Bitcoin nears support levels. Young Ju said the new Bitcoin whales, who purchased Bitcoin ETFs, have an on-chain cost basis of $56,000. He anticipates buying to pick up if Bitcoin’s price reaches $56,000.
クリプトクアントのキ・ヨンジュ最高経営責任者(CEO)は、ビットコインがサポートレベルに近づいた場合、スポットビットコイン上場投資信託(ETF)への流入が増加すると予想している。 Young Ju氏は、ビットコインETFを購入した新たなビットコインクジラのオンチェーンコストベースは5万6000ドルだと述べた。同氏は、ビットコインの価格が5万6000ドルに達すれば、買いが回復すると予想している。
Another positive sign that could support Bitcoin’s price is that outflows from the Grayscale Bitcoin Trust (GBTC) are slowing down. According to Fairside Investors data, the outflows from GBTC dropped to just $170 million on March 22. This suggests that the selling pressure could be reducing. If Bitcoin ends March above $61,130, it would be the first-ever seven-month winning streak.
ビットコイン価格を支える可能性のあるもう一つの明るい兆候は、グレースケール・ビットコイン・トラスト(GBTC)からの流出が減速していることだ。フェアサイド・インベスターズのデータによると、GBTCからの流出額は3月22日にわずか1億7000万ドルに減少した。これは、売り圧力が減少している可能性があることを示唆している。ビットコインが3月の終値が6万1130ドルを超えれば、史上初の7カ月連続勝利となる。
Could a recovery in Bitcoin trigger buying in select altcoins? Let’s look at the top 5 cryptocurrencies that look strong on the charts.
ビットコインの回復が一部のアルトコインの購入を引き起こす可能性はあるでしょうか?チャートで好調に見える上位 5 つの仮想通貨を見てみましょう。
Bitcoin price analysis
ビットコイン価格分析
Bitcoin has been trading near the 20-day exponential moving average ($65,364) for the past few days, indicating a battle between the bulls and the bears for supremacy.
ビットコインはここ数日間、20日指数移動平均(6万5364ドル)付近で取引されており、強気派と弱気派の間で覇権を争っていることを示している。
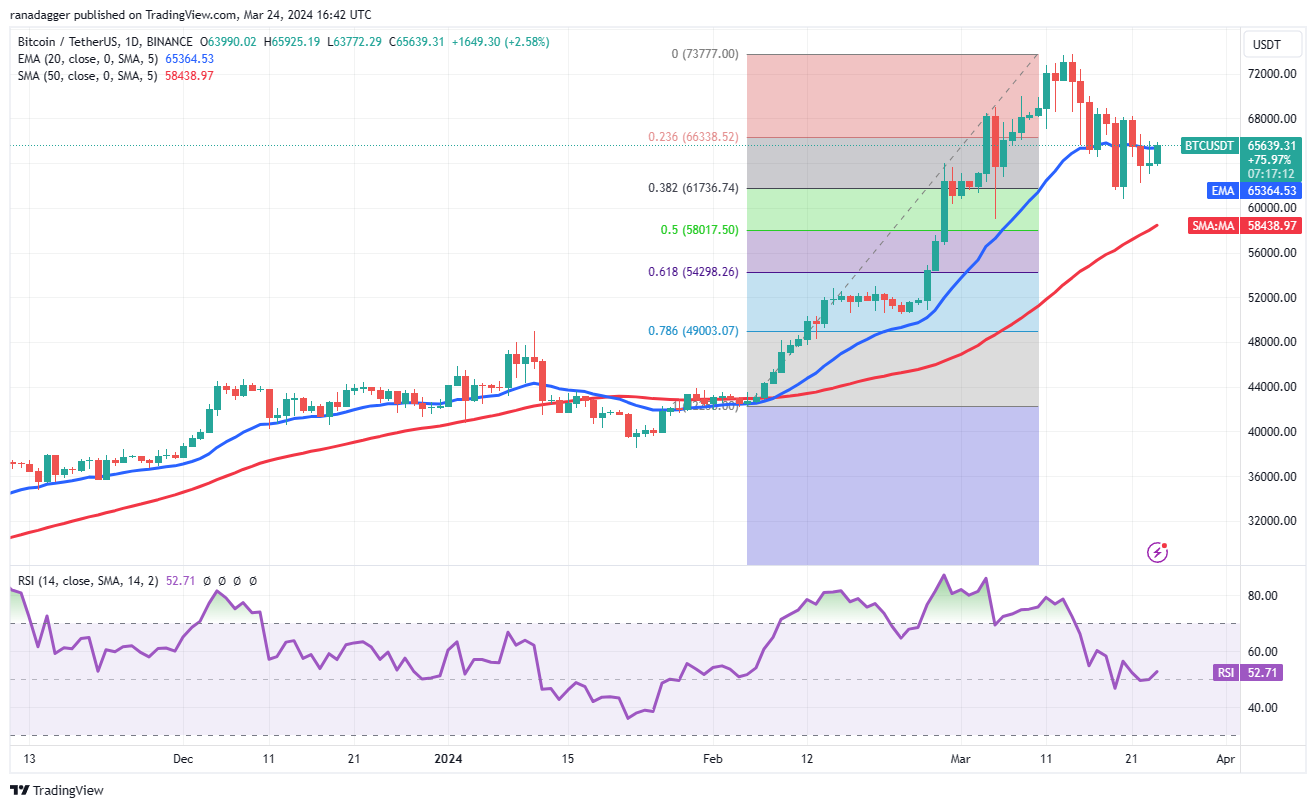
The 20-day EMA is gradually flattening out, and the relative strength index (RSI) is near the midpoint, indicating a balance between supply and demand. The BTC/USDT pair could swing between $60,775 and $69,000 in the near term.
20 日間 EMA は徐々に平坦化しており、相対力指数 (RSI) は中間点付近にあり、需要と供給のバランスが取れていることを示しています。 BTC/USDT ペアは短期的には 60,775 ドルから 69,000 ドルの間で変動する可能性があります。
If the price remains below the 20-day EMA, the support zone between the 50-day simple moving average ($58,438) and $60,775 may come under pressure. If this zone cracks, the correction could deepen to the 61.8% Fibonacci retracement level of $54,298.
価格が20日EMAを下回ったままの場合、50日単純移動平均(58,438ドル)と60,775ドルの間のサポートゾーンに圧力がかかる可能性があります。このゾーンに亀裂が入った場合、調整は61.8%のフィボナッチ・リトレースメント水準である54,298ドルまで深まる可能性がある。
On the upside, a break and close above $69,000 could open the doors for a retest of $73,777. If this resistance is scaled, the pair may ascend to $80,000.
上向きの場合、69,000ドルを超えてブレイクして終了すると、73,777ドルの再テストへの扉が開く可能性があります。この抵抗が拡大されると、ペアは80,000ドルに上昇する可能性があります。
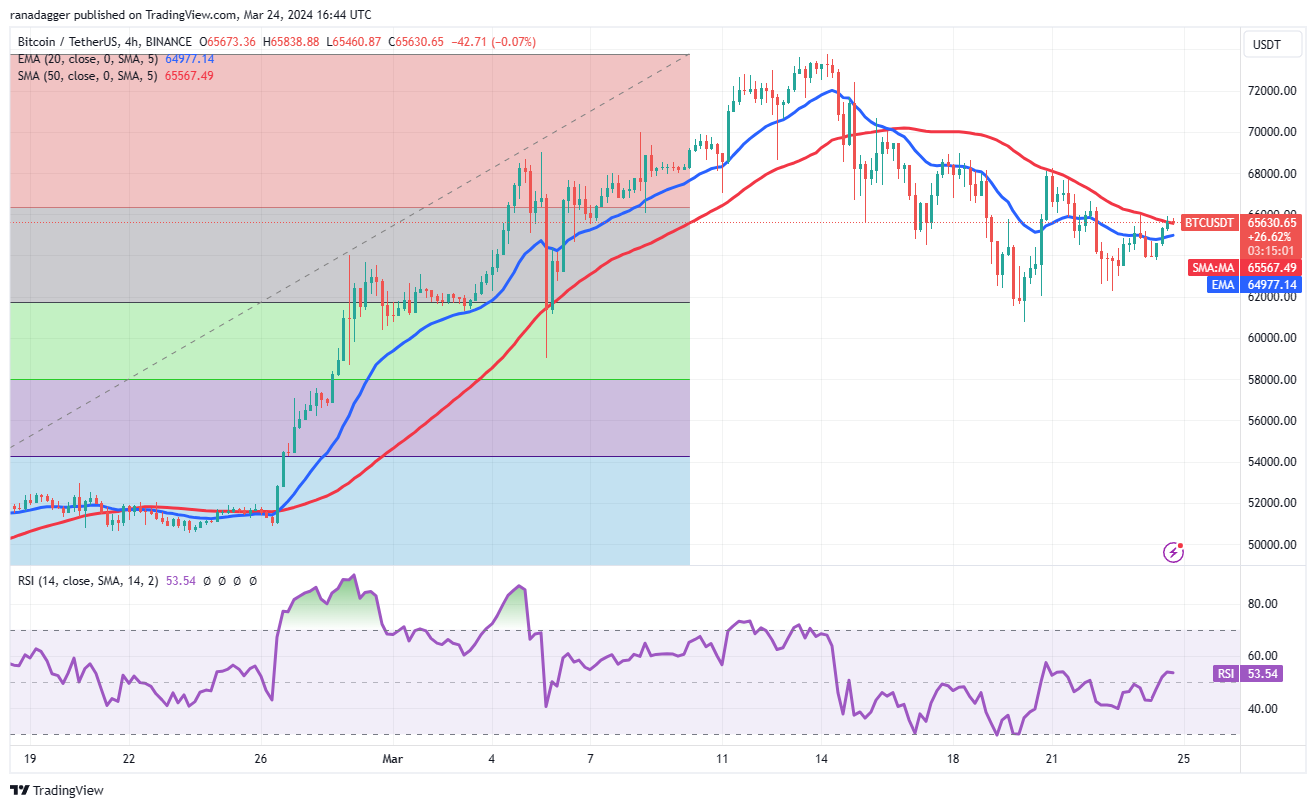
The 4-hour chart shows the bears are capping the relief rallies at the 50-SMA. Hence, this becomes an important level to watch out for. If bulls push the price above the 50-SMA, it will suggest that the bearish pressure could be reducing. The pair may then rise to $69,000, which is likely to act as a major hurdle.
4時間足チャートは、弱気派が50-SMAでの救済集会を抑えていることを示している。したがって、これは注意すべき重要なレベルになります。強気派が価格を50-SMAを超えて押し上げれば、弱気圧力が低下している可能性があることを示唆することになる。その後、ペアは69,000ドルまで上昇する可能性があり、これが大きなハードルとなる可能性があります。
The immediate support to watch on the downside is $62,260 and then $60,775. If bears sink the price below this support zone, the selling could pick up, and the pair may slide to $59,000.
下値で注目すべき当面のサポートは62,260ドル、その後は60,775ドルです。弱気派が価格をこのサポートゾーン以下に下げた場合、売りが加速し、価格は59,000ドルまで下落する可能性がある。
Dogecoin price analysis
ドージコインの価格分析
Dogecoin (DOGE) has been range-bound between $0.12 and $0.19 for the past few days. The bulls cleared the $0.16 hurdle on March 24, opening the doors for a rise to $0.19.
ドージコイン(DOGE)は過去数日間、0.12ドルから0.19ドルの範囲内で推移している。強気派は3月24日に0.16ドルのハードルを突破し、0.19ドルへの上昇への扉を開いた。
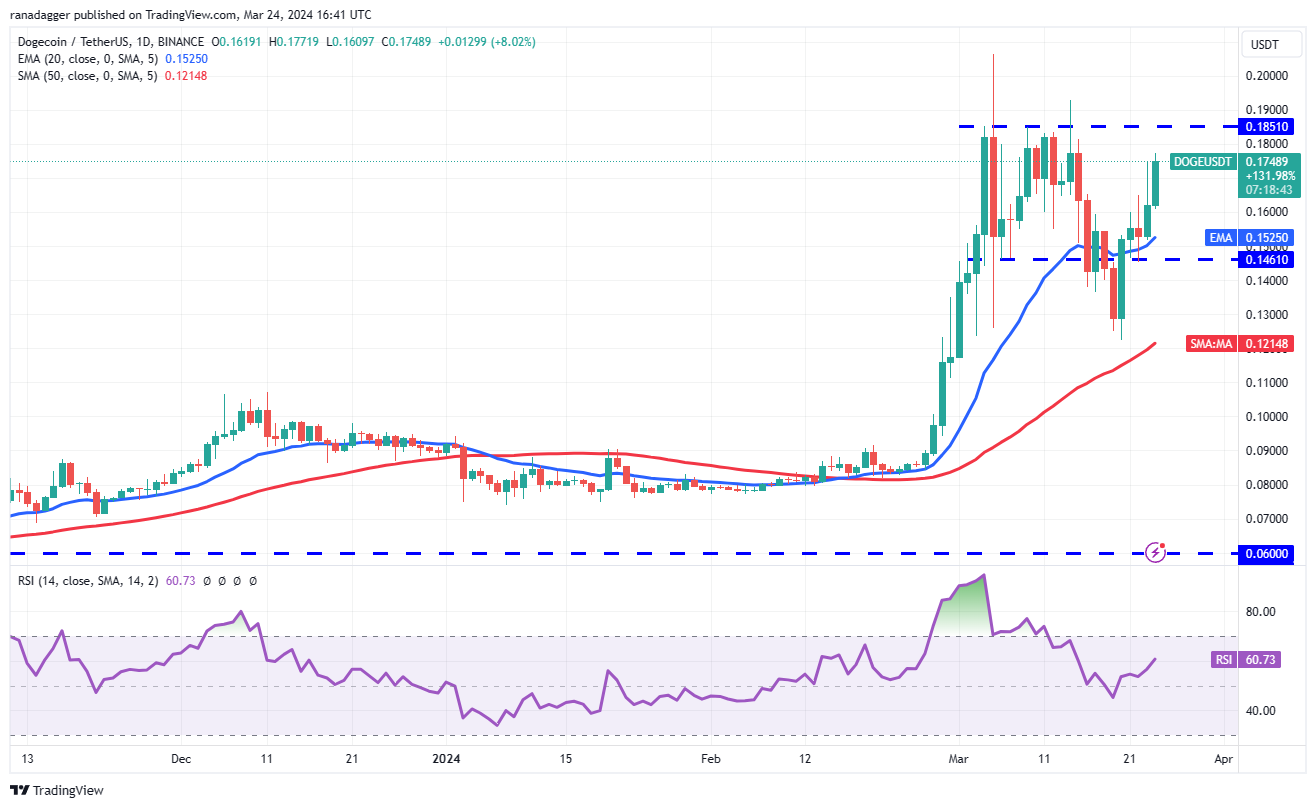
The 20-day EMA ($0.15) has started to turn up, and the RSI is in positive territory, indicating that the bulls are attempting a comeback. A break and close above $0.19 could start the journey toward $0.23 and later $0.30.
20日間EMA(0.15ドル)は上昇に転じ始め、RSIはプラス圏にあり、強気派が巻き返しを図っていることを示している。 0.19ドルを超えてブレイクおよびクローズすると、0.23ドル、その後は0.30ドルに向かう旅が始まる可能性があります。
Instead, if the price turns down sharply from $0.19, it will suggest that the bears remain active at higher levels. The DOGE/USDT pair could slide toward the solid support at $0.12. The bears will have to sink the price below the 50-day SMA ($0.12) to indicate that the uptrend could be over.
むしろ、価格が0.19ドルから急激に下落した場合は、弱気派が高水準で引き続き活発であることを示唆するだろう。 DOGE/USDTペアは0.12ドルの堅調なサポートに向けて下落する可能性がある。弱気派は上昇トレンドが終わった可能性を示すために、価格を50日間SMA(0.12ドル)以下に下げる必要があるだろう。
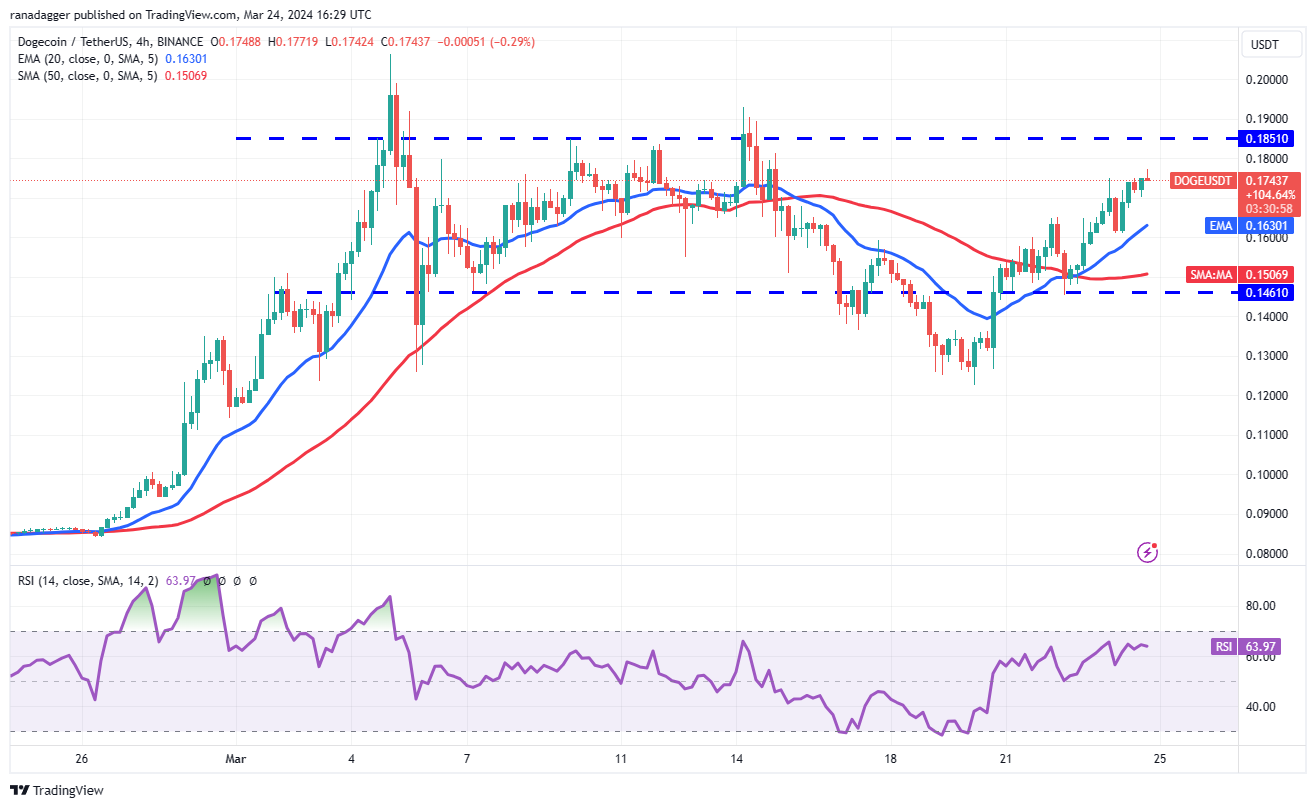
The 4-hour chart shows that the bulls are buying the dips to the 20-EMA, indicating a positive sentiment. Buyers will try to push the price to the overhead resistance of $0.19, where the bears may again mount a strong defense. If bulls do not cede ground to the bears from $0.19, the likelihood of a rally above $0.20 increases.
4時間足チャートは強気派が20-EMAまでの押し目を買っていることを示しており、ポジティブなセンチメントを示している。買い手は価格を直上の抵抗線である0.19ドルまで押し上げようとするだろうが、そこでは弱気派が再び強力な防御策を講じる可能性がある。強気派が0.19ドルから弱気派に地位を譲らなければ、0.20ドルを超える上昇の可能性が高まる。
The first sign of weakness will be a break and close below the 20-EMA. That may open the doors for a fall to $0.14.
弱さの最初の兆候はブレイクし、20-EMAを下回って終了することです。これにより、0.14ドルへの下落の扉が開く可能性がある。
Toncoin price analysis
トンコイン価格分析
Toncoin (TON) surged above the $4.60 resistance on March 23, indicating the start of the next leg of the uptrend.
トンコイン(TON)は3月23日に4.60ドルの抵抗線を超えて急騰し、上昇トレンドの次の区間の始まりを示した。
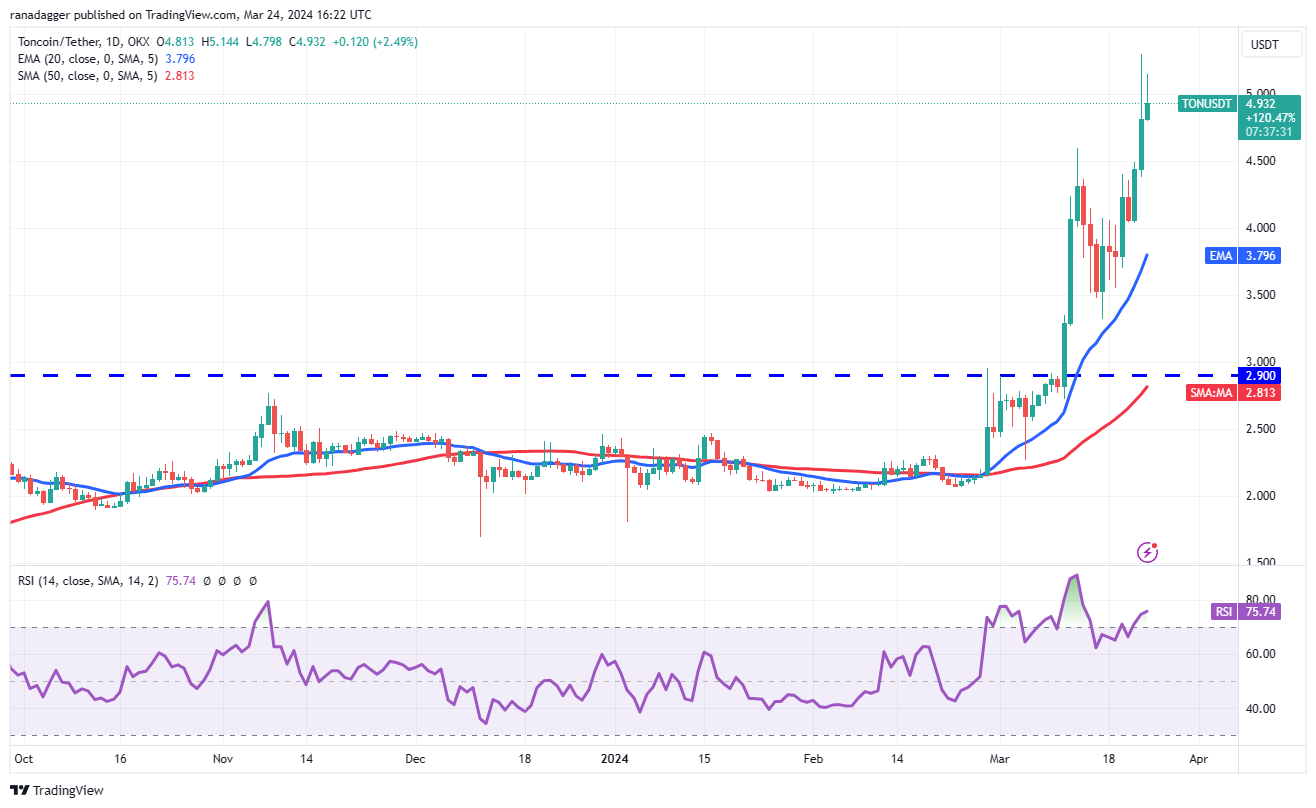
The upsloping moving averages and the RSI in the overbought zone signal that buyers are in command. The long wick on the March 23 and 24 candlesticks shows profit booking above $5, but if the bulls do not give up much ground from the current level, the TON/USDT pair could extend the rally to $5.64.
移動平均線の上昇と買われ過ぎゾーンの RSI は、買い手が主導権を握っていることを示しています。 3月23日と24日のローソク足の長い芯は5ドルを超える利益確定を示しているが、強気派が現在の水準から大きく譲歩しなければ、TON/USDTペアは上昇を5.64ドルまで延長する可能性がある。
If bears want to prevent the upside, they will have to drag and sustain the price below $4.60. That may tempt short-term traders to book profits, pulling the pair to the 20-day EMA ($3.79).
弱気派が上昇を阻止したい場合は、価格を4.60ドル以下に押し下げて維持する必要がある。これにより、短期トレーダーが利益を確保するよう誘惑され、通貨ペアが20日間EMA(3.79ドル)まで上昇する可能性がある。
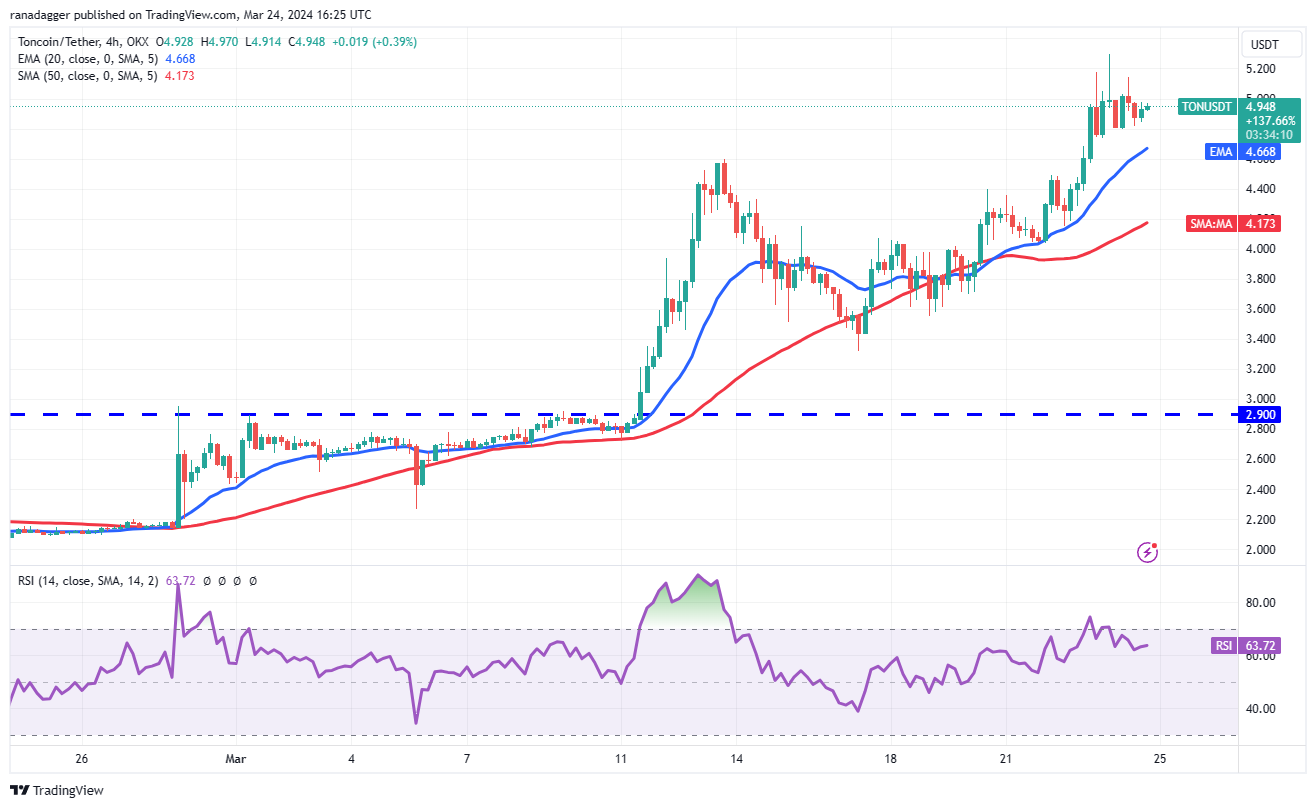
The 4-hour chart shows that the bears are aggressively defending the $5 resistance, but have failed to sink the pair below the 20-EMA. This is a positive sign as it suggests that the traders are holding to their positions as they anticipate another leg higher.
4時間足チャートは、弱気派が5ドルの抵抗線を積極的に守っているものの、20-EMA以下に下落させることができていないことを示している。これは、トレーダーがさらなる足の上昇を期待してポジションを維持していることを示唆しているため、明るい兆候です。
The first support on the downside is the 20-EMA. A slide below this support will suggest that the short-term traders may be booking profits. That could pull the price to the 50-SMA and later to $3.50.
下値の最初のサポートは20-EMAです。このサポートの下のスライドは、短期トレーダーが利益を確定している可能性があることを示唆しています。これにより、価格は50-SMAまで、さらにその後は3.50ドルまで上昇する可能性がある。
Related: Terra founder Do Kwon released in Montenegro
関連:Terra創設者ド・クォン氏がモンテネグロで釈放される
Stacks price analysis
スタック価格分析
The bulls propelled Stacks (STX) above the $3.40 overhead resistance on March 20, indicating that the uptrend remains intact.
強気派はスタックス(STX)を3月20日の3.40ドルの直上抵抗線を超えて押し上げ、上昇トレンドが維持されていることを示した。
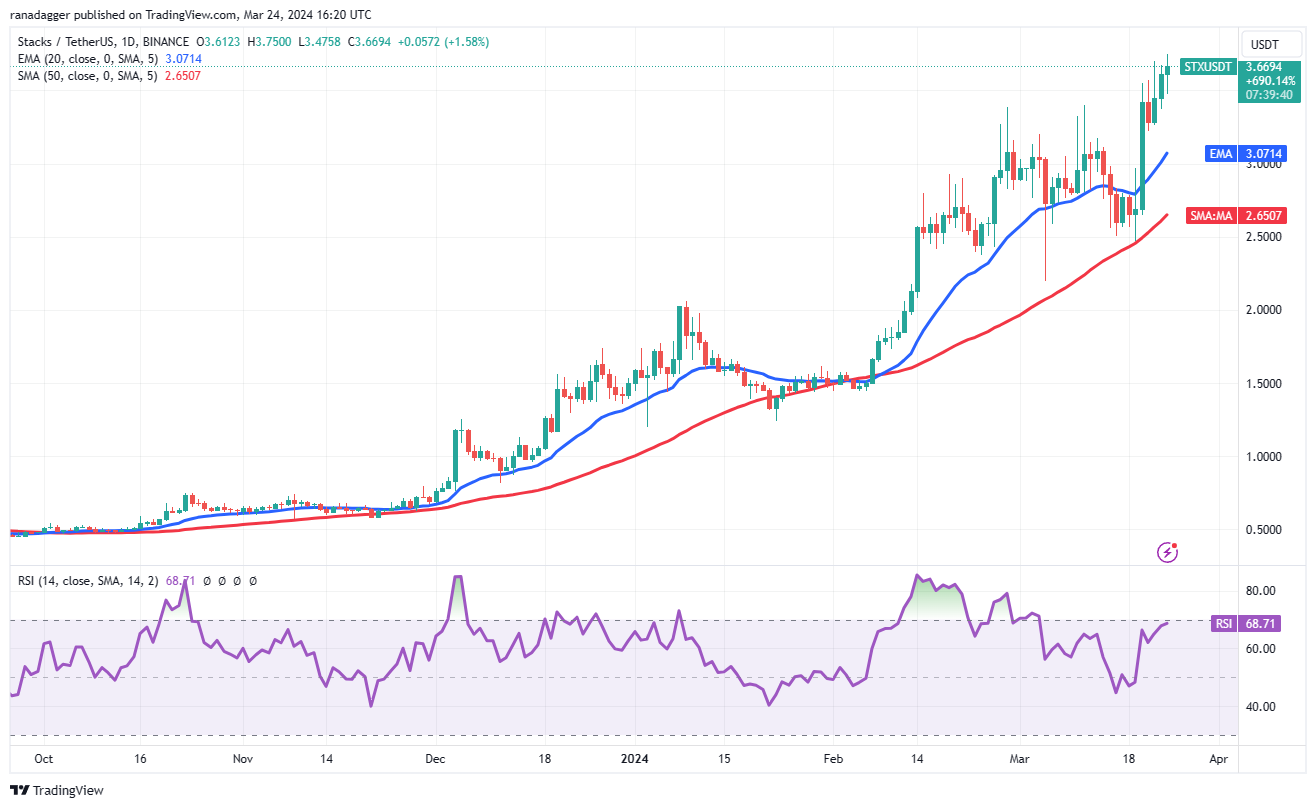
Both moving averages are sloping up, and the RSI is near the overbought zone, indicating that bulls have an advantage. If buyers maintain the price above $3.40, the uptrend is likely to pick up momentum, and the STX/USDT pair could rally to $4.29.
両方の移動平均は右肩上がりで、RSIは買われ過ぎゾーンに近く、強気派が有利であることを示しています。買い手が3.40ドルを超える価格を維持すれば、上昇トレンドは勢いを増し、STX/USDTペアは4.29ドルまで上昇する可能性がある。
Contrary to this assumption, if the price turns down and skids below $3.40, it will signal that the markets have rejected the higher levels. The pair may slump to the 20-day EMA ($3.07). A bounce off this level will suggest that the uptrend remains intact, but a break below the 20-day EMA could sink the pair to the 50-day SMA ($2.65).
この想定に反して、価格が下落して3.40ドルを下回った場合、それは市場がより高いレベルを拒否したことを示すことになります。ペアは20日間EMA(3.07ドル)まで下落する可能性がある。このレベルからの反発は、上昇トレンドが維持されていることを示唆しますが、20日間EMAを下回ると、ペアは50日間SMA(2.65ドル)に沈む可能性があります。
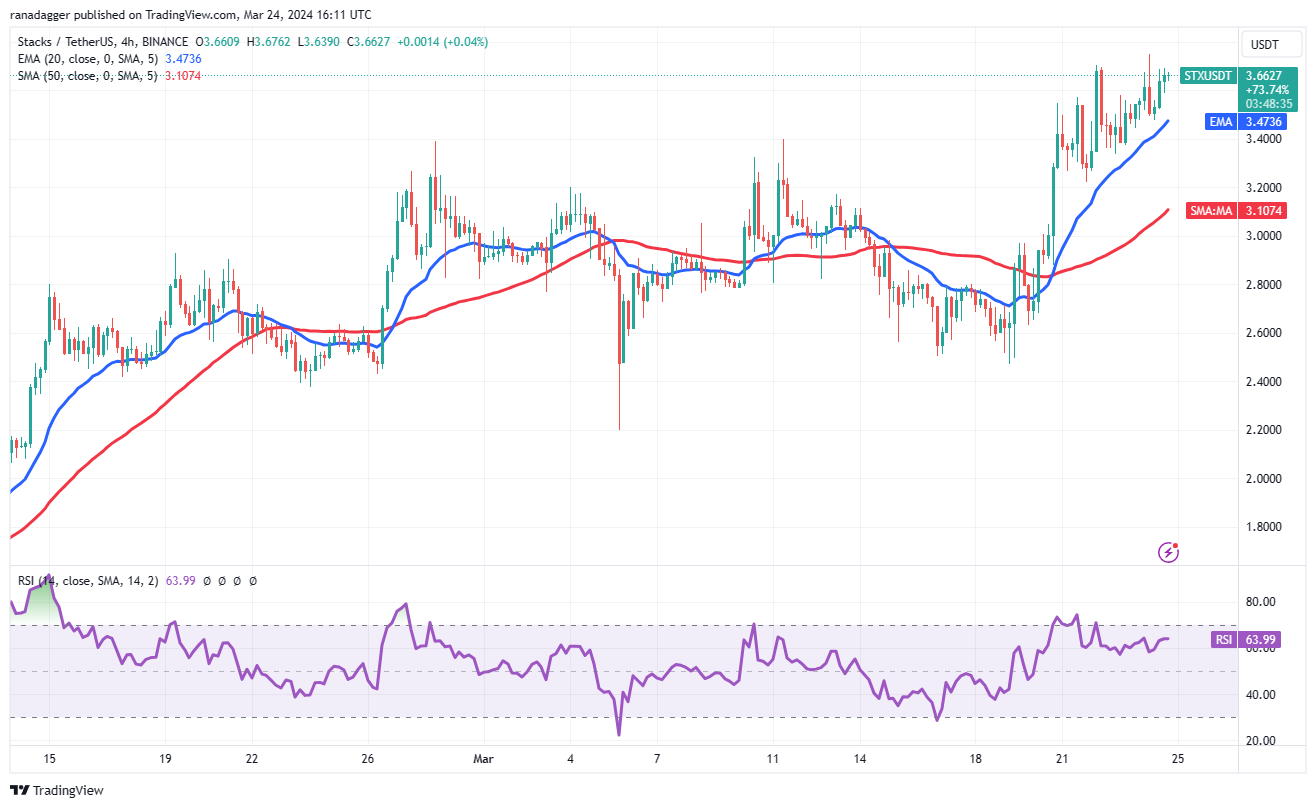
The 4-hour chart shows that the bulls are buying the dips to the 20-EMA, signaling that the sentiment remains positive. There is a minor resistance at $3.75, but if this level is crossed, the pair may reach $4.
4時間足チャートは、強気派が20-EMAまでの押し目を買っていることを示しており、地合いが引き続きポジティブであることを示している。 3.75ドルに小さな抵抗がありますが、このレベルを超えると、ペアは4ドルに達する可能性があります。
The crucial support to watch on the downside is the 20-EMA. If this level gives way, it will suggest that the bulls are rushing to the exit. The pair may then drop to $3.22. A break below this support could accelerate selling and sink the pair below the 50-SMA.
下値局面で注目すべき重要なサポートは20-EMAです。このレベルが崩れた場合、強気派が出口に急いでいることを示唆するでしょう。その後、ペアは3.22ドルまで下落する可能性がある。このサポートを下回ると売りが加速し、ペアが50-SMAを下回る可能性がある。
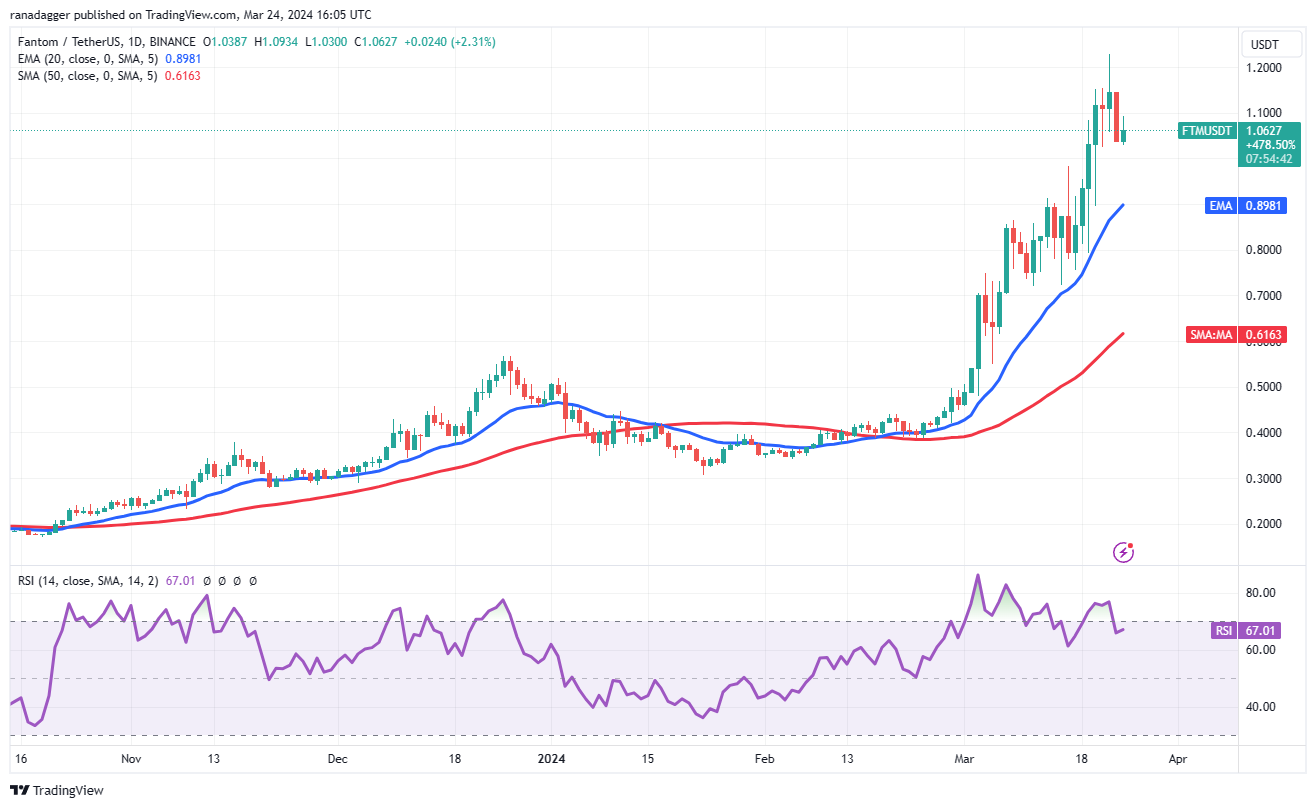
Fantom price analysis
Fantom価格分析
Fantom’s (FTM) long wick on the March 22 candlestick shows profit booking near $1.23. The selling accelerated on March 23, and the bears are attempting to sink the price below $1.02.
Fantom (FTM) の 3 月 22 日のローソク足の長い芯は、1.23 ドル付近での利益確定を示しています。 3月23日には売りが加速し、弱気派は価格を1.02ドル以下に引き下げようとしている。
If they succeed, the FTM/USDT pair could tumble to the 20-day EMA ($0.89). This remains the key short-term level to watch out for. If the price rebounds off the 20-day EMA with strength, it will signal that lower levels continue to attract buyers. The pair may then retest the $1.23 level. A break above it could clear the path for a rally to $1.50 and eventually to $2.
それが成功すれば、FTM/USDTペアは20日間EMA(0.89ドル)まで下落する可能性がある。これは依然として注目すべき重要な短期レベルである。価格が20日間EMAから力強く反発した場合、それはより低いレベルが引き続き買い手を引き付けていることを示すでしょう。その後、ペアは1.23ドルのレベルを再テストする可能性がある。これを上抜ければ、1.50ドル、そして最終的には2ドルへの上昇への道が開かれる可能性がある。
This optimistic view will be negated in the near term if the price turns down sharply and plummets below the 20-day EMA. That could tug the price to the next significant support at $0.72.
価格が急激に下落し、20日間EMAを下回れば、この楽観的な見方は短期的には打ち消されるだろう。これにより、価格は次の重要なサポートである0.72ドルまで上昇する可能性がある。
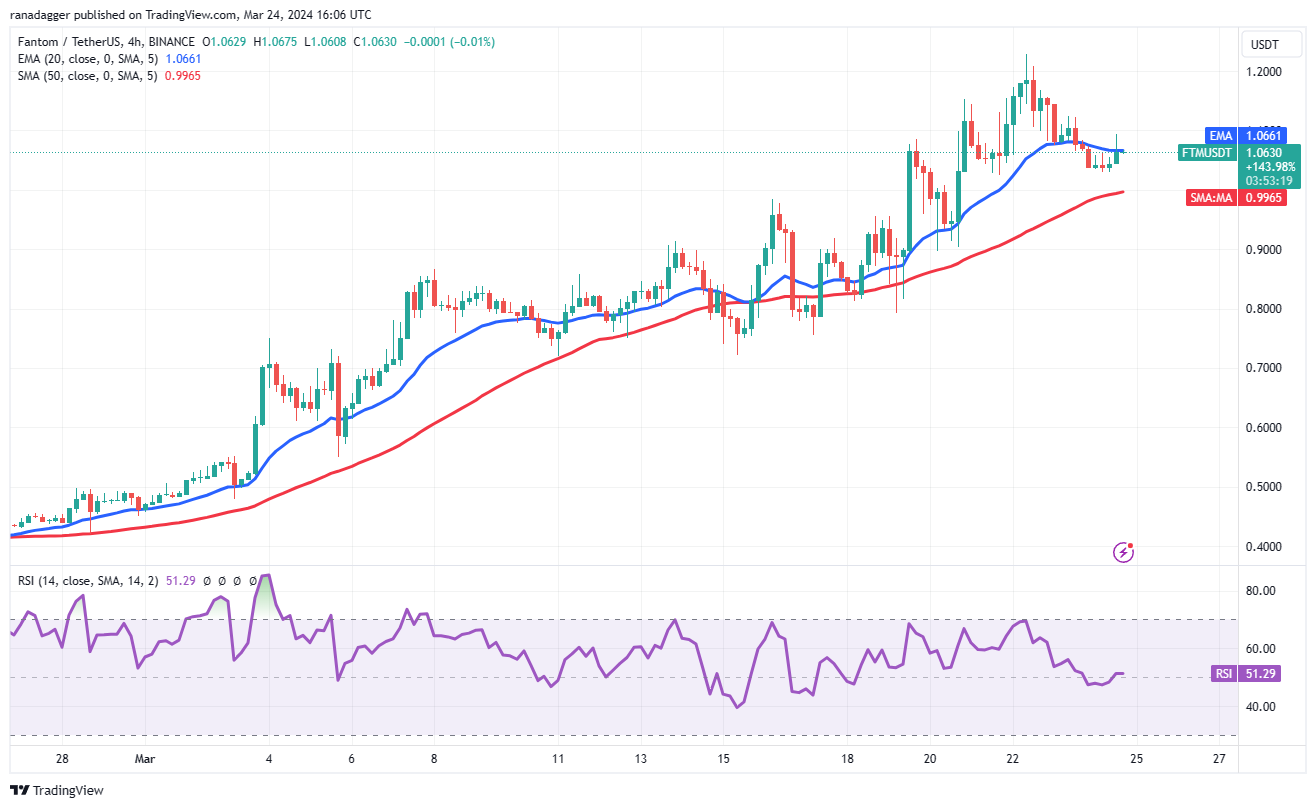
The bears pulled the price below the 20-EMA on the 4-hour chart, but a positive sign is that the bulls have not allowed the 50-SMA to be challenged. Buyers are trying to push the price back above the 20-EMA. If they manage to do that, the pair could rise to $1.12 and then to $1.16.
弱気派は4時間足チャートで価格を20-EMA以下に引き下げたが、強気派が50-SMAに挑戦することを許可していないことは明るい兆候である。買い手は価格を20-EMAを上回ろうとしている。それができれば、ペアは1.12ドル、そして1.16ドルまで上昇する可能性がある。
Alternatively, if the price turns down from the overhead resistance and breaks below the 50-SMA, it will suggest that the bears are aggressively selling at higher levels. The pair may then start a downward move to $0.80.
あるいは、価格が頭上の抵抗線から下落し、50-SMAを下回った場合、弱気派がより高いレベルで積極的に売りを出していることを示唆するでしょう。その後、ペアは0.80ドルまで下降を開始する可能性があります。
This article does not contain investment advice or recommendations. Every investment and trading move involves risk, and readers should conduct their own research when making a decision.
この記事には投資に関するアドバイスや推奨事項は含まれません。あらゆる投資や取引の動きにはリスクが伴うため、読者は決定を下す際に独自の調査を行う必要があります。
 Crypto Daily™
 Crypto Daily™
 DogeHome
 TheCoinrise Media
 Thecoinrepublic.com
 TheCoinrise Media
 TheCoinrise Media
 Cryptopolitan_News


