

Bitcoin (BTC) is on target to end the week in the red, but a positive sign for the bulls is that the price has recovered from the intra-week low of about $61,000 to over $65,000. This shows that traders remain long-term bullish and are buying the dips.
比特幣 (BTC) 預計本週將出現下跌,但對於多頭來說,一個積極的信號是價格已從約 61,000 美元的周內低點回升至 65,000 美元以上。這表明交易者仍然長期看漲並逢低買入。
CryptoQuant CEO Ki Young Ju expects inflows into spot Bitcoin exchange-traded funds (ETFs) to increase if Bitcoin nears support levels. Young Ju said the new Bitcoin whales, who purchased Bitcoin ETFs, have an on-chain cost basis of $56,000. He anticipates buying to pick up if Bitcoin’s price reaches $56,000.
CryptoQuant 執行長 Ki Young Ju 預計,如果比特幣接近支撐位,流入現貨比特幣交易所交易基金(ETF)的資金將會增加。 Young Ju 表示,購買比特幣 ETF 的新比特幣鯨魚的鏈上成本為 56,000 美元。他預計,如果比特幣價格達到 56,000 美元,購買量將會增加。
Another positive sign that could support Bitcoin’s price is that outflows from the Grayscale Bitcoin Trust (GBTC) are slowing down. According to Fairside Investors data, the outflows from GBTC dropped to just $170 million on March 22. This suggests that the selling pressure could be reducing. If Bitcoin ends March above $61,130, it would be the first-ever seven-month winning streak.
另一個可能支撐比特幣價格的正面訊號是灰階比特幣信託基金(GBTC)的資金流出正在放緩。根據 Fairside Investors 的數據,3 月 22 日 GBTC 的資金流出降至僅 1.7 億美元。這表明拋售壓力可能正在減輕。如果比特幣在 3 月結束時突破 61,130 美元,這將是有史以來第一次連續七個月上漲。
Could a recovery in Bitcoin trigger buying in select altcoins? Let’s look at the top 5 cryptocurrencies that look strong on the charts.
比特幣的復甦是否會引發某些山寨幣的購買?讓我們來看看圖表上表現最強的前 5 種加密貨幣。
Bitcoin price analysis
比特幣價格分析
Bitcoin has been trading near the 20-day exponential moving average ($65,364) for the past few days, indicating a battle between the bulls and the bears for supremacy.
過去幾天,比特幣一直在 20 天指數移動平均線(65,364 美元)附近交易,這表明多頭和空頭之間正在爭奪霸權。
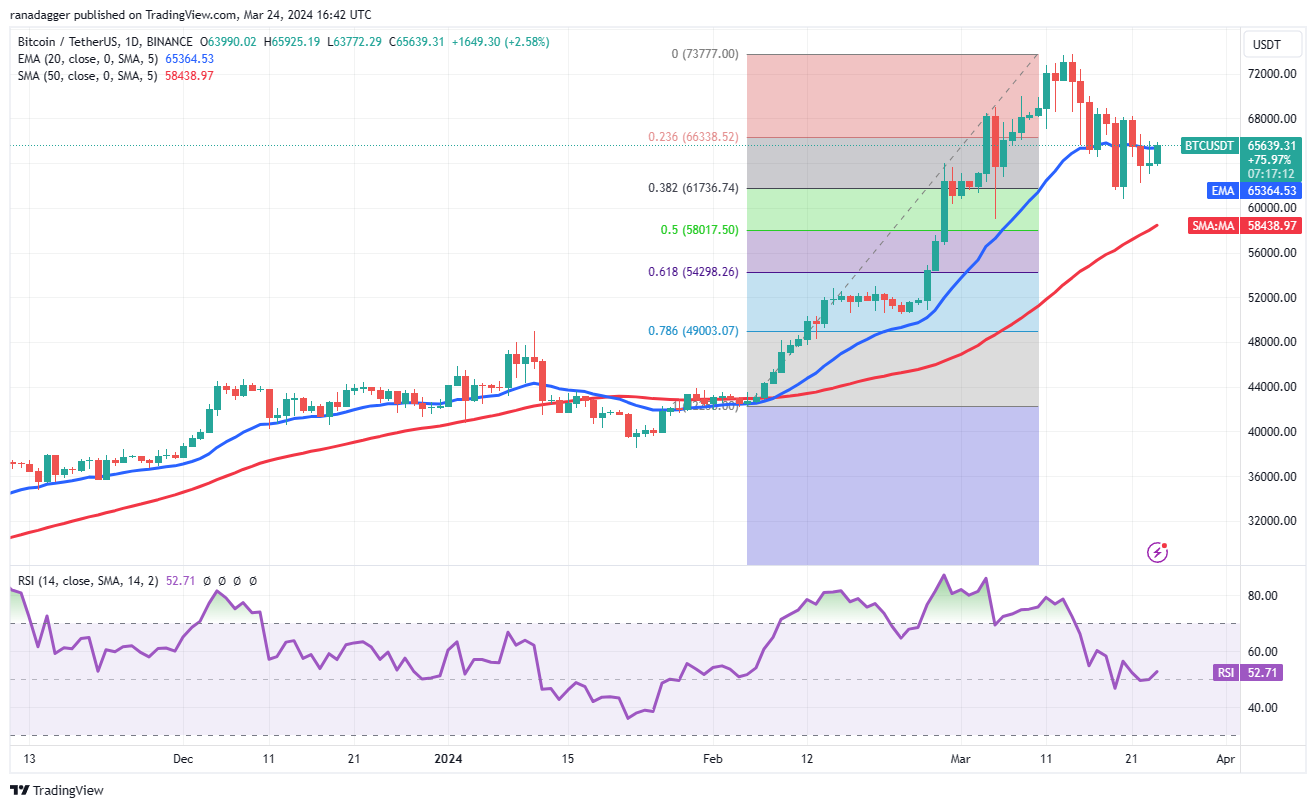
The 20-day EMA is gradually flattening out, and the relative strength index (RSI) is near the midpoint, indicating a balance between supply and demand. The BTC/USDT pair could swing between $60,775 and $69,000 in the near term.
20日均線逐漸趨平,相對強弱指數(RSI)接近中點,顯示供需平衡。 BTC/USDT 貨幣對短期內可能在 60,775 美元至 69,000 美元之間波動。
If the price remains below the 20-day EMA, the support zone between the 50-day simple moving average ($58,438) and $60,775 may come under pressure. If this zone cracks, the correction could deepen to the 61.8% Fibonacci retracement level of $54,298.
如果價格仍低於 20 日均線,50 日簡單移動平均線(58,438 美元)和 60,775 美元之間的支撐區域可能會面臨壓力。如果該區域破裂,調整可能會加深至 61.8% 斐波那契回檔位 54,298 美元。
On the upside, a break and close above $69,000 could open the doors for a retest of $73,777. If this resistance is scaled, the pair may ascend to $80,000.
從好的方面來看,突破並收盤於 69,000 美元上方可能為重新測試 73,777 美元打開大門。如果突破該阻力位,該貨幣對可能會升至 80,000 美元。
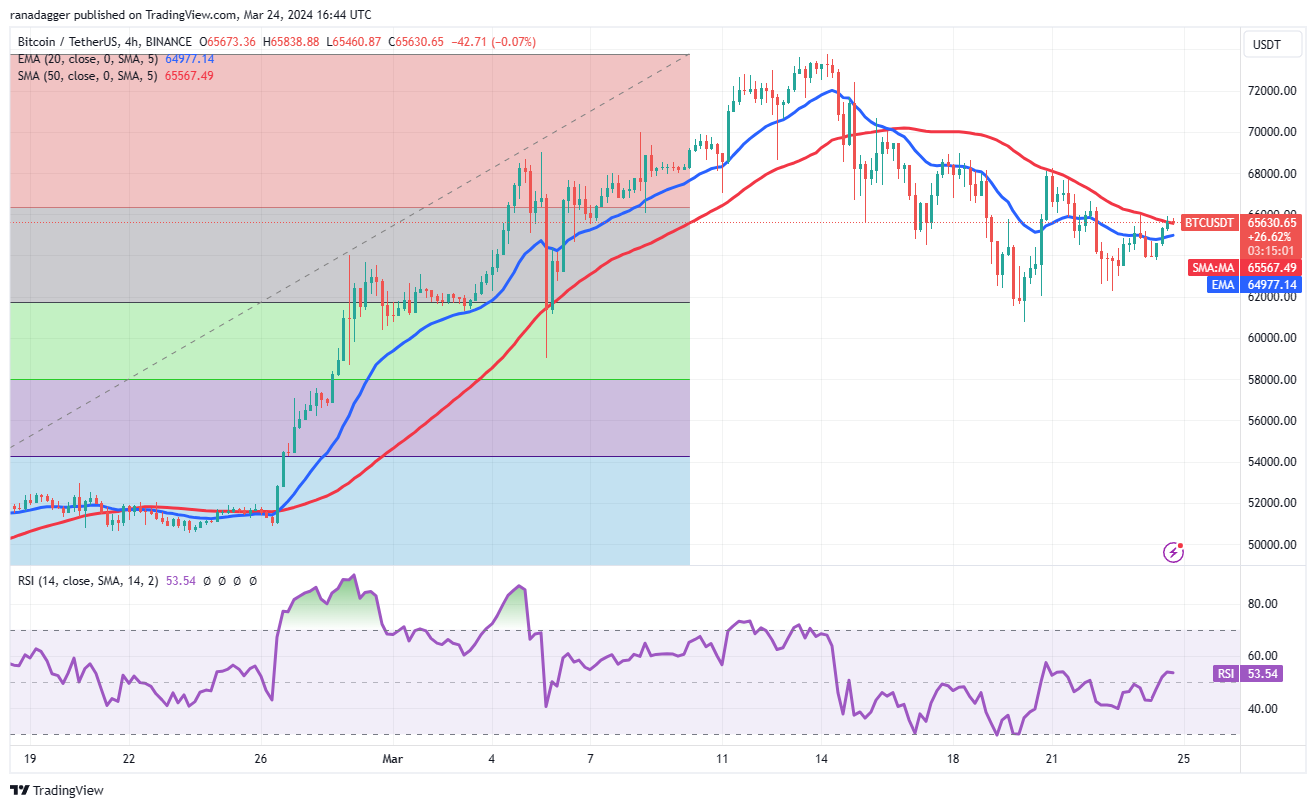
The 4-hour chart shows the bears are capping the relief rallies at the 50-SMA. Hence, this becomes an important level to watch out for. If bulls push the price above the 50-SMA, it will suggest that the bearish pressure could be reducing. The pair may then rise to $69,000, which is likely to act as a major hurdle.
4 小時圖顯示,空頭正在限制 50 均線的反彈。因此,這成為需要警惕的重要水平。如果多頭將價格推高至 50 均線上方,則表示看跌壓力可能正在減輕。隨後該貨幣對可能會升至 69,000 美元,這可能會成為一個主要障礙。
The immediate support to watch on the downside is $62,260 and then $60,775. If bears sink the price below this support zone, the selling could pick up, and the pair may slide to $59,000.
下檔方面值得關注的直接支撐位是 62,260 美元,然後是 60,775 美元。如果空頭將價格壓低至該支撐區域以下,則拋售可能會加劇,該貨幣對可能會滑至 59,000 美元。
Dogecoin price analysis
狗狗幣價格分析
Dogecoin (DOGE) has been range-bound between $0.12 and $0.19 for the past few days. The bulls cleared the $0.16 hurdle on March 24, opening the doors for a rise to $0.19.
過去幾天,狗狗幣(DOGE)一直在 0.12 美元至 0.19 美元之間波動。 3 月 24 日,多頭突破了 0.16 美元的關口,為上漲至 0.19 美元打開了大門。
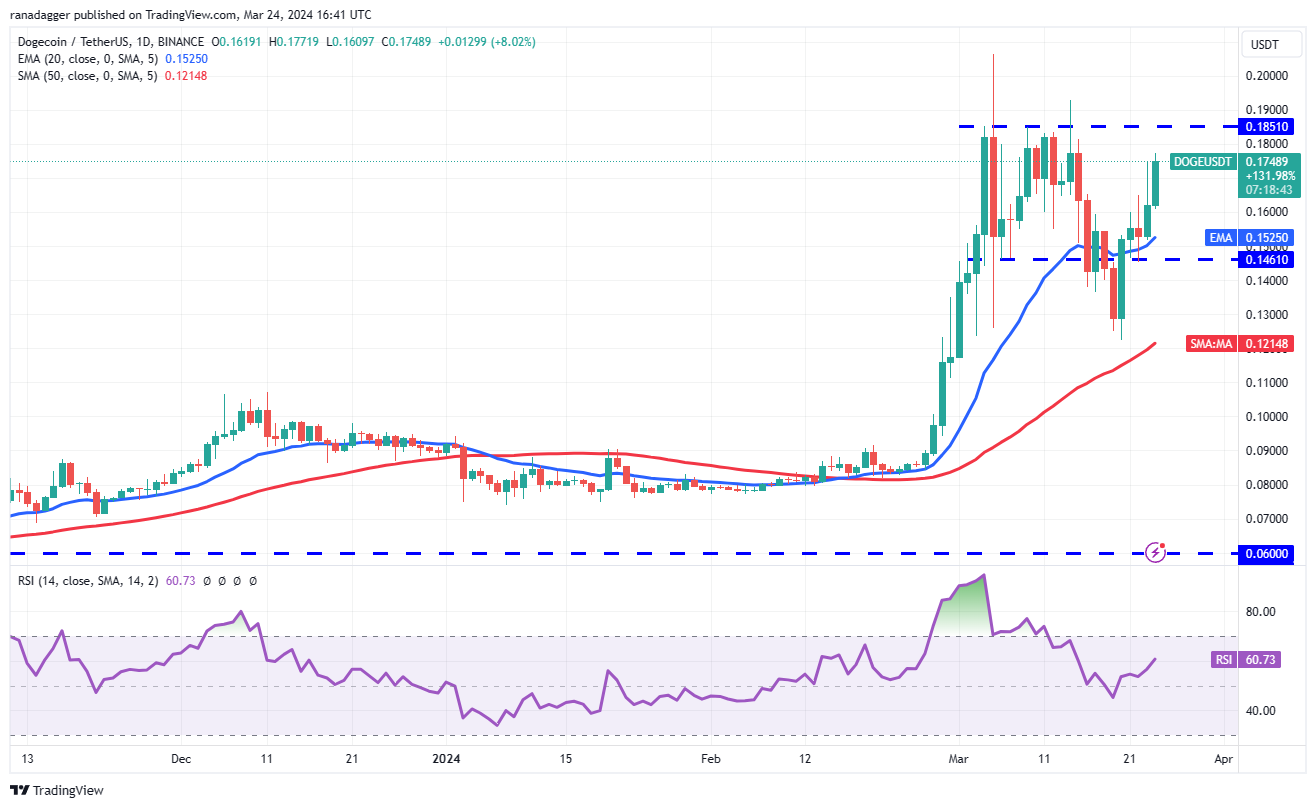
The 20-day EMA ($0.15) has started to turn up, and the RSI is in positive territory, indicating that the bulls are attempting a comeback. A break and close above $0.19 could start the journey toward $0.23 and later $0.30.
20 日均線(0.15 美元)已開始上升,RSI 處於正值區域,表明多頭正在嘗試捲土重來。突破並收盤於 0.19 美元之上可能會開始走向 0.23 美元,隨後走向 0.30 美元。
Instead, if the price turns down sharply from $0.19, it will suggest that the bears remain active at higher levels. The DOGE/USDT pair could slide toward the solid support at $0.12. The bears will have to sink the price below the 50-day SMA ($0.12) to indicate that the uptrend could be over.
相反,如果價格從 0.19 美元大幅下跌,則表明空頭在較高水平仍保持活躍。 DOGE/USDT 貨幣對可能會滑向 0.12 美元的堅實支撐位。空頭必須將價格跌破 50 日移動平均線(0.12 美元),以表示上升趨勢可能結束。
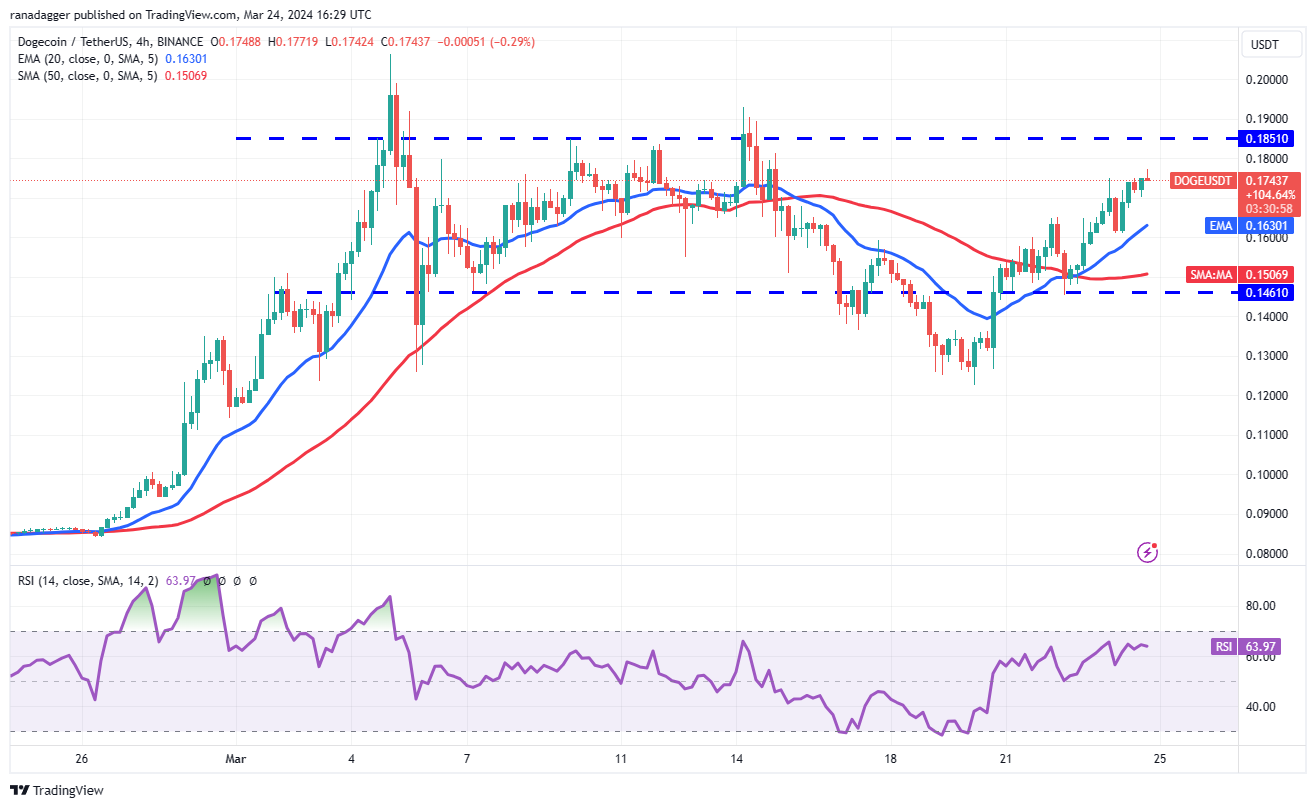
The 4-hour chart shows that the bulls are buying the dips to the 20-EMA, indicating a positive sentiment. Buyers will try to push the price to the overhead resistance of $0.19, where the bears may again mount a strong defense. If bulls do not cede ground to the bears from $0.19, the likelihood of a rally above $0.20 increases.
4 小時圖顯示,多頭逢低買進 20 日均線,顯示市場情緒正向。買家將試圖將價格推高至 0.19 美元的上方阻力位,空頭可能會再次在此進行強有力的防禦。如果多頭不從 0.19 美元起讓給空頭,那麼反彈至 0.20 美元以上的可能性就會增加。
The first sign of weakness will be a break and close below the 20-EMA. That may open the doors for a fall to $0.14.
疲軟的第一個跡象將是跌破並收於 20 均線下方。這可能為跌至 0.14 美元打開大門。
Toncoin price analysis
通幣價格分析
Toncoin (TON) surged above the $4.60 resistance on March 23, indicating the start of the next leg of the uptrend.
Toncoin (TON) 於 3 月 23 日飆升至 4.60 美元阻力位上方,顯示下一階段上升趨勢的開始。
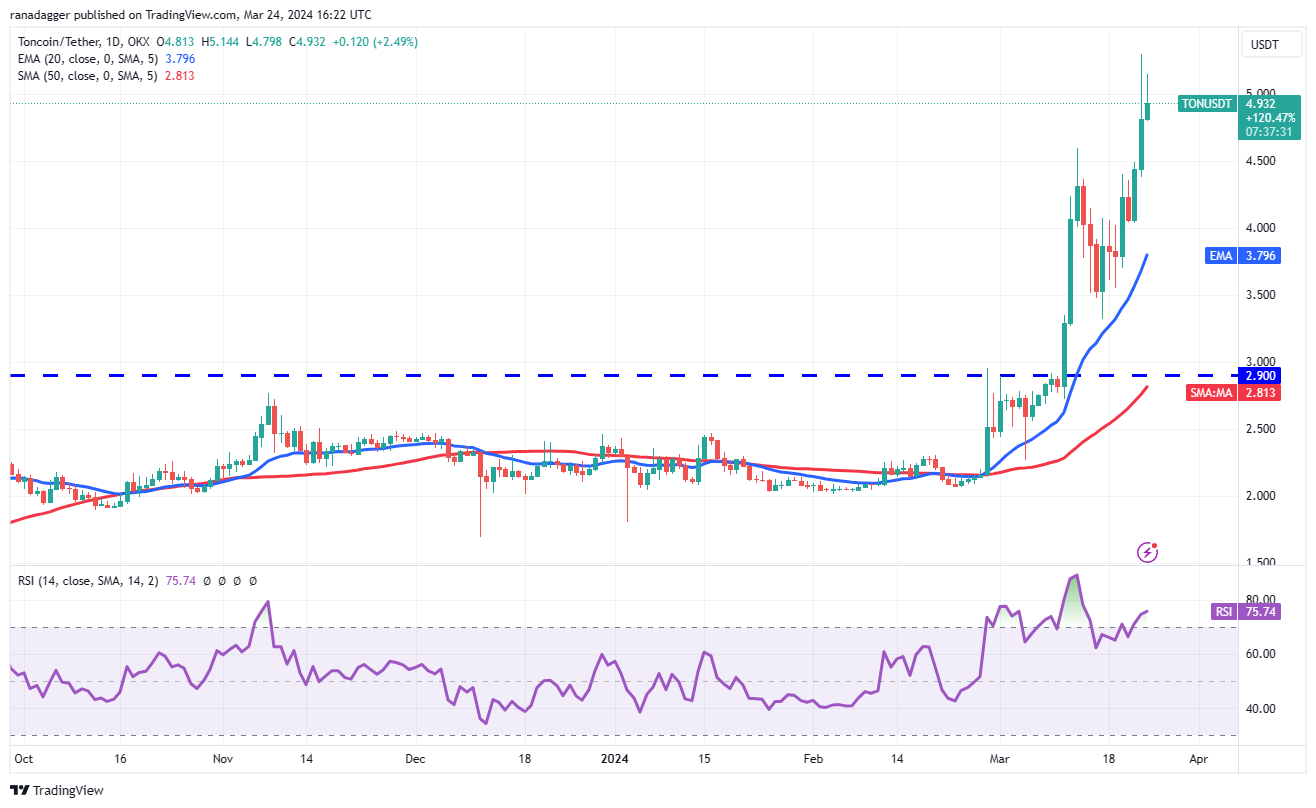
The upsloping moving averages and the RSI in the overbought zone signal that buyers are in command. The long wick on the March 23 and 24 candlesticks shows profit booking above $5, but if the bulls do not give up much ground from the current level, the TON/USDT pair could extend the rally to $5.64.
向上傾斜的移動平均線和處於超買區域的 RSI 表明買家處於主導地位。 3 月 23 日和 24 日燭台上的長影線顯示利潤預定高於 5 美元,但如果多頭不從當前水平放棄太多基礎,TON/USDT 貨幣對可能會將漲勢擴大至 5.64 美元。
If bears want to prevent the upside, they will have to drag and sustain the price below $4.60. That may tempt short-term traders to book profits, pulling the pair to the 20-day EMA ($3.79).
如果空頭想要阻止上漲,他們將不得不將價格拖至並維持在 4.60 美元以下。這可能會吸引短期交易者獲利了結,從而將該貨幣對拉至 20 日均線(3.79 美元)。
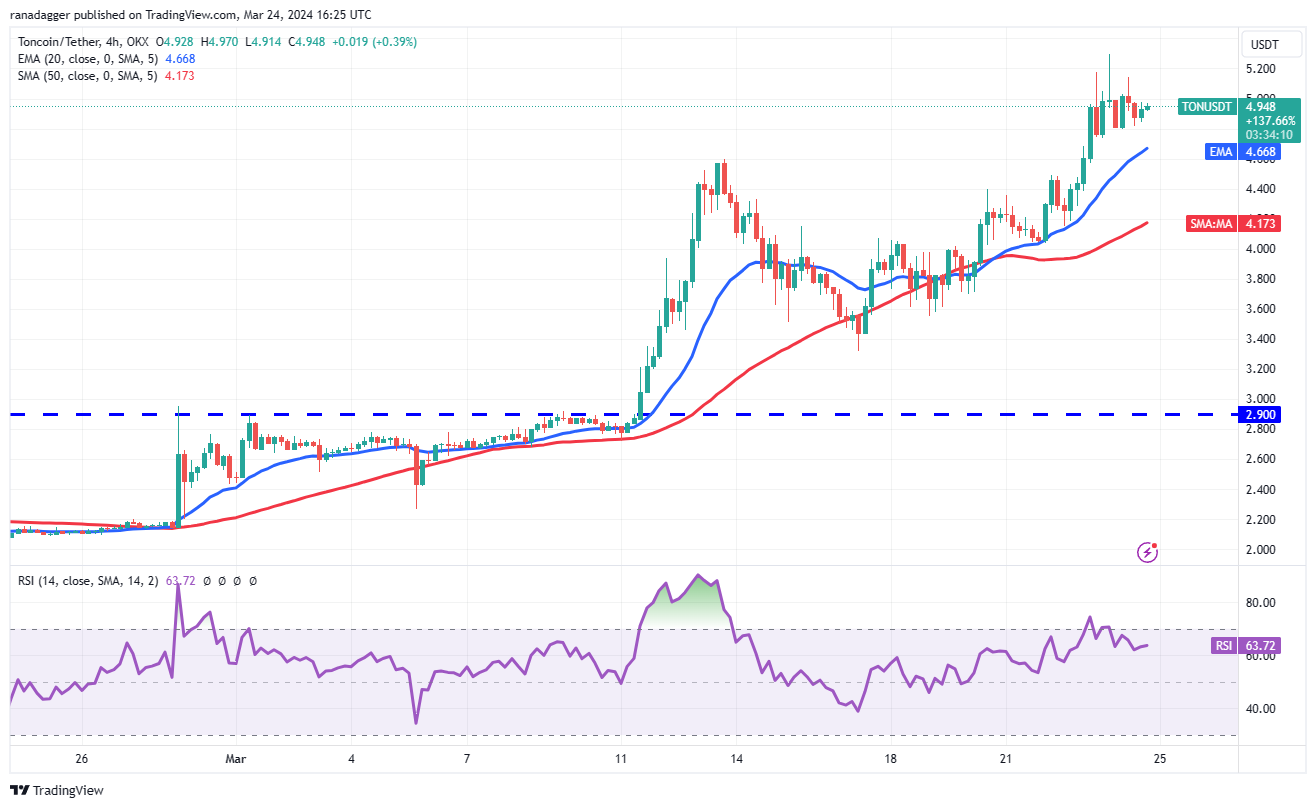
The 4-hour chart shows that the bears are aggressively defending the $5 resistance, but have failed to sink the pair below the 20-EMA. This is a positive sign as it suggests that the traders are holding to their positions as they anticipate another leg higher.
4小時圖顯示,空頭正積極捍衛5美元阻力位,但未能將該貨幣對跌破20均線。這是一個積極的信號,因為它表明交易者正在持有倉位,因為他們預計還會進一步走高。
The first support on the downside is the 20-EMA. A slide below this support will suggest that the short-term traders may be booking profits. That could pull the price to the 50-SMA and later to $3.50.
下行的第一個支撐位是 20 日均線。跌破該支撐位將表明短期交易者可能會獲利了結。這可能會將價格拉至 50 移動平均線,然後拉至 3.50 美元。
Related: Terra founder Do Kwon released in Montenegro
相關:Terra 創辦人 Do Kwon 在黑山獲釋
Stacks price analysis
堆疊價格分析
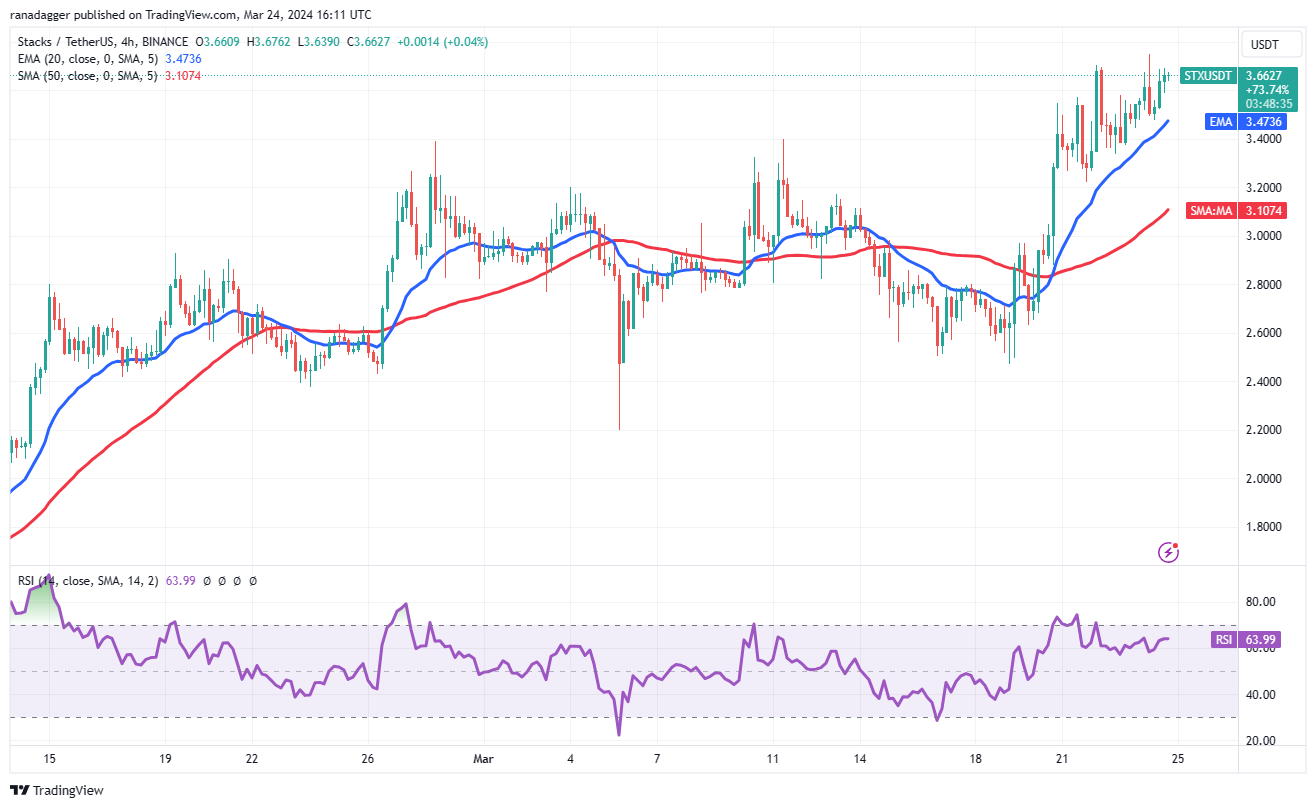
The bulls propelled Stacks (STX) above the $3.40 overhead resistance on March 20, indicating that the uptrend remains intact.
3 月 20 日,多頭將 Stacks (STX) 推升至 3.40 美元上方阻力位,顯示上升趨勢依然完好。
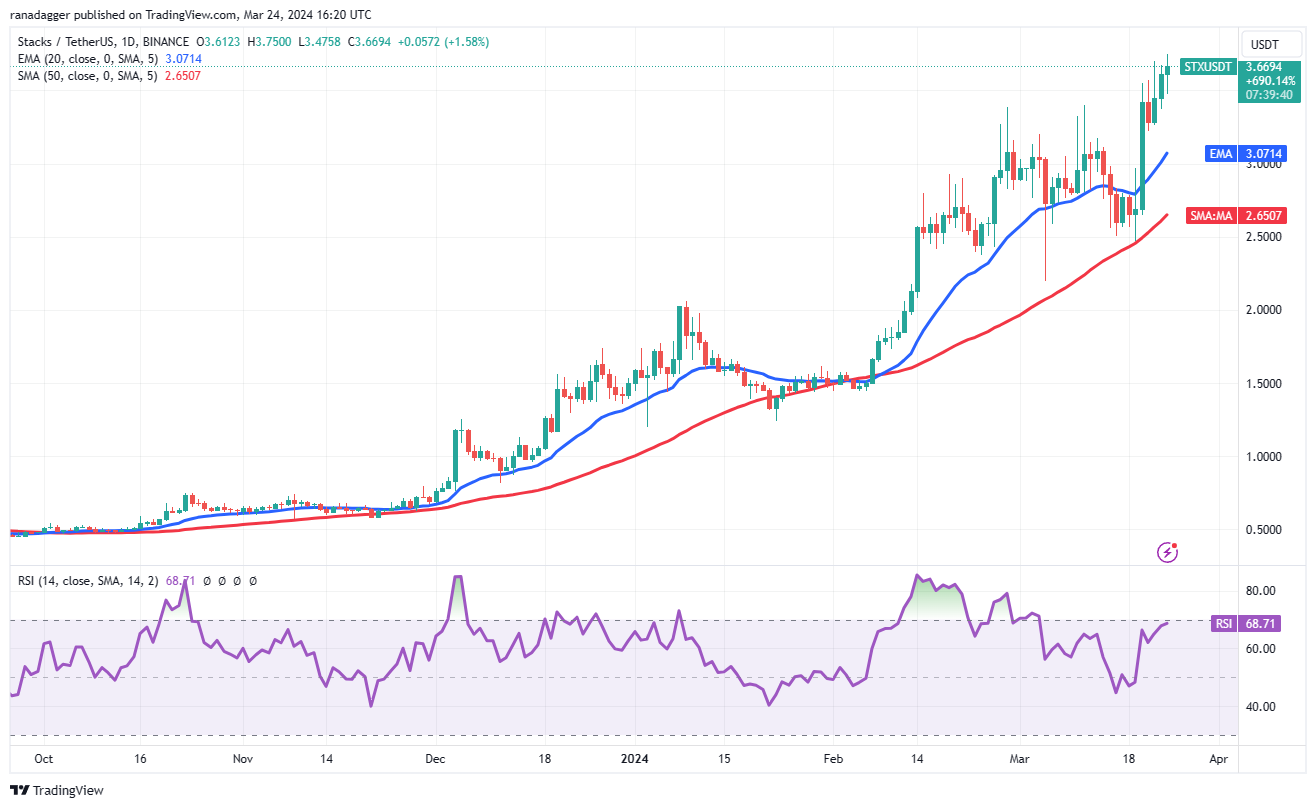
Both moving averages are sloping up, and the RSI is near the overbought zone, indicating that bulls have an advantage. If buyers maintain the price above $3.40, the uptrend is likely to pick up momentum, and the STX/USDT pair could rally to $4.29.
兩條均線均向上傾斜,RSI 位於超買區域附近,顯示多頭具有優勢。如果買家將價格維持在 3.40 美元以上,上升趨勢可能會增強,STX/USDT 貨幣對可能會反彈至 4.29 美元。
Contrary to this assumption, if the price turns down and skids below $3.40, it will signal that the markets have rejected the higher levels. The pair may slump to the 20-day EMA ($3.07). A bounce off this level will suggest that the uptrend remains intact, but a break below the 20-day EMA could sink the pair to the 50-day SMA ($2.65).
與這一假設相反,如果價格下跌並跌破 3.40 美元,則表明市場已經拒絕了更高的水平。該貨幣對可能會跌至 20 日均線(3.07 美元)。從該水平反彈將表明上升趨勢保持完好,但跌破 20 日均線可能導致該貨幣對跌至 50 日移動平均線(2.65 美元)。
The 4-hour chart shows that the bulls are buying the dips to the 20-EMA, signaling that the sentiment remains positive. There is a minor resistance at $3.75, but if this level is crossed, the pair may reach $4.
4 小時圖顯示,多頭逢低買進 20 日均線,顯示市場情緒依然樂觀。 3.75 美元有一個小阻力,但如果突破該水平,該貨幣對可能會達到 4 美元。
The crucial support to watch on the downside is the 20-EMA. If this level gives way, it will suggest that the bulls are rushing to the exit. The pair may then drop to $3.22. A break below this support could accelerate selling and sink the pair below the 50-SMA.
下檔方面值得關注的關鍵支撐是 20 日均線。如果這個水平讓步,則表示多頭正在急於退出。隨後該貨幣對可能會跌至 3.22 美元。跌破該支撐位可能會加速拋售並使該貨幣對跌破 50 移動平均線。
Fantom price analysis
幻影價格分析
Fantom’s (FTM) long wick on the March 22 candlestick shows profit booking near $1.23. The selling accelerated on March 23, and the bears are attempting to sink the price below $1.02.
Fantom (FTM) 3 月 22 日燭台上的長影線顯示利潤預定接近 1.23 美元。 3 月 23 日拋售加速,空頭試圖將價格壓低至 1.02 美元以下。
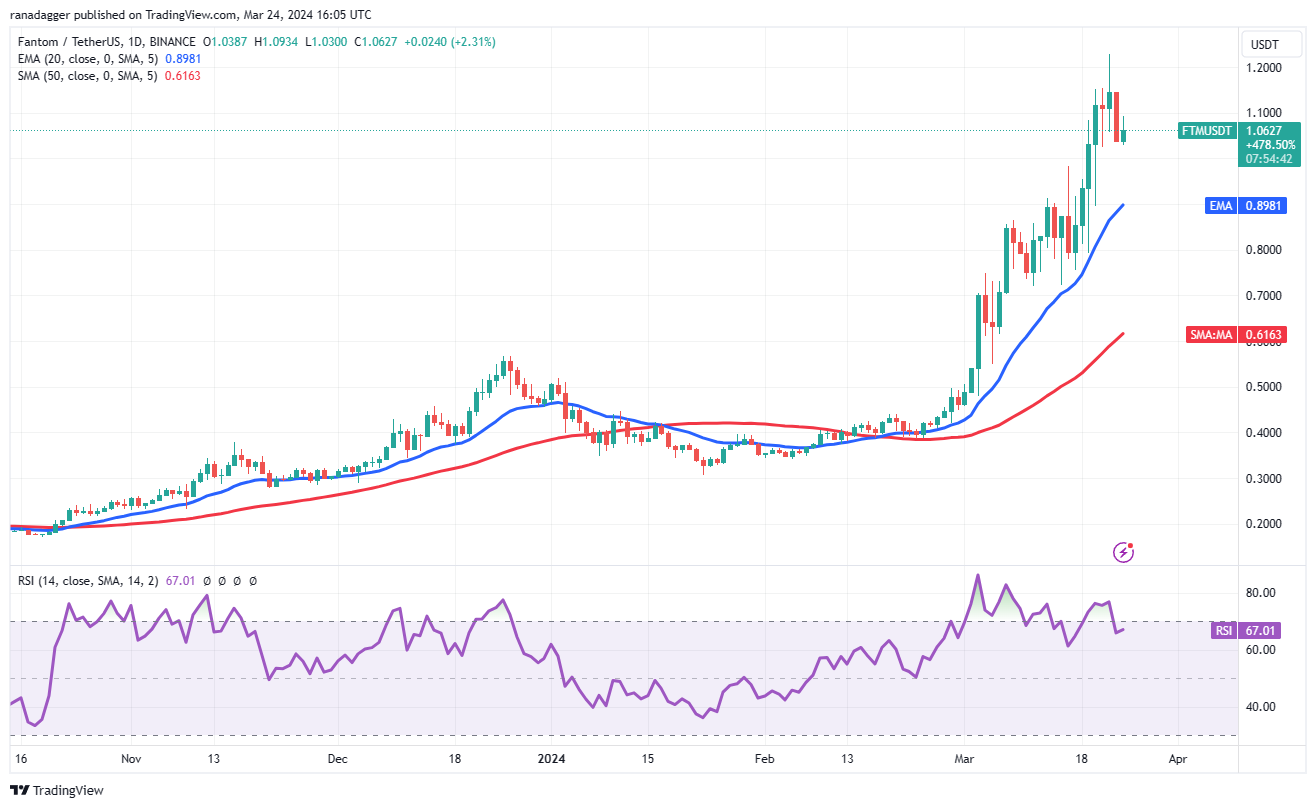
If they succeed, the FTM/USDT pair could tumble to the 20-day EMA ($0.89). This remains the key short-term level to watch out for. If the price rebounds off the 20-day EMA with strength, it will signal that lower levels continue to attract buyers. The pair may then retest the $1.23 level. A break above it could clear the path for a rally to $1.50 and eventually to $2.
如果成功,FTM/USDT 貨幣對可能會跌至 20 日均線(0.89 美元)。這仍然是值得關注的關鍵短期水平。如果價格從 20 日均線強勁反彈,則將表明較低水準繼續吸引買家。隨後該貨幣對可能會重新測試 1.23 美元水準。突破該水平可能會為反彈至 1.50 美元並最終至 2 美元掃清道路。
This optimistic view will be negated in the near term if the price turns down sharply and plummets below the 20-day EMA. That could tug the price to the next significant support at $0.72.
如果價格大幅下跌並跌破 20 日均線,這種樂觀看法將在短期內被否定。這可能會將價格拉至下一個重要支撐位 0.72 美元。
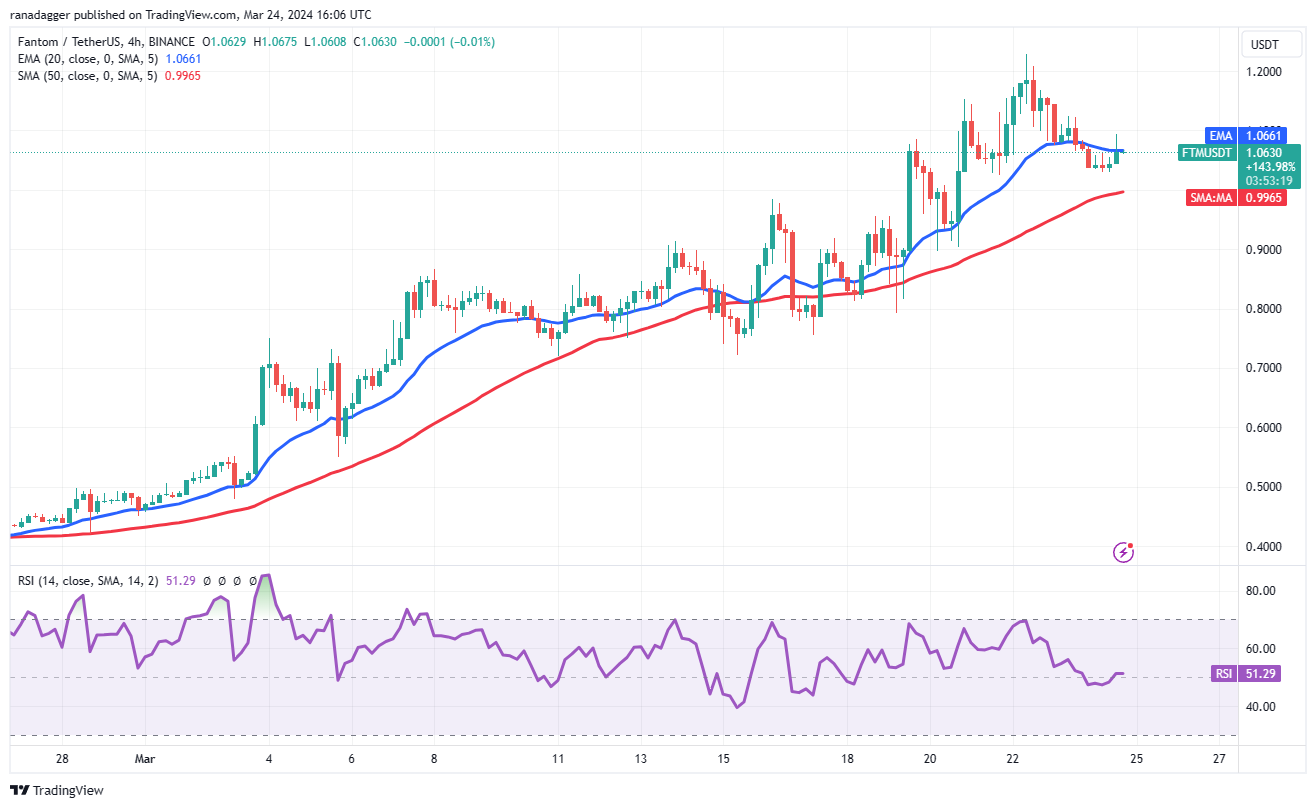
The bears pulled the price below the 20-EMA on the 4-hour chart, but a positive sign is that the bulls have not allowed the 50-SMA to be challenged. Buyers are trying to push the price back above the 20-EMA. If they manage to do that, the pair could rise to $1.12 and then to $1.16.
空頭將價格拉低至 4 小時圖上的 20 均線下方,但一個積極的信號是多頭不允許 50 均線受到挑戰。買家正試圖將價格推回 20 均線上方。如果他們成功做到這一點,該貨幣對可能會升至 1.12 美元,然後升至 1.16 美元。
Alternatively, if the price turns down from the overhead resistance and breaks below the 50-SMA, it will suggest that the bears are aggressively selling at higher levels. The pair may then start a downward move to $0.80.
或者,如果價格從上方阻力位回落並跌破 50 移動平均線,則表示空頭正在更高水平上積極拋售。隨後該貨幣對可能開始下跌至 0.80 美元。
This article does not contain investment advice or recommendations. Every investment and trading move involves risk, and readers should conduct their own research when making a decision.
本文不包含投資建議或建議。每一項投資和交易行為都涉及風險,讀者在做決定時應自行研究。
 Crypto Daily™
 Crypto Daily™
 DogeHome
 TheCoinrise Media
 Thecoinrepublic.com
 TheCoinrise Media
 TheCoinrise Media
 Cryptopolitan_News


