Bitcoin price made a surprise move this week blasting to $64,000 from an important support area above $50,000 on Monday. This massive uptick has changed both the short-term and long-term landscape of not only Bitcoin but also other crypto to HODL, including Shiba Inu (SHIB), Dogecoin (DOGE), and XRP.
비트코인 가격은 이번 주 월요일 50,000달러 이상의 중요한 지지대에서 64,000달러로 폭발적으로 상승했습니다. 이러한 엄청난 상승세는 비트코인뿐만 아니라 Shiba Inu(SHIB), Dogecoin(DOGE) 및 XRP를 포함한 다른 암호화폐의 단기 및 장기 환경을 HODL로 변화시켰습니다.
The ETF happens to be the biggest market mover since the approval in January. With over $7.49 billion in cumulative total net inflow, demand for BTC is surging and sending Bitcoin price ballistic.
해당 ETF는 지난 1월 승인 이후 가장 큰 시장 움직임을 보였습니다. 누적 총 순 유입액이 74억 9천만 달러가 넘는 BTC에 대한 수요가 급증하고 있으며 비트코인 가격이 폭발적으로 상승하고 있습니다.
Although the rally was witnessed across the market, some altcoins like SHIB emerged as top gainers, increasing by more than 50% in a week.
이러한 랠리는 시장 전반에서 목격되었지만 SHIB와 같은 일부 알트코인은 일주일 만에 50% 이상 상승하며 최고 상승세를 보였습니다.
Investors will carefully gauge Bitcoin’s behavior in the next few days to ascertain the validity of the uptrend to $70,000 or a correction to collect liquidity for another major breakout.
투자자들은 앞으로 며칠 동안 비트코인의 행동을 주의 깊게 측정하여 70,000달러까지의 상승 추세의 타당성을 확인하거나 또 다른 주요 돌파를 위해 유동성을 모으기 위한 조정을 확인할 것입니다.
1. Bitcoin (BTC)
1. 비트코인(BTC)
The supply and demand landscape for Bitcoin continues to change, driven by increasing ETF inflows. On top of this, investors are preferring to hold onto their BTC in anticipation of a larger breakout post-halving in February.
비트코인의 수요와 공급 환경은 ETF 유입 증가로 인해 계속해서 변화하고 있습니다. 게다가 투자자들은 2월 반감기 이후 더 큰 돌파를 기대하면서 BTC를 보유하는 것을 선호하고 있습니다.
Bitcoin’s halving, which cuts miner rewards by half every four years. The last halving took place in 2020, placing the next event in 2024 around April.
비트코인의 반감기는 4년마다 채굴자 보상을 절반으로 줄입니다. 마지막 반감기는 2020년에 이루어졌으며 다음 반감기는 2024년 4월경에 이루어졌습니다.
In addition to giving Bitcoin its deflationary status, halving significantly reduces the amount of new coins joining the ecosystem. Remember miner rewards will come down to 3.125 BTC from the current 6.25 BTC.
비트코인에 디플레이션 상태를 부여하는 것 외에도 반감기는 생태계에 합류하는 새로운 코인의 양을 크게 줄입니다. 채굴자 보상은 현재 6.25BTC에서 3.125BTC로 줄어든다는 점을 기억하세요.
It is this gradual decrease in supply coupled with demand increasing or staying the same that tends to drive Bitcoin price parabolically higher. The ETF is also expected to have a major impact on BTC as demand soars.
비트코인 가격을 포물선적으로 높이는 경향이 있는 것은 수요가 증가하거나 동일하게 유지되는 것과 결합된 공급의 점진적인 감소입니다. 또한 ETF는 수요가 급증함에 따라 BTC에 큰 영향을 미칠 것으로 예상됩니다.

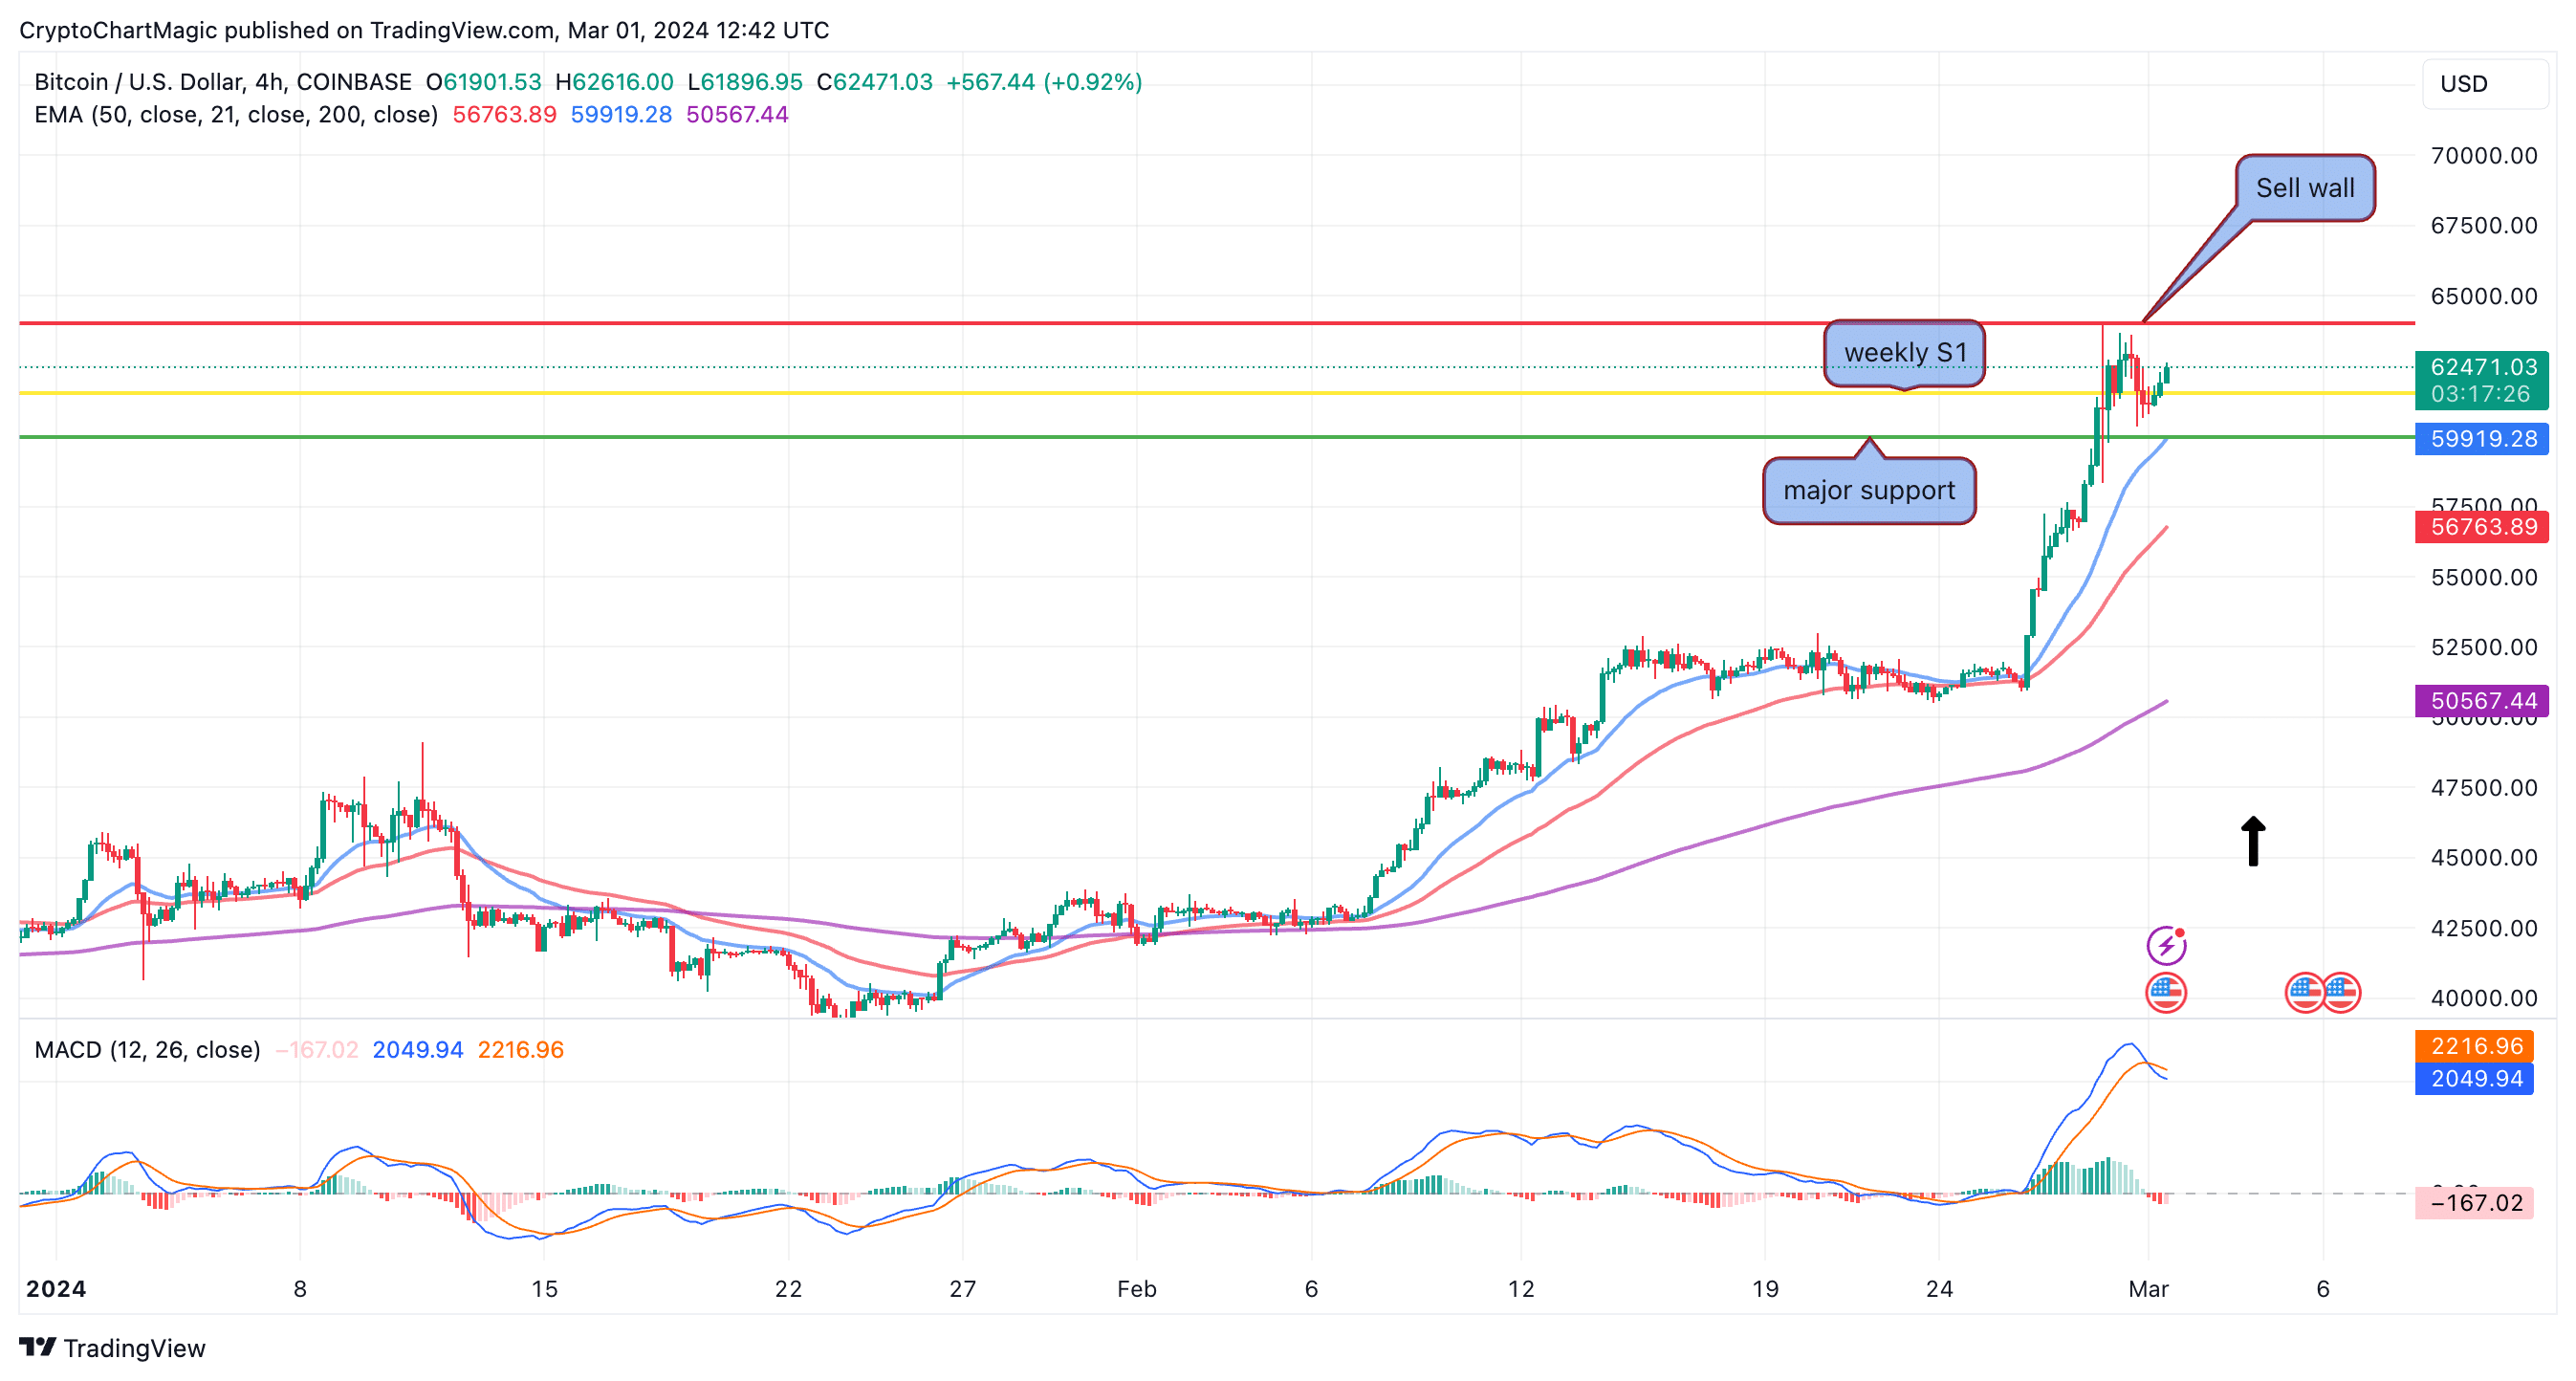
비트코인 가격 예측 차트 | 트레이딩뷰
The area at $63,000 represents a sell wall that must be weakened to allow for gains above $64,000 (the red line on the chart). A break above this would trigger more FOMO with market participants targeting a sweep of the all-time high followed by a leg up beyond $70,000.
$63,000 영역은 $64,000(차트의 빨간색 선) 이상의 이익을 허용하기 위해 약화되어야 하는 매도 벽을 나타냅니다. 이보다 높은 돌파는 시장 참가자들이 사상 최고치를 휩쓸고 $70,000를 넘어서는 상승을 목표로 하는 더 많은 FOMO를 촉발할 것입니다.
2. Shiba Inu (SHIB)
2. Shiba Inu (SHIB)
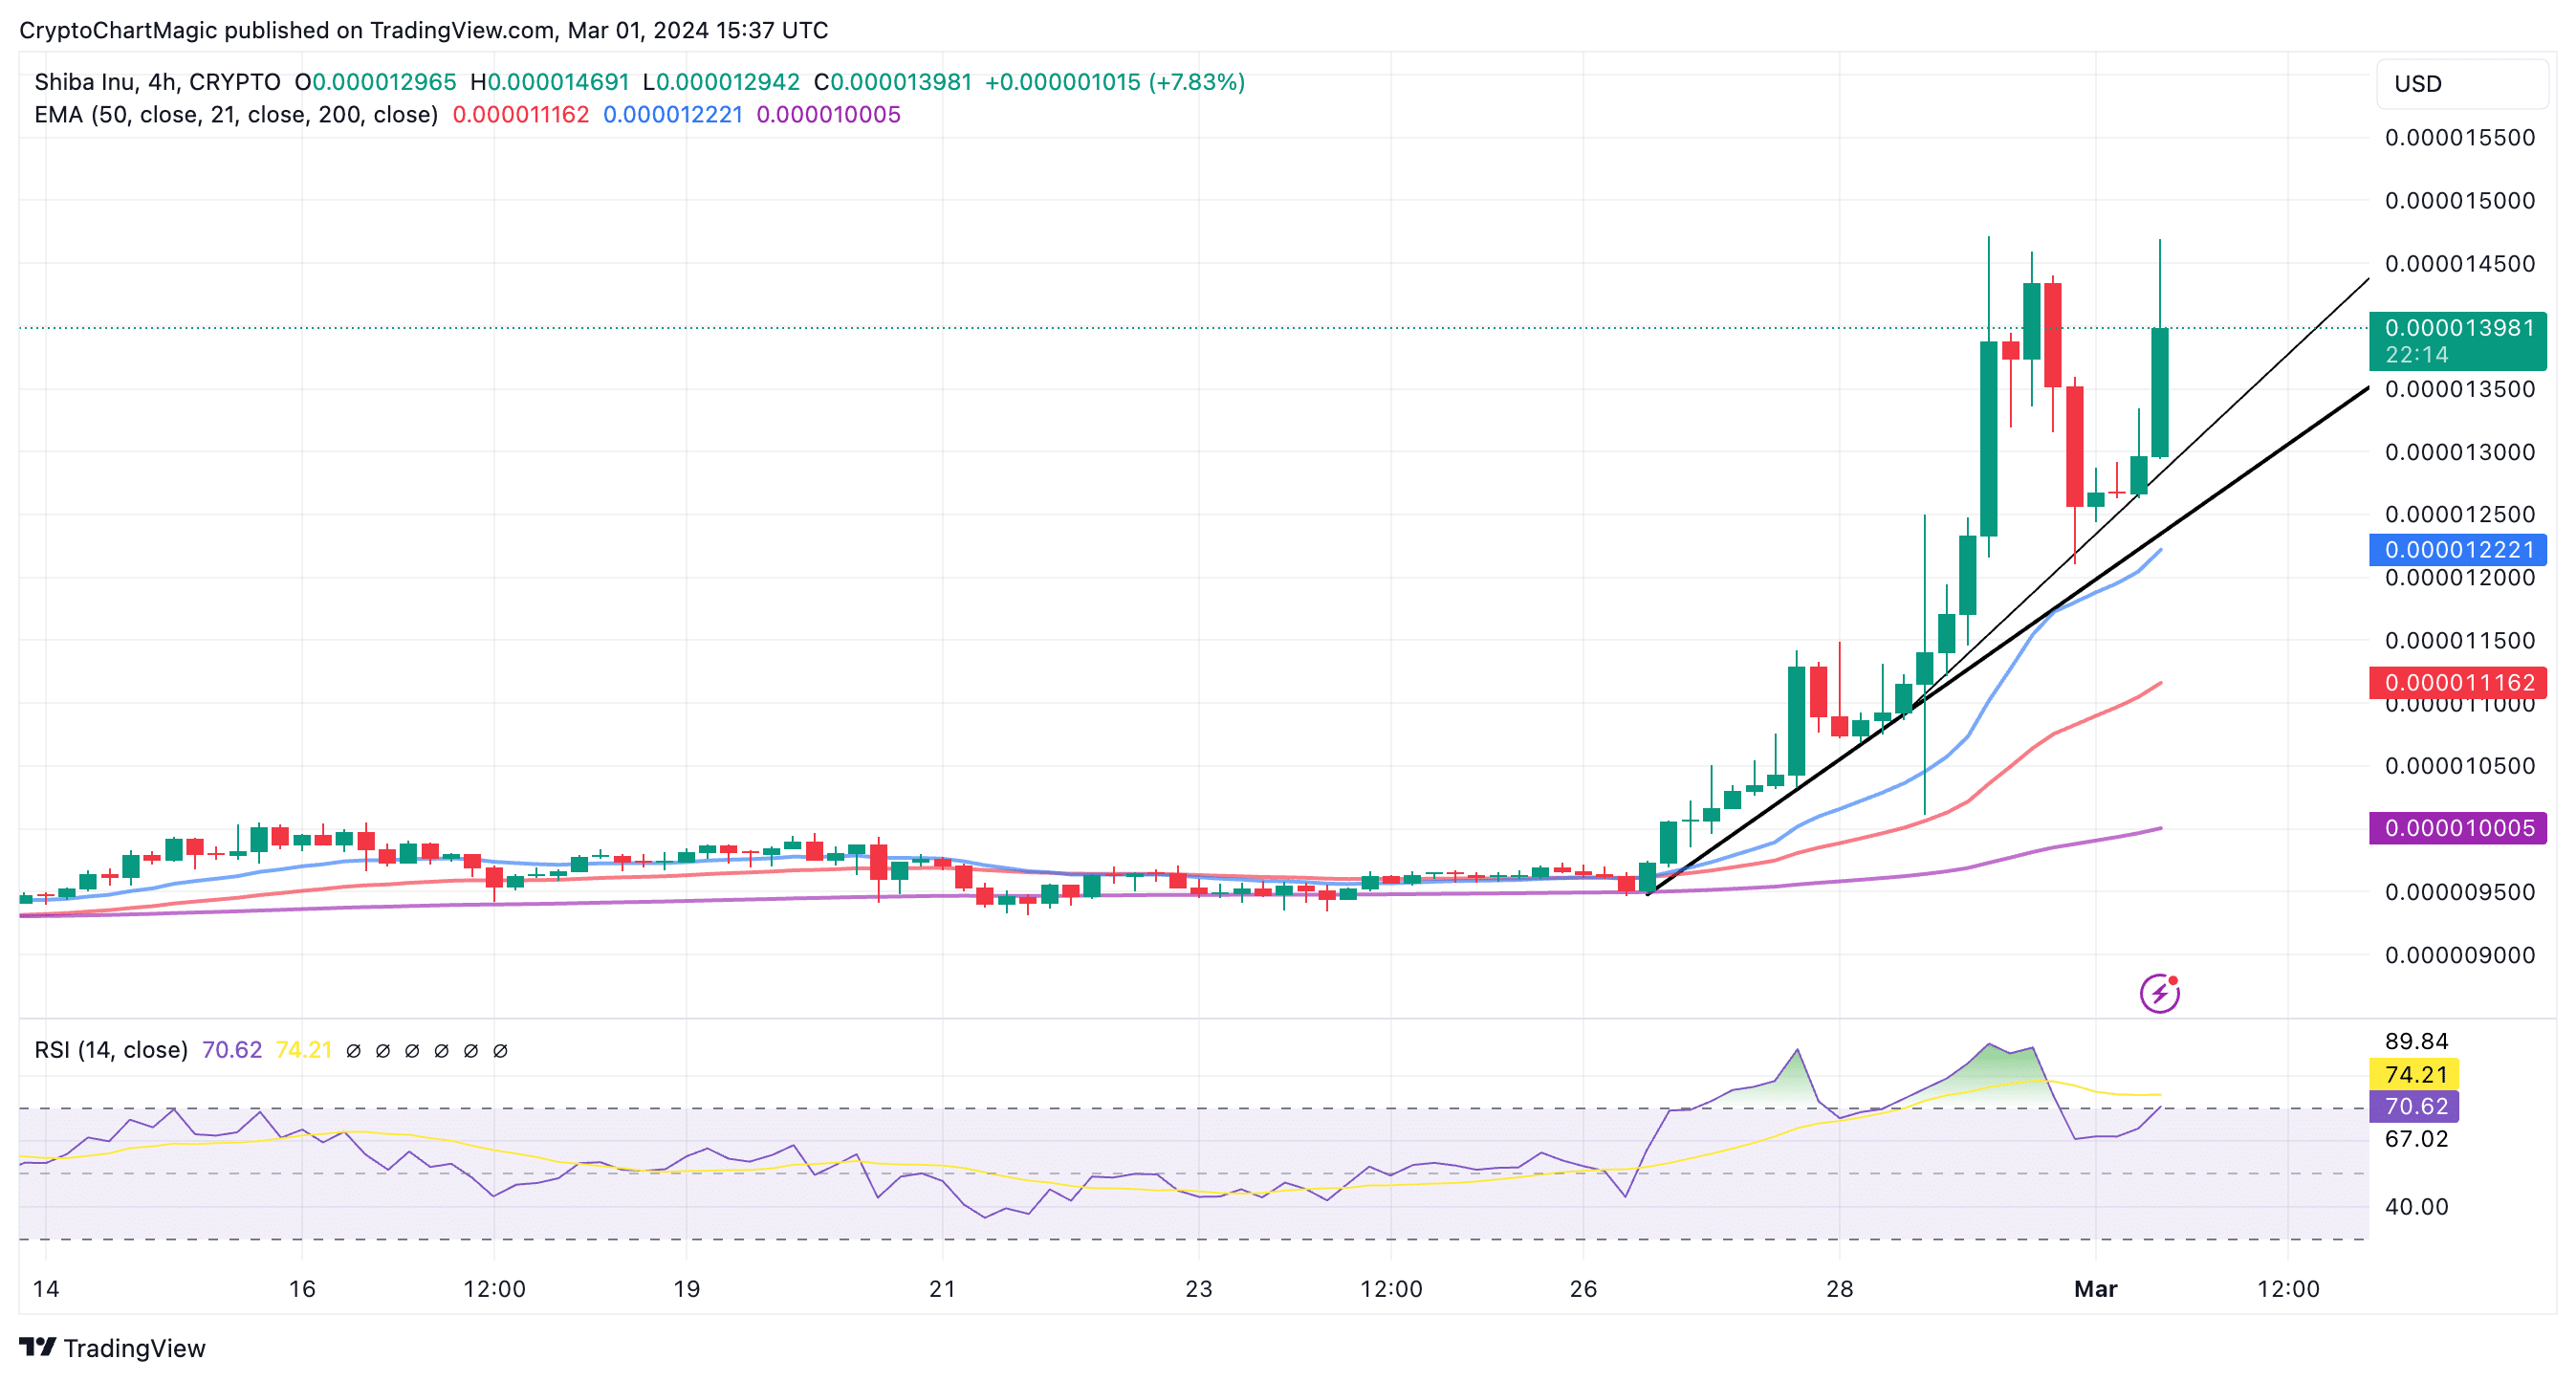
Like many cryptocurrencies in the market, Shiba Inu Coin faced increasing uncertainty in January, resulting in a correction below the $0.00001 level. The meme coin swept liquidity at $0.0000082 — 2024’s lowest point followed by a steady consolidation above $0.000009 ahead of this week’s massive breakout to $0.00001467.
시장의 많은 암호화폐와 마찬가지로 Shiba Inu Coin은 1월에 불확실성이 증가하여 $0.00001 수준 이하로 조정되었습니다. 밈 코인은 2024년 최저점 $0.0000082에서 유동성을 휩쓸었고 이번 주 $0.00001467까지의 대규모 돌파를 앞두고 $0.000009 이상으로 꾸준히 통합되었습니다.
A minor dip in the Moving Average Convergence Divergence (MACD) threatens to slow down the uptrend. By encouraging traders to close their positions.
MACD(Moving Average Convergence Divergence)가 소폭 하락하면 상승 추세가 둔화될 위험이 있습니다. 트레이더가 포지션을 마감하도록 장려합니다.

Shiba Inu Coin 가격 차트 | 트레이딩뷰
However, this condition may not hold or last considering the Money Flow Index (RSI) is neutral and rolling upwards, indicating that liquidity is increasing for another leg up. Several four-hour closes below the yellow support line could see BTC drop to retest the $60,000 level before resuming the uptrend backed by more buying pressure.
그러나 자금 흐름 지수(RSI)가 중립적이고 상승세를 보이고 있다는 점을 고려하면 이 조건은 유지되지 않거나 지속되지 않을 수 있습니다. 이는 유동성이 또 다른 상승을 위해 증가하고 있음을 나타냅니다. 노란색 지지선 아래에서 4시간 동안 여러 번 마감하면 BTC가 하락하여 $60,000 수준을 다시 테스트한 후 더 많은 구매 압력으로 뒷받침되는 상승 추세를 재개할 수 있습니다.
3. XRP
3. XRP
While a majority of major coins rallied in tandem with Bitcoin, the XRP price showcased waning bullish momentum this week. From the last swing low of $0.534, the coin price jumped 11% to current trade at $0.59.
대부분의 주요 코인이 비트코인과 함께 상승세를 보인 반면 XRP 가격은 이번 주에 약세 모멘텀을 보였습니다. 지난 스윙 최저치인 $0.534에서 코인 가격은 현재 $0.59로 11% 급등했습니다.
The sixth-largest cryptocurrency XRP has been riding a slow yet steady recovery since last month under the influence of an ascending trendline. The dynamic support uplifted the asset during minor dips keeping the recovery intact to reach $0.59 as the press time.
6위 암호화폐 XRP는 상승 추세선의 영향으로 지난 달부터 느리지만 꾸준한 회복세를 타고 있습니다. 동적 지원은 약간의 하락 중에 자산을 끌어 올려 회복을 그대로 유지하여 보도 시점에 $0.59에 도달했습니다.
If the buyers fail to sustain above the breached trendline, the XRP price may fall back to the lower trendline to recuperate strength. Until the rising support is intact, the traders can prolong the ongoing recovery trend.
구매자가 위반된 추세선 이상을 유지하지 못하면 XRP 가격은 강세를 회복하기 위해 더 낮은 추세선으로 떨어질 수 있습니다. 상승하는 지원이 그대로 유지될 때까지 트레이더는 진행 중인 회복 추세를 연장할 수 있습니다.
4. Dogecoin (DOGE)
4. 도지코인(DOGE)
The cryptocurrency market witnessed an aggressive bullish trend in late February as massive inflows from the spot ETF uplifted the underlying asset BTC. In tandem with the Bitcoin price rally, the altcoins prolonged their recovery trend, including Dogecoin which rose from $0.082 to $0.1, registering 48.5% growth. This swing provides a massive breakout from the long-coming triangle pattern indicating a major shift in market dynamics.
암호화폐 시장은 2월 말 현물 ETF로부터의 대규모 자금 유입으로 인해 기초 자산인 BTC가 상승하면서 공격적인 강세 추세를 보였습니다. 비트코인 가격 상승과 함께 알트코인도 회복세를 이어갔고, 도지코인은 0.082달러에서 0.1달러로 상승해 48.5% 성장을 기록했다. 이 스윙은 시장 역학의 주요 변화를 나타내는 장기적 삼각형 패턴에서 대규모 이탈을 제공합니다.
An analysis of the daily time frame chart shows the Dogecoin price has been traveling a sideways trend for the past 22 months. This lateral movement confined within two converging trendlines indicates the formation of a symmetrical triangle pattern.
일일 시간대 차트 분석에 따르면 Dogecoin 가격은 지난 22개월 동안 횡보 추세를 보였습니다. 두 개의 수렴 추세선 내에 국한된 이러한 측면 움직임은 대칭 삼각형 패턴이 형성되었음을 나타냅니다.
In theory, this chart pattern developed to indicate the notable period of consolidation whose result determined the dominant force in the market. Amid the recent upsurge in the crypto market, the DOGE price gave a decisive breakout from the upper boundary signal, the buyers are regaining control over this asset.
이론적으로 이 차트 패턴은 시장의 지배력을 결정짓는 주목할 만한 통합 기간을 나타내기 위해 개발되었습니다. 최근 암호화폐 시장이 급등하는 가운데 DOGE 가격이 상한 신호에서 결정적인 이탈을 가져왔고 구매자는 이 자산에 대한 통제권을 다시 되찾고 있습니다.
Related Articles
관련 기사
-
3 Under $1 Bargain Altcoins To Turn $10 Into $100 In March
3월에 10달러를 100달러로 바꾸는 1달러 미만 할인 알트코인 3개
-
Bitcoin Price Rally Likely Due to Bullish Sentiments Than “FOMO” Belief
“FOMO” 믿음보다 낙관적 감정으로 인해 비트코인 가격 상승 가능성이 높음
-
Cardano’s Network Strengthens with 10 Millionth Block
Cardano의 네트워크는 천만 번째 블록으로 강화됩니다.
- About author
- Disclaimer
저자 소개
부인 성명
제시된 내용은 작성자의 개인적인 의견이 포함될 수 있으며 시장 상황에 따라 달라질 수 있습니다. 암호화폐에 투자하기 전에 시장 조사를 하십시오. 저자나 출판물은 귀하의 개인적인 재정적 손실에 대해 어떠한 책임도 지지 않습니다.


 DogeHome
 Optimisus
 Crypto News Land
 Optimisus
 Cryptopolitan_News
 Cryptopolitan
 crypto.ro English


✓ 공유: