Bitcoin price made a surprise move this week blasting to $64,000 from an important support area above $50,000 on Monday. This massive uptick has changed both the short-term and long-term landscape of not only Bitcoin but also other crypto to HODL, including Shiba Inu (SHIB), Dogecoin (DOGE), and XRP.
ビットコイン価格は今週、月曜日の5万ドルを超える重要なサポートエリアから6万4000ドルまで急騰する驚きの動きを見せた。この大規模な上昇により、ビットコインだけでなく、柴犬 (SHIB)、ドージコイン (DOGE)、XRP などの他の暗号通貨の短期的および長期的な状況が HODL に変化しました。
The ETF happens to be the biggest market mover since the approval in January. With over $7.49 billion in cumulative total net inflow, demand for BTC is surging and sending Bitcoin price ballistic.
このETFはたまたま1月の承認以来、市場を動かす最大の要因となった。累計純流入額が74億9,000万ドルを超え、BTCの需要が急増し、ビットコインの価格が急騰している。
Although the rally was witnessed across the market, some altcoins like SHIB emerged as top gainers, increasing by more than 50% in a week.
市場全体で上昇が見られたものの、SHIBのような一部のアルトコインが値上がり率上位に浮上し、1週間で50%以上上昇した。
Investors will carefully gauge Bitcoin’s behavior in the next few days to ascertain the validity of the uptrend to $70,000 or a correction to collect liquidity for another major breakout.
投資家は今後数日間のビットコインの動向を慎重に見極め、7万ドルへの上昇トレンドの妥当性、または別の大きなブレイクアウトに向けた流動性を集めるための調整を見極めるだろう。
1. Bitcoin (BTC)
1. ビットコイン(BTC)
The supply and demand landscape for Bitcoin continues to change, driven by increasing ETF inflows. On top of this, investors are preferring to hold onto their BTC in anticipation of a larger breakout post-halving in February.
ETF流入の増加により、ビットコインの需要と供給の状況は変化し続けています。これに加えて、投資家は2月の半減期後のさらに大きなブレイクアウトを見越してBTCを保持することを好みます。
Bitcoin’s halving, which cuts miner rewards by half every four years. The last halving took place in 2020, placing the next event in 2024 around April.
ビットコインの半減期は、マイナーの報酬を 4 年ごとに半分に減らします。前回の半減期は 2020 年に行われ、次の半減期は 2024 年の 4 月頃となります。
In addition to giving Bitcoin its deflationary status, halving significantly reduces the amount of new coins joining the ecosystem. Remember miner rewards will come down to 3.125 BTC from the current 6.25 BTC.
ビットコインにデフレ状態を与えることに加えて、半減により、エコシステムに参加する新しいコインの量が大幅に減少します。マイナーの報酬は現在の 6.25 BTC から 3.125 BTC に下がることに注意してください。
It is this gradual decrease in supply coupled with demand increasing or staying the same that tends to drive Bitcoin price parabolically higher. The ETF is also expected to have a major impact on BTC as demand soars.
この供給の緩やかな減少と需要の増加または需要の変化が、ビットコインの価格を放物線状に上昇させる傾向があります。需要の急増に伴い、ETFはBTCにも大きな影響を与えると予想されている。

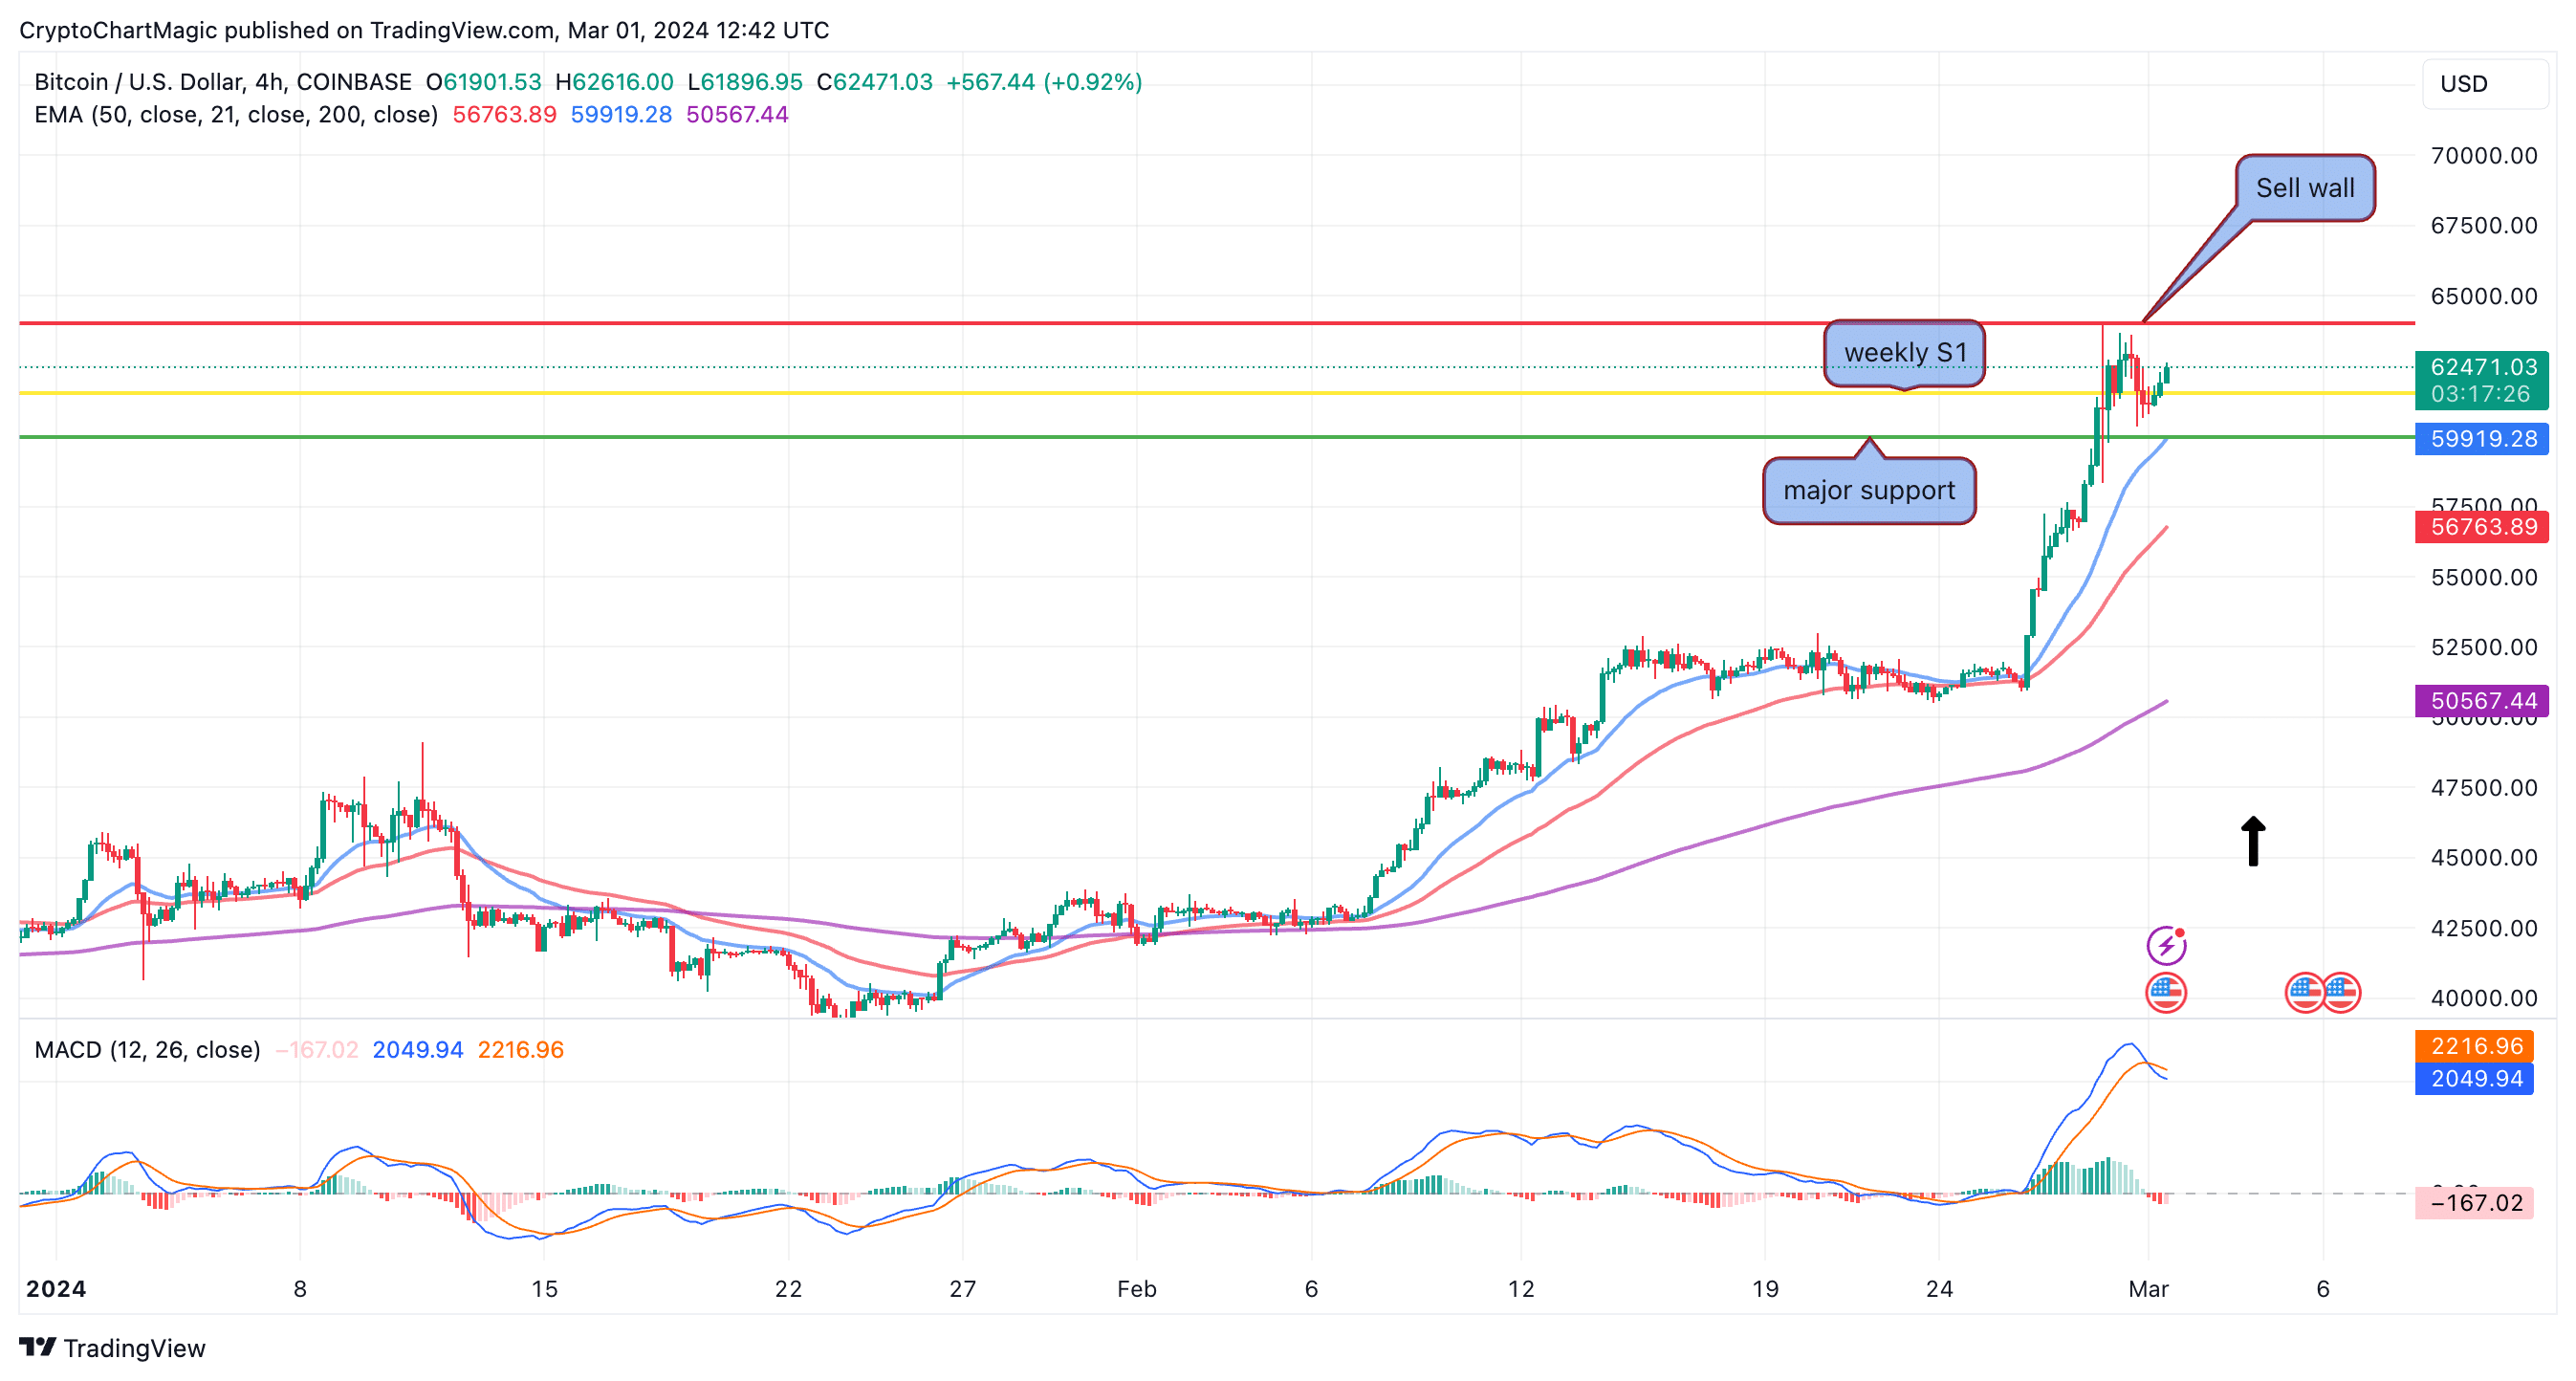
ビットコイン価格予測チャート |トレーディングビュー
The area at $63,000 represents a sell wall that must be weakened to allow for gains above $64,000 (the red line on the chart). A break above this would trigger more FOMO with market participants targeting a sweep of the all-time high followed by a leg up beyond $70,000.
63,000 ドルのエリアは、64,000 ドルを超える利益を可能にするために弱める必要がある売りの壁を表しています (チャート上の赤い線)。これを上抜ければ、市場参加者は史上最高値を一掃し、その後7万ドルを超えて上昇することを目標にしており、さらなるFOMOが引き起こされるだろう。
2. Shiba Inu (SHIB)
2. Shiba Inu (SHIB)
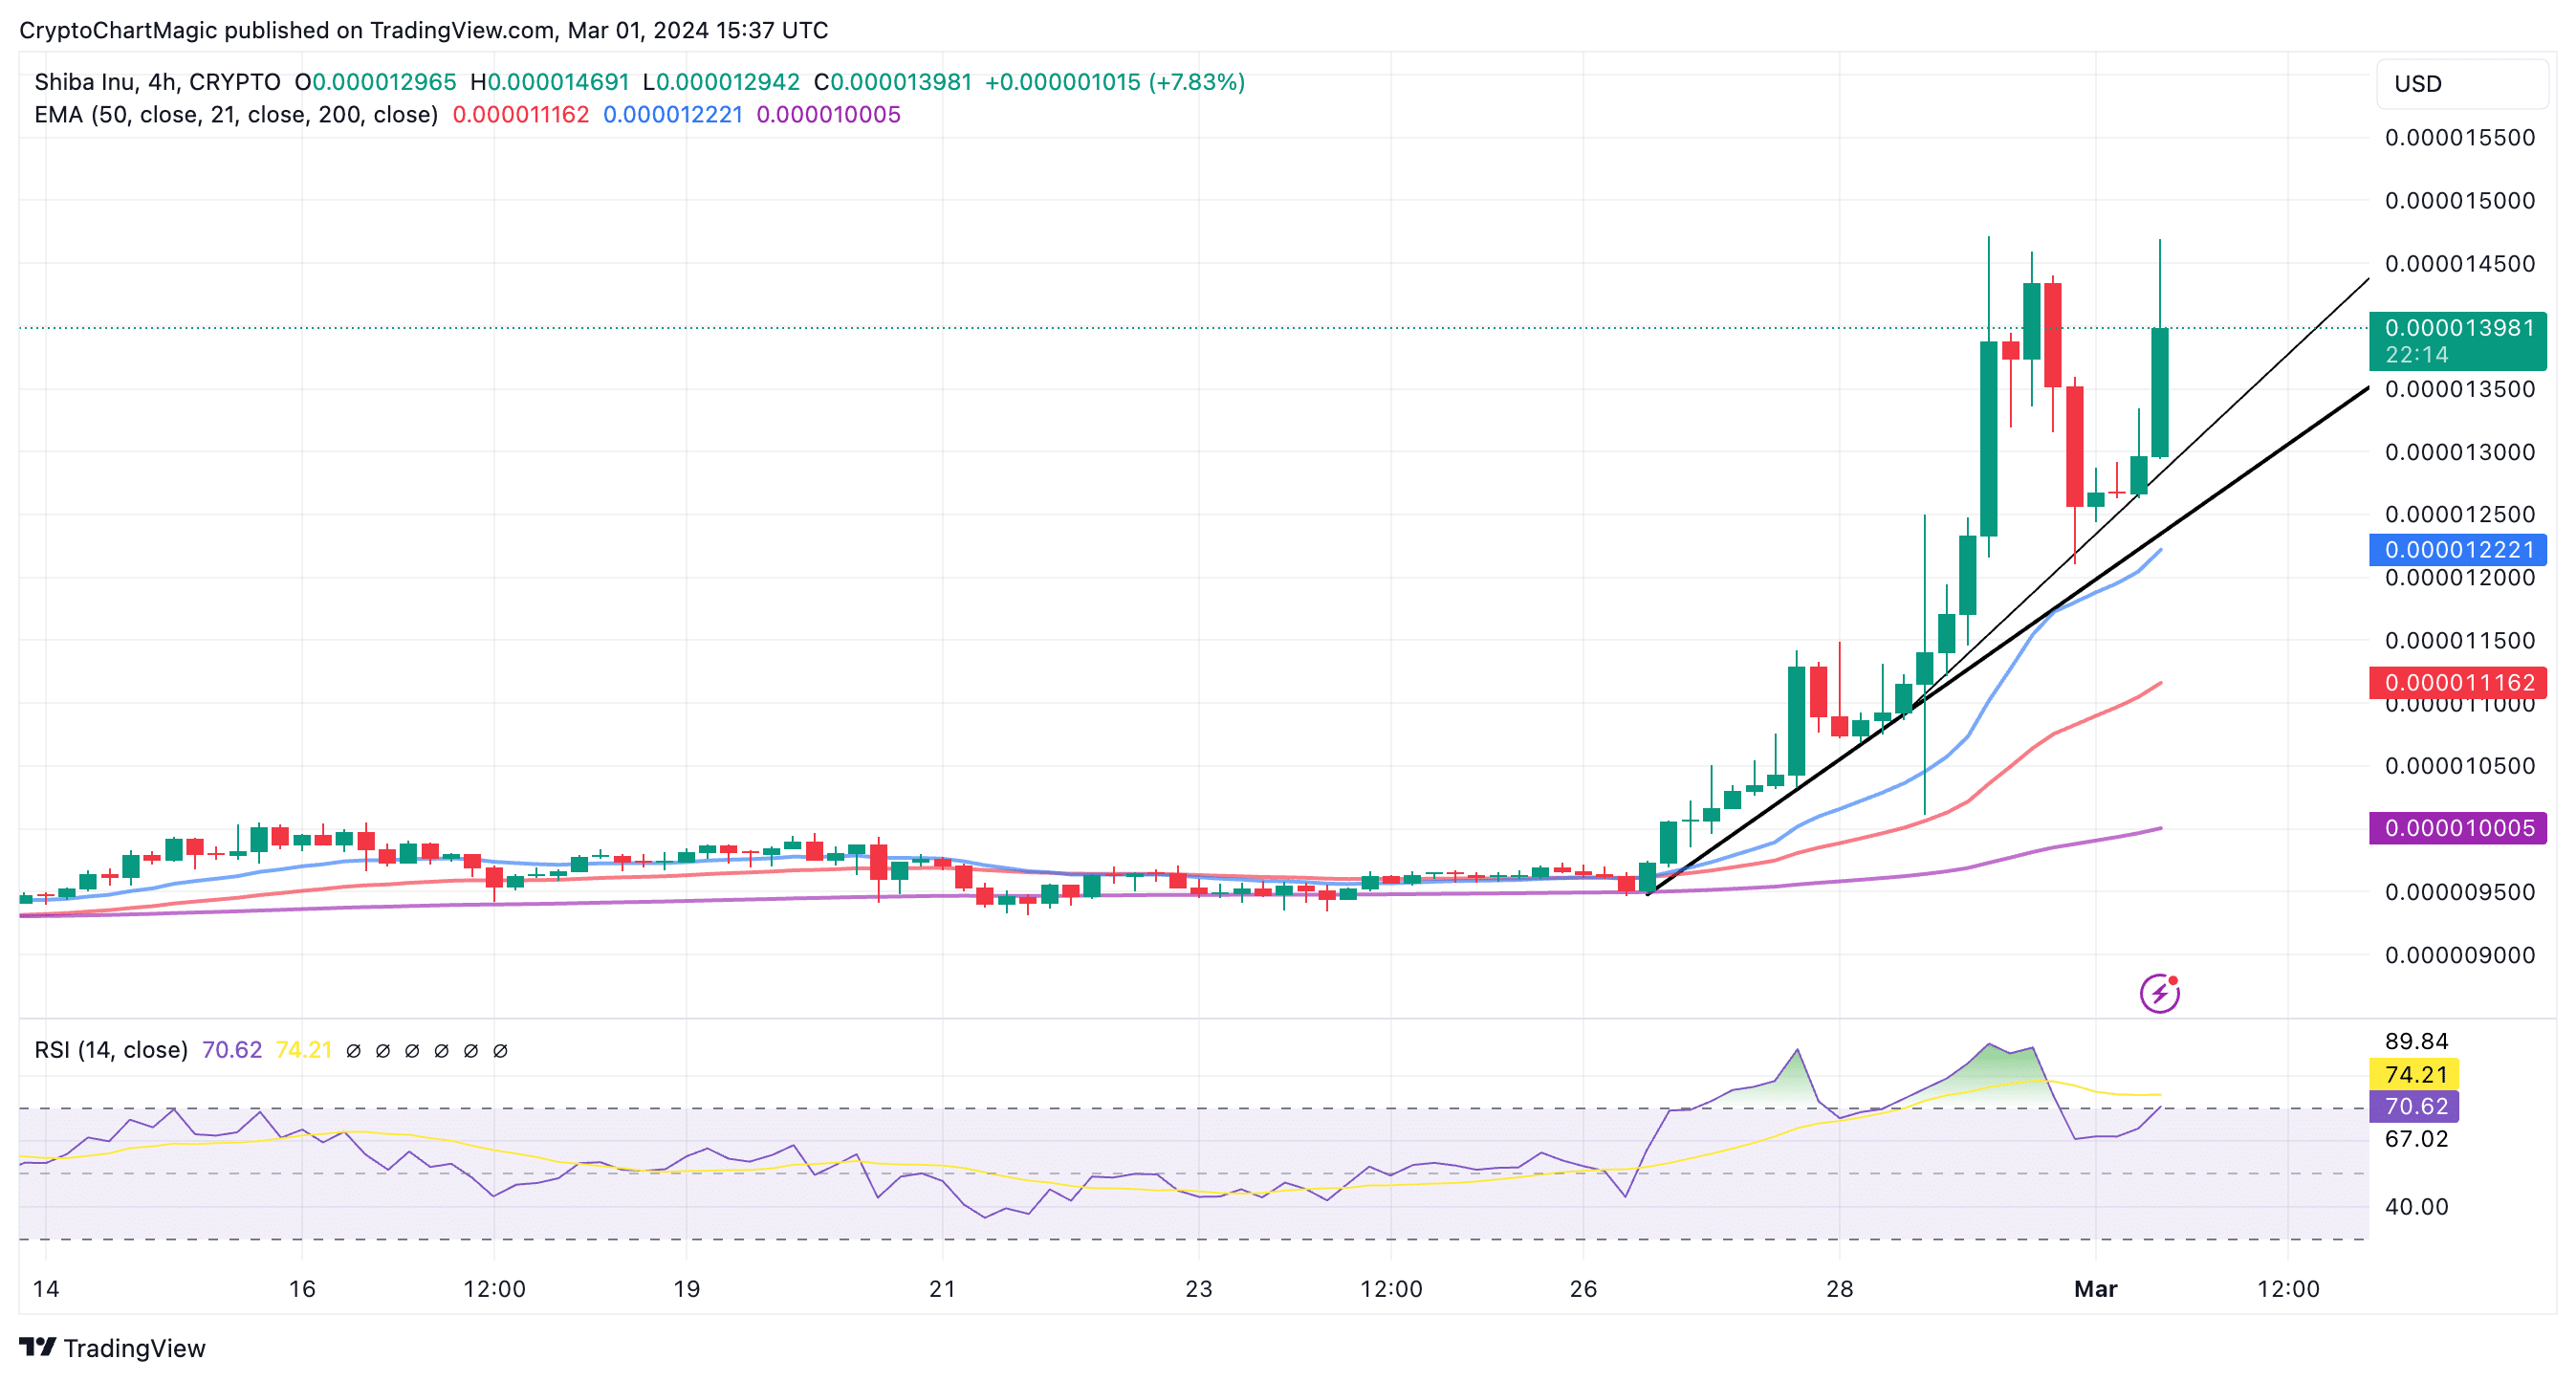
Like many cryptocurrencies in the market, Shiba Inu Coin faced increasing uncertainty in January, resulting in a correction below the $0.00001 level. The meme coin swept liquidity at $0.0000082 — 2024’s lowest point followed by a steady consolidation above $0.000009 ahead of this week’s massive breakout to $0.00001467.
市場の多くの仮想通貨と同様に、Shiba Inu Coin は 1 月に不確実性の増大に直面し、その結果、0.00001 ドルのレベルを下回る修正となりました。ミームコインは、2024年の最低点である0.0000082ドルで流動性を席巻し、その後、今週の0.00001467ドルまでの大規模なブレイクアウトに先立って、0.000009ドルを超える着実な統合が続きました。
A minor dip in the Moving Average Convergence Divergence (MACD) threatens to slow down the uptrend. By encouraging traders to close their positions.
移動平均収束ダイバージェンス(MACD)がわずかに低下すると、上昇トレンドが鈍化する恐れがあります。トレーダーにポジションを閉じるよう促すことによって。

柴犬コイン価格チャート |トレーディングビュー
However, this condition may not hold or last considering the Money Flow Index (RSI) is neutral and rolling upwards, indicating that liquidity is increasing for another leg up. Several four-hour closes below the yellow support line could see BTC drop to retest the $60,000 level before resuming the uptrend backed by more buying pressure.
ただし、マネーフロー指数(RSI)が中立で上昇傾向にあり、次のレグアップに向けて流動性が増加していることを示すと、この状況は維持されないか持続しない可能性があります。黄色のサポートラインを下回る4時間終値が数回あれば、BTCが下落して60,000ドルの水準を再テストし、その後さらなる買い圧力に支えられて上昇傾向が再開される可能性がある。
3. XRP
3.XRP
While a majority of major coins rallied in tandem with Bitcoin, the XRP price showcased waning bullish momentum this week. From the last swing low of $0.534, the coin price jumped 11% to current trade at $0.59.
今週は主要コインの大部分がビットコインと連動して上昇したが、XRP価格は強気の勢いが衰えていることを示した。前回のスイング安値の0.534ドルから、コイン価格は11%上昇し、現在の取引では0.59ドルとなった。
The sixth-largest cryptocurrency XRP has been riding a slow yet steady recovery since last month under the influence of an ascending trendline. The dynamic support uplifted the asset during minor dips keeping the recovery intact to reach $0.59 as the press time.
6 番目に大きい仮想通貨 XRP は、上昇トレンドラインの影響を受けて先月以来、ゆっくりではありますが着実な回復を続けています。ダイナミックなサポートにより、マイナーな下落時に資産が上昇し、回復を維持し、本記事の時点で0.59ドルに達しました。
If the buyers fail to sustain above the breached trendline, the XRP price may fall back to the lower trendline to recuperate strength. Until the rising support is intact, the traders can prolong the ongoing recovery trend.
買い手が突破されたトレンドラインを上回って維持できなかった場合、XRP価格は強さを回復するために下側のトレンドラインに戻る可能性があります。上昇するサポートが損なわれないまで、トレーダーは進行中の回復傾向を長引かせることができる。
4. Dogecoin (DOGE)
4.ドージコイン(DOGE)
The cryptocurrency market witnessed an aggressive bullish trend in late February as massive inflows from the spot ETF uplifted the underlying asset BTC. In tandem with the Bitcoin price rally, the altcoins prolonged their recovery trend, including Dogecoin which rose from $0.082 to $0.1, registering 48.5% growth. This swing provides a massive breakout from the long-coming triangle pattern indicating a major shift in market dynamics.
スポットETFからの大量の流入が原資産BTCを押し上げたため、仮想通貨市場は2月下旬に積極的な強気トレンドを目撃した。ビットコイン価格の上昇と並行して、アルトコインも回復傾向を延長し、その中にはドージコインが0.082ドルから0.1ドルに上昇し、48.5%の成長を記録した。このスイングは、長年のトライアングルパターンからの大規模なブレイクアウトをもたらし、市場力学の大きな変化を示しています。
An analysis of the daily time frame chart shows the Dogecoin price has been traveling a sideways trend for the past 22 months. This lateral movement confined within two converging trendlines indicates the formation of a symmetrical triangle pattern.
日次時間枠チャートを分析すると、ドージコイン価格が過去 22 か月間横ばいの傾向を示していることがわかります。 2 つの収束傾向線内に限定されたこの横方向の動きは、対称的な三角形パターンの形成を示しています。
In theory, this chart pattern developed to indicate the notable period of consolidation whose result determined the dominant force in the market. Amid the recent upsurge in the crypto market, the DOGE price gave a decisive breakout from the upper boundary signal, the buyers are regaining control over this asset.
理論的には、このチャート パターンは、その結果が市場の支配力を決定した注目すべき統合期間を示すために開発されました。最近の暗号通貨市場の高騰のさなか、DOGE価格は上限シグナルを決定的に突破し、買い手はこの資産に対するコントロールを取り戻しつつあります。
Related Articles
関連記事
-
3 Under $1 Bargain Altcoins To Turn $10 Into $100 In March
3 つの 1 ドル未満のお買い得アルトコインが 3 月に 10 ドルを 100 ドルに変える
-
Bitcoin Price Rally Likely Due to Bullish Sentiments Than “FOMO” Belief
ビットコイン価格の上昇は「FOMO」信念よりも強気な感情による可能性が高い
-
Cardano’s Network Strengthens with 10 Millionth Block
Cardano のネットワークが 1,000 万ブロックで強化
- About author
- Disclaimer
著者について
免責事項
掲載されている内容には著者の個人的な意見が含まれている場合があり、市場の状況に左右される場合があります。暗号通貨に投資する前に市場調査を行ってください。著者または出版物は、あなたの個人的な経済的損失に対して一切の責任を負いません。


 Coincu
 Crypto Intelligence
 Optimisus
 DogeHome
 ItsBitcoinWorld
 Optimisus
 Inside Bitcoins
 CoinDesk
 Crypto Daily™


✓ 共有: