

Bitcoin (BTC) bulls are in no mood to let go of their advantage. They pierced the $70,000 mark on March 11, signaling continued demand from the traders. Bitwise chief investment officer Matt Hougan said in a memo to investors that professional investors were waiting to buy Bitcoin exchange-traded funds (ETFs).
비트코인(BTC) 상승세는 자신의 이점을 포기할 기분이 아닙니다. 그들은 3월 11일에 70,000달러를 돌파하여 거래자들의 지속적인 수요를 예고했습니다. Bitwise의 최고 투자 책임자인 Matt Hougan은 투자자들에게 보낸 메모에서 전문 투자자들이 비트코인 상장지수펀드(ETF)를 구매하기를 기다리고 있다고 말했습니다.
However, that has not held back the demand for Bitcoin ETFs. According to data from Dune, the spot Bitcoin ETFs have accumulated 4.06% of the current Bitcoin supply. If buying continues at the same rate, Bitcoin holdings of the ETFs are projected to reach 8.65% of the Bitcoin supply on a yearly basis.
그러나 이것이 비트코인 ETF에 대한 수요를 억제하지는 못했습니다. Dune의 데이터에 따르면 현물 비트코인 ETF는 현재 비트코인 공급량의 4.06%를 축적했습니다. 동일한 비율로 매수가 계속된다면 ETF의 비트코인 보유량은 연간 비트코인 공급량의 8.65%에 도달할 것으로 예상됩니다.
MicroStrategy founder and chairman Michael Saylor said in a X post that the firm had purchased 12,000 Bitcoin at an average price of $68,477, using the proceeds from the recently completed $800 million convertible note offering. After the latest purchase, MicroStrategy’s Bitcoin holdings stand at 205,000 Bitcoin acquired at an average price of $33,706 per Bitcoin.
MicroStrategy 창립자이자 회장인 Michael Saylor는 X 포스트에서 회사가 최근 완료된 8억 달러 규모의 전환사채 발행 수익금을 사용하여 평균 68,477달러의 가격으로 12,000개의 비트코인을 구입했다고 밝혔습니다. 최근 구매 이후 MicroStrategy의 비트코인 보유량은 비트코인당 평균 $33,706의 가격으로 획득한 205,000비트코인입니다.
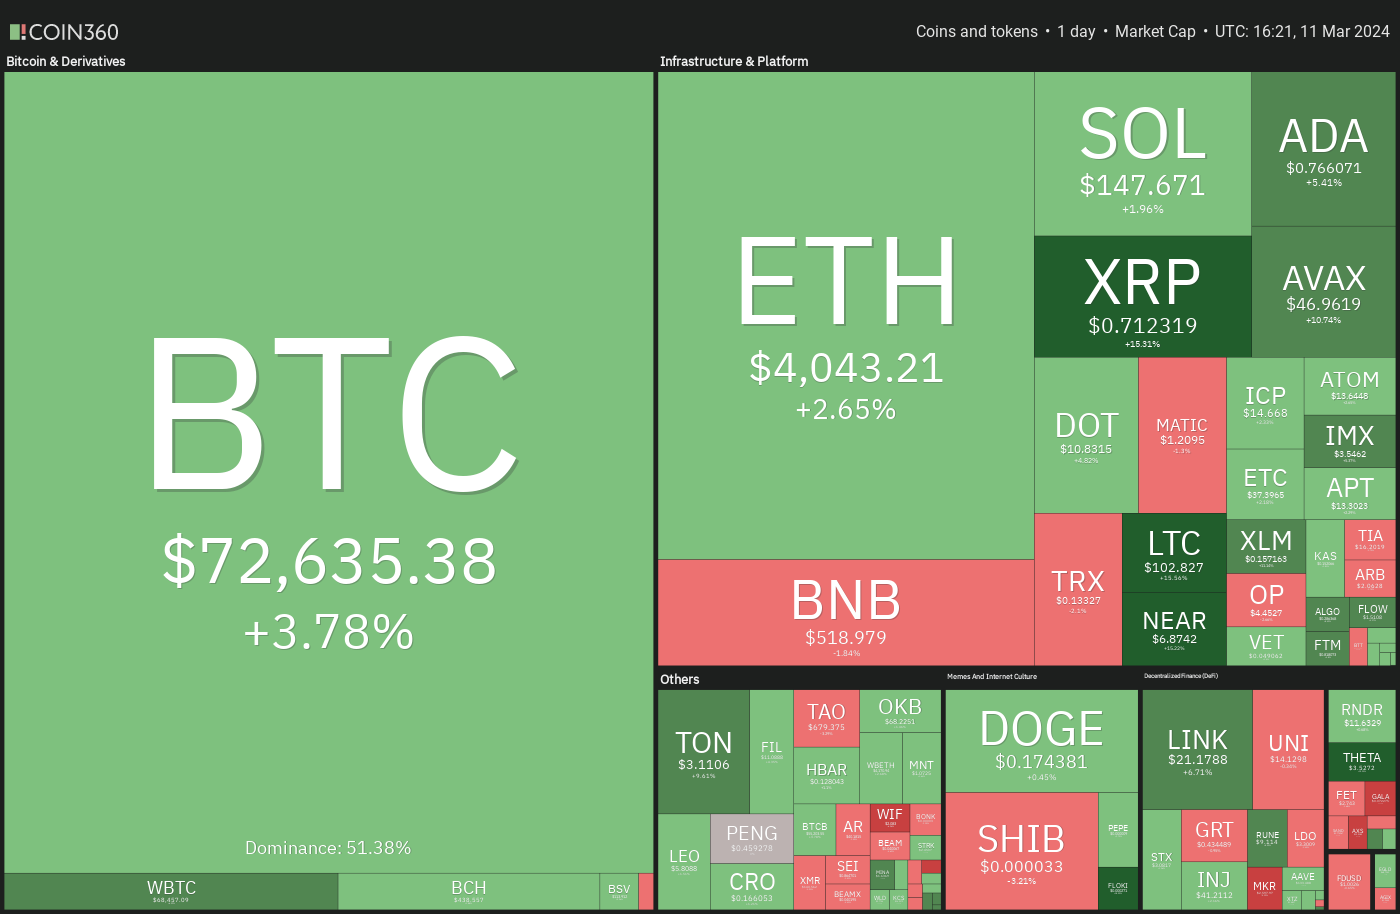
Traders will have to closely watch the Bitcoin ETF inflows because a sustained slowdown will hurt sentiment and may cause a correction. What are the important support levels to watch out for in Bitcoin and altcoins? Let’s analyze the charts to find out.
거래자들은 비트코인 ETF 유입을 면밀히 관찰해야 합니다. 왜냐하면 지속적인 경기 둔화는 정서를 손상시키고 조정을 초래할 수 있기 때문입니다. 비트코인과 알트코인에서 주의해야 할 중요한 지원 수준은 무엇입니까? 알아보기 위해 차트를 분석해 보겠습니다.
S&P 500 Index price analysis
S&P 500 지수 가격 분석
The S&P 500 Index has been rising inside an ascending channel pattern for several days. The price turned down from the resistance line of the channel on March 8, indicating that the bears are defending the level.
S&P 500 지수는 며칠 동안 상승 채널 패턴 내에서 상승했습니다. 3월 8일 채널의 저항선에서 가격이 하락하여 하락세가 수준을 방어하고 있음을 나타냅니다.
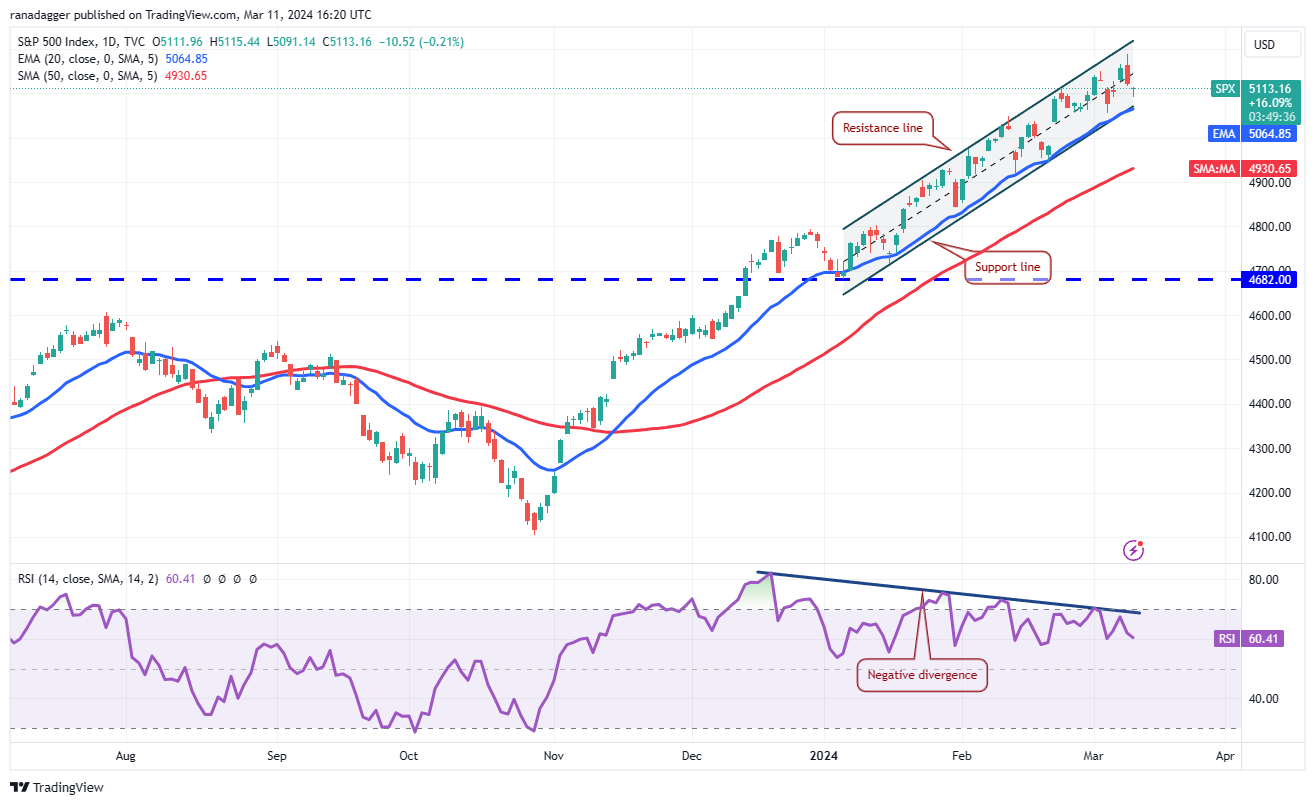
Although the upsloping moving averages indicate an advantage to buyers, the negative divergence on the relative strength index (RSI) cautions of a potential correction or consolidation in the near term. If bears sink the price below the channel, the selling could intensify, and the index may fall to the 50-day simple moving average (4,930).
상승하는 이동 평균은 구매자에게 이점을 나타내지만 상대강도지수(RSI)의 마이너스 다이버전스는 단기적으로 잠재적인 조정이나 통합을 경고합니다. 하락세가 채널 아래로 하락할 경우 매도세가 강화될 수 있으며 지수는 50일 단순 이동 평균(4,930)까지 하락할 수 있습니다.
Conversely, if the price turns up from the current level or the channel’s support line, it will indicate that the sentiment remains positive and traders are buying on every minor dip. The bulls will have to kick the price above the channel to start a sharp rally toward 5,350.
반대로, 가격이 현재 수준이나 채널의 지지선에서 상승한다면 이는 정서가 여전히 긍정적이고 트레이더가 소폭 하락할 때마다 매수하고 있음을 나타냅니다. 상승세가 5,350을 향해 급격한 상승세를 시작하려면 채널 위로 가격을 올려야 할 것입니다.
U.S. Dollar Index price analysis
미국 달러 지수 가격 분석
The U.S.dollar Index (DXY) slipped below the 20-day EMA (103) on March 1, and the bears successfully defended the level during subsequent attempts by the bulls to push the price above it. The failure to rise above the 20-day EMA accelerated selling on March 6.
미국 달러 지수(DXY)는 3월 1일 20일 EMA(103) 아래로 떨어졌고, 하락세는 이후 가격을 그 이상으로 끌어올리려는 시도 동안 하락세를 성공적으로 방어했습니다. 20일 EMA를 초과하지 못하여 3월 6일 매도가 가속화되었습니다.
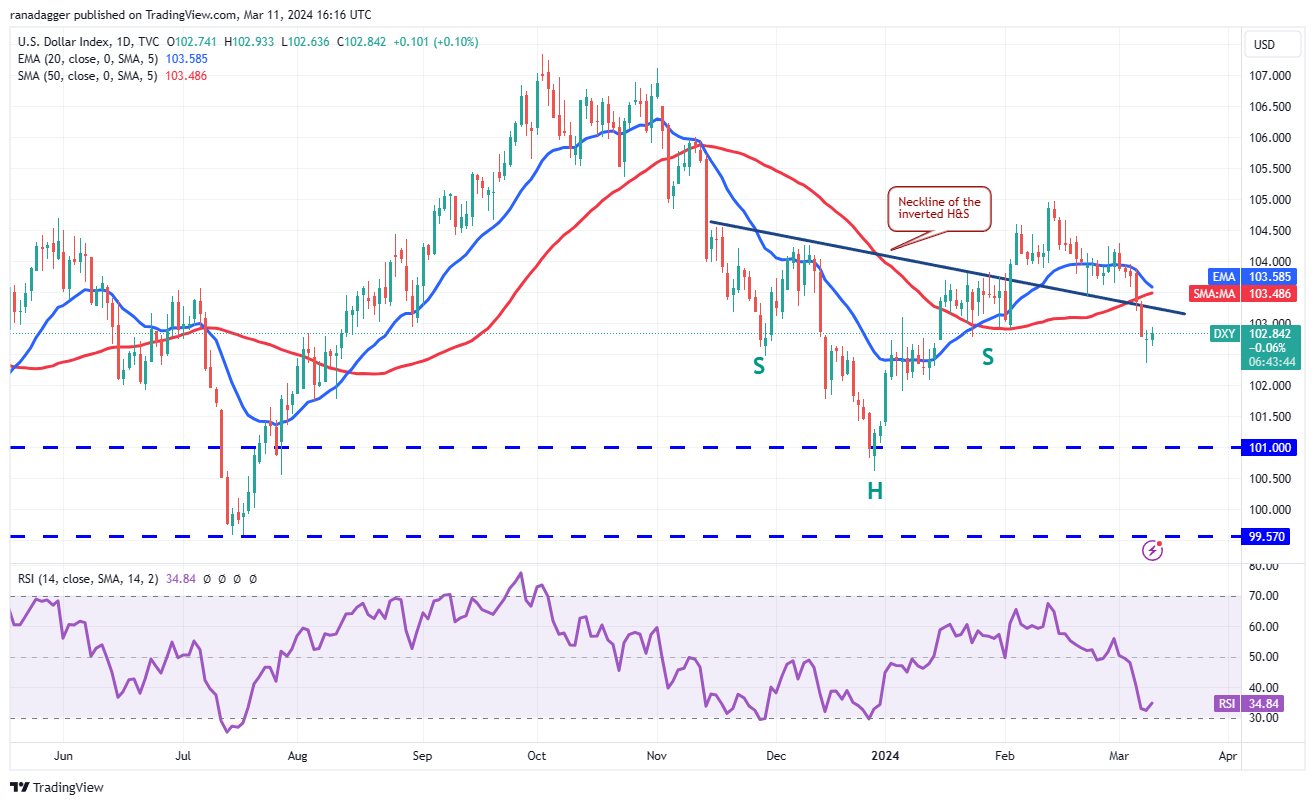
Sellers pulled the price back below the 50-day SMA (103) and the neckline of the inverse head-and-shoulders pattern on March 7. The moving averages are on the verge of a bearish crossover, and the RSI is near the oversold zone, indicating that bears have the edge. The index could skid to 102 and eventually to 101.
판매자들은 3월 7일 가격을 50일 SMA(103)와 역 헤드앤숄더 패턴의 네크라인 아래로 되돌렸습니다. 이동평균은 약세 교차 직전에 있고 RSI는 과매도 영역 근처에 있습니다. , 이는 곰이 우위에 있음을 나타냅니다. 지수는 102까지 하락하다가 결국 101까지 떨어질 수 있습니다.
Any recovery attempt is likely to face selling at the 20-day EMA. A rise above the 20-day EMA will be the first sign that the selling pressure may be reducing. The index could then rise to 105.
모든 회복 시도는 20일 EMA에서 매도될 가능성이 높습니다. 20일 EMA가 상승하면 매도 압력이 줄어들 수 있다는 첫 번째 신호가 될 것입니다. 그러면 지수는 105까지 오를 수 있습니다.
Bitcoin price analysis
비트코인 가격 분석
Bitcoin struggled to break above $70,000 during the weekend but blasted above the level on March 11, indicating solid demand from the bulls.
비트코인은 주말 동안 70,000달러를 돌파하는 데 어려움을 겪었지만 3월 11일 수준을 넘어 폭발적으로 상승하여 강세장의 탄탄한 수요를 나타냈습니다.
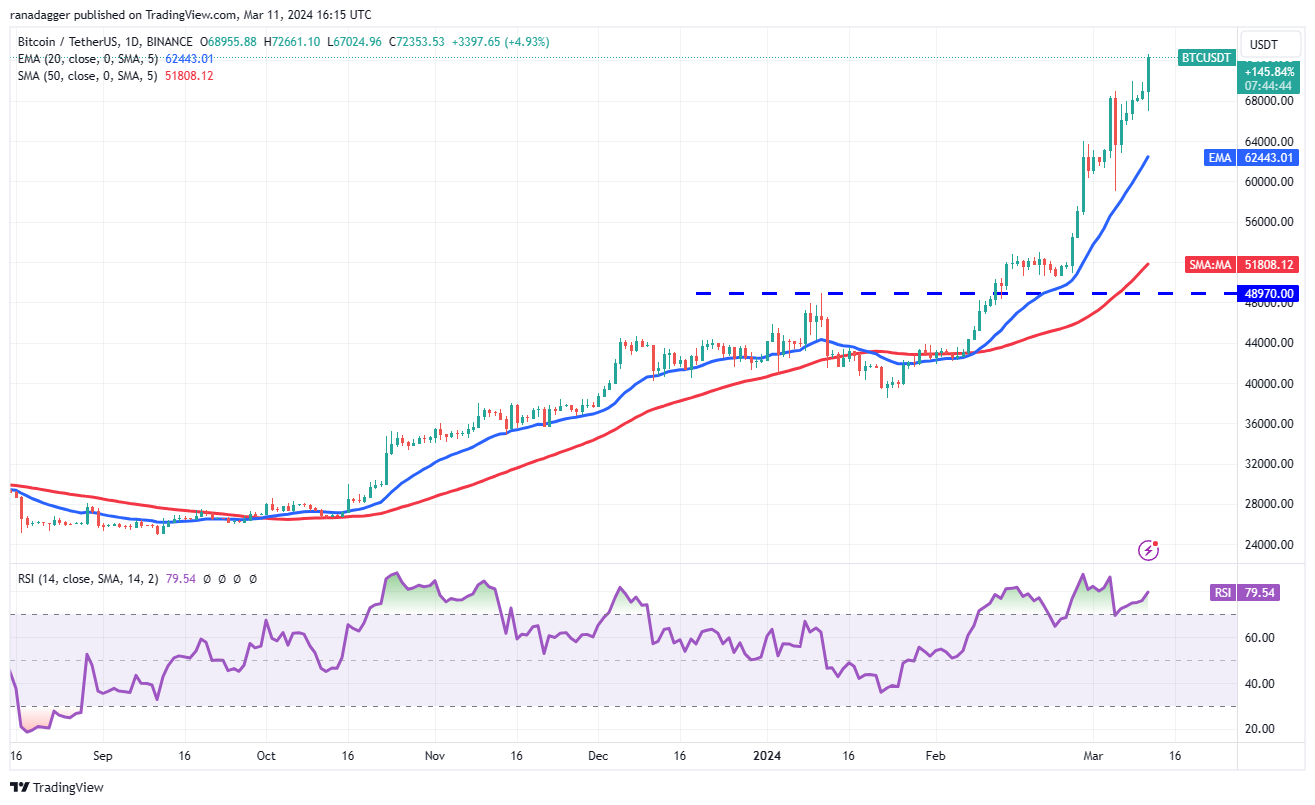
The rising moving averages and the RSI in the overbought zone show that the buyers are in control. The BTC/USDT pair could reach $76,000 and subsequently $80,000. This zone is likely to offer strong resistance to the bulls.
상승하는 이동 평균과 과매수 구역의 RSI는 구매자가 통제권을 갖고 있음을 보여줍니다. BTC/USDT 쌍은 $76,000, 이후 $80,000에 도달할 수 있습니다. 이 구역은 황소에 대한 강력한 저항을 제공할 가능성이 높습니다.
It is difficult to call a top in an asset when it is backed by strong momentum. The first sign of weakness will be a break and close below the 20-day EMA ($62,443). That will signal profit booking by the bulls and may start a deeper pullback.
강력한 모멘텀이 뒷받침되는 자산에서는 최고점을 찾기가 어렵습니다. 약세의 첫 번째 징후는 20일 EMA($62,443) 아래에서 중단 및 마감되는 것입니다. 이는 황소의 이익 예약을 알리고 더 깊은 하락세를 시작할 수 있습니다.
Ether price analysis
이더 가격 분석
The bears tried to pull Ether (ETH) toward the breakout level of $3,600, but the long tail on the March 11 candlestick shows aggressive buying at lower levels.
하락세는 Ether(ETH)를 $3,600 돌파 수준으로 끌어올리려고 시도했지만 3월 11일 캔들스틱의 긴 꼬리는 낮은 수준에서 공격적인 매수를 보여줍니다.
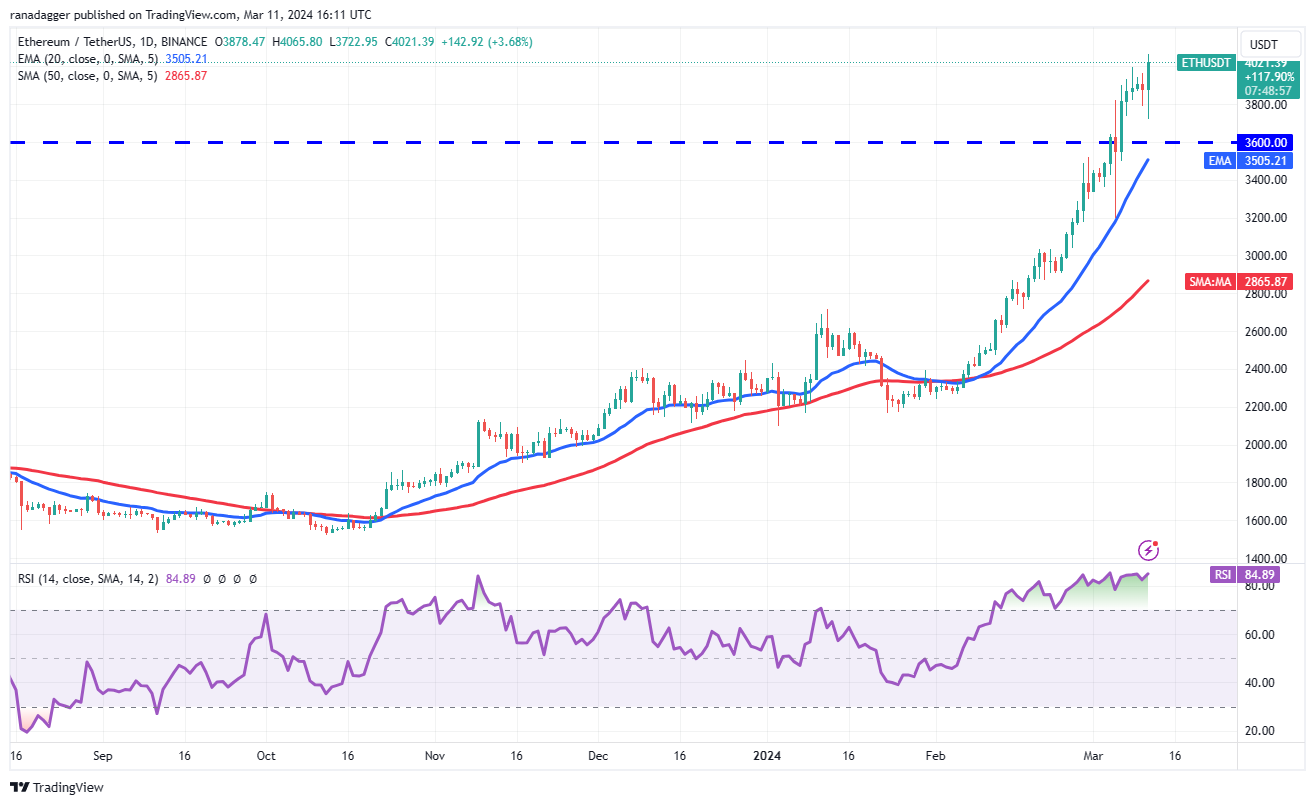
Buyers have pushed the price above the psychological level of $4,000. That opens the doors for a rally to $4,372, which may act as a minor hurdle, but if this resistance is crossed, the ETH/USDT pair could jump to $4,868.
구매자들은 가격을 심리적 수준인 4,000달러 이상으로 올렸습니다. 이는 작은 장애물로 작용할 수 있는 4,372달러까지 반등할 수 있는 문을 열지만, 이 저항선을 넘으면 ETH/USDT 쌍이 4,868달러까지 뛰어오를 수 있습니다.
The sharp up move of the past few days has pushed the RSI into deep overbought territory, signaling caution. Sellers will have to drag the price below the 20-day EMA ($3,505) to break the bullish momentum. The pair may then start a corrective phase.
지난 며칠간 급격한 상승세로 인해 RSI가 깊은 과매수 영역에 진입하면서 주의가 필요해졌습니다. 판매자는 강세 모멘텀을 깨기 위해 가격을 20일 EMA(3,505달러) 아래로 끌어내야 합니다. 그런 다음 쌍은 수정 단계를 시작할 수 있습니다.
BNB price analysis
BNB 가격 분석
BNB (BNB) has been in a strong uptrend for several days. The momentum picked up further after buyers pushed the price above $460.
BNB(BNB)는 며칠 동안 강한 상승세를 보였습니다. 구매자가 가격을 460달러 이상으로 올리자 모멘텀은 더욱 높아졌습니다.
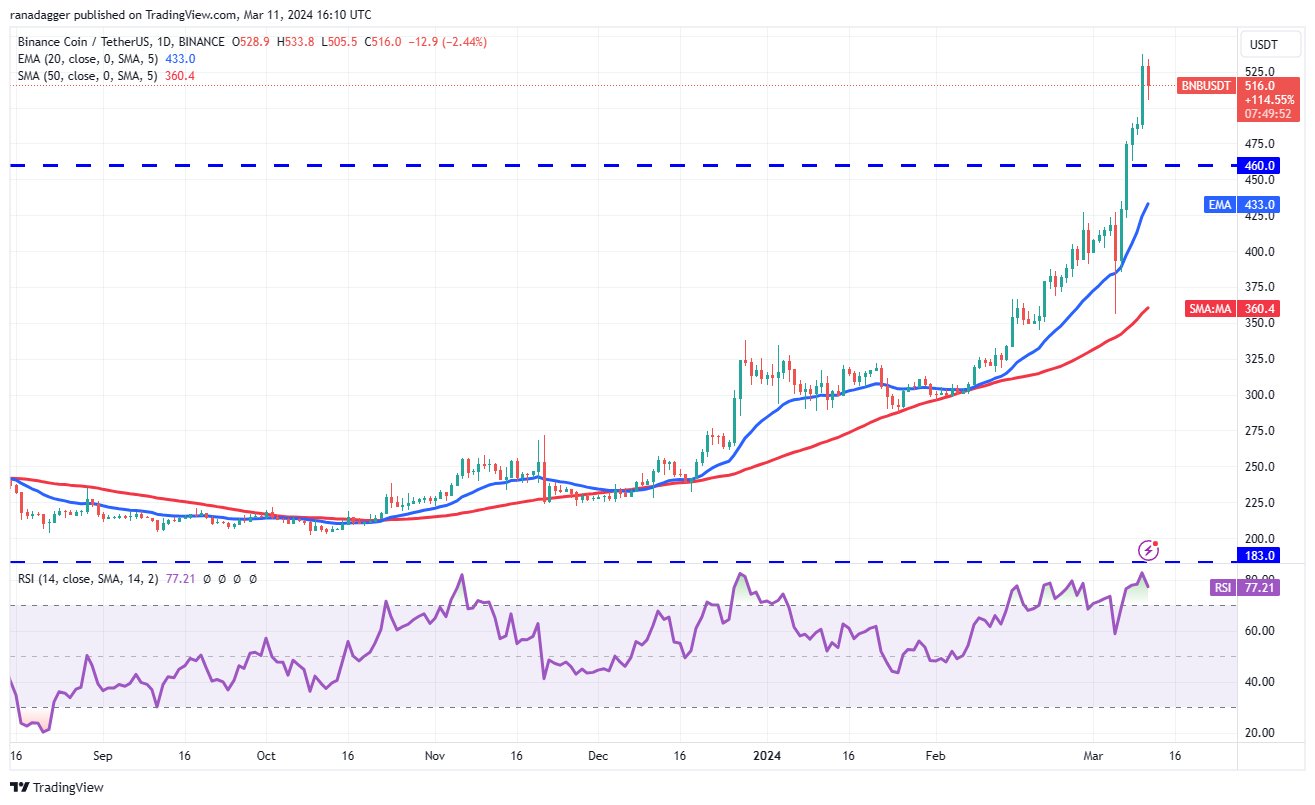
The BNB/USDT pair is likely to reach $560, which may act as a stiff resistance in the short term. If bulls do not give up much ground from $560, the uptrend may continue. The pair may then climb to $617.
BNB/USDT 쌍은 560달러에 도달할 가능성이 높으며 이는 단기적으로 강력한 저항으로 작용할 수 있습니다. 황소가 560달러에서 큰 폭의 지지를 포기하지 않으면 상승 추세가 계속될 수 있습니다. 그러면 그 쌍은 $617까지 오를 수 있습니다.
The essential support on the downside is $460, and then the 20-day EMA ($433). Sellers will have to tug the price below the 20-day EMA to indicate that the uptrend may have ended in the short term.
하락에 대한 필수 지지선은 $460이고 그 다음에는 20일 EMA($433)입니다. 판매자는 상승 추세가 단기적으로 끝났음을 나타내기 위해 가격을 20일 EMA 아래로 끌어내야 합니다.
XRP price analysis
XRP 가격 분석
Repeated failure of the bears to sustain XRP (XRP) below the 20-day EMA ($0.60) may have attracted buyers on March 11.
20일 EMA($0.60) 미만으로 XRP(XRP)를 유지하지 못하는 하락세가 반복적으로 실패하여 3월 11일 구매자를 끌어 모았을 수 있습니다.
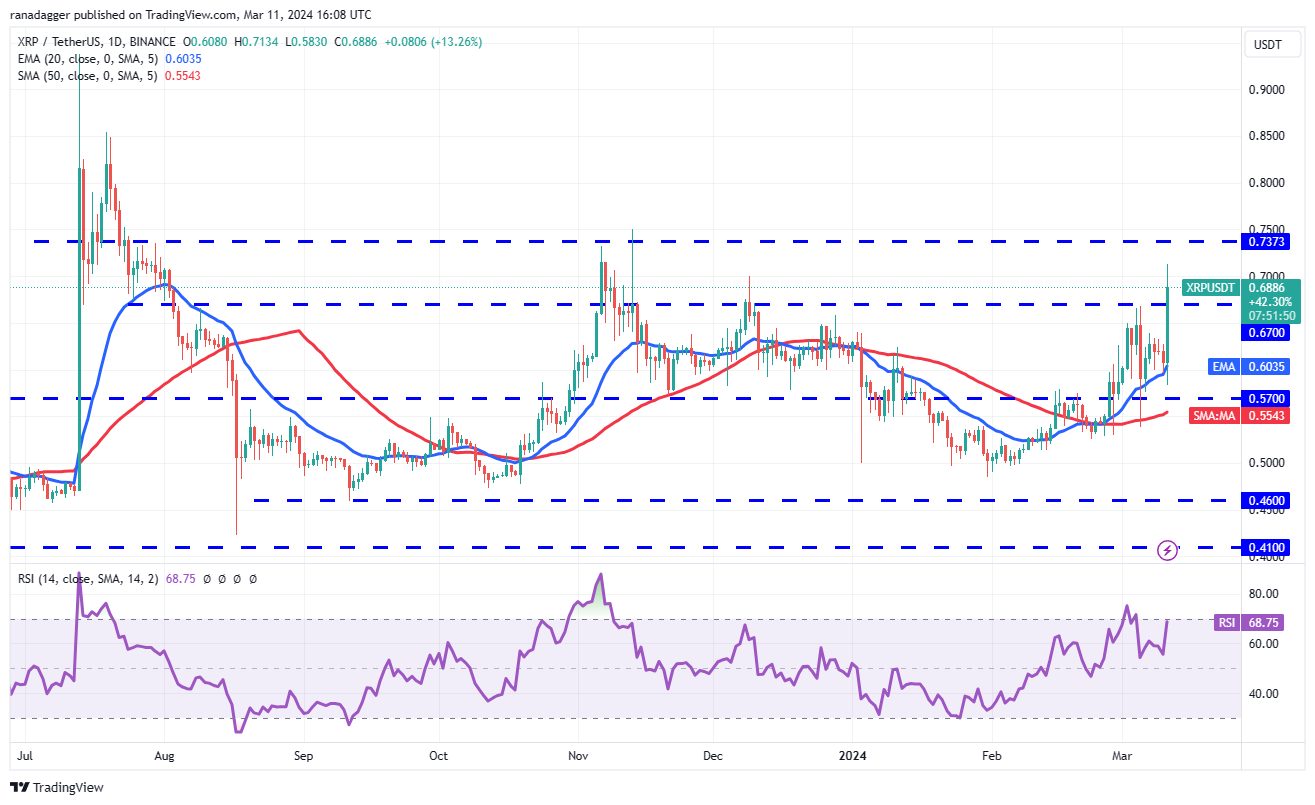
The bulls pushed the price above the immediate resistance of $0.67, indicating solid buying at lower levels. Buyers will try to maintain the momentum and challenge the formidable resistance at $0.74. If this level is scaled, it will indicate the start of a new uptrend. The XRP/USDT pair could rise to $0.85 and subsequently to $0.95.
상승세는 가격을 즉각적인 저항선인 0.67달러 위로 밀어 올렸으며, 이는 낮은 수준에서의 견고한 매수를 나타냅니다. 구매자는 모멘텀을 유지하고 $0.74의 강력한 저항에 도전하려고 노력할 것입니다. 이 수준이 조정되면 새로운 상승 추세의 시작을 나타냅니다. XRP/USDT 쌍은 $0.85까지 상승한 후 $0.95까지 상승할 수 있습니다.
Alternatively, if the price turns down from $0.74, it will suggest that the bears remain active at higher levels. The pair may then slide to the strong support at $0.67.
또는 가격이 0.74달러에서 하락하면 하락세가 더 높은 수준에서 계속 활동한다는 의미입니다. 그러면 해당 쌍은 $0.67의 강력한 지지선으로 미끄러질 수 있습니다.
Solana price analysis
솔라나 가격 분석
The bears are trying to start a correction in Solana (SOL), but the bulls are in no mood to relent. The shallow pullback shows a lack of sellers.
하락세는 솔라나(SOL)에서 조정을 시작하려고 하지만 상승세는 누그러질 기분이 아닙니다. 얕은 하락은 판매자가 부족하다는 것을 보여줍니다.
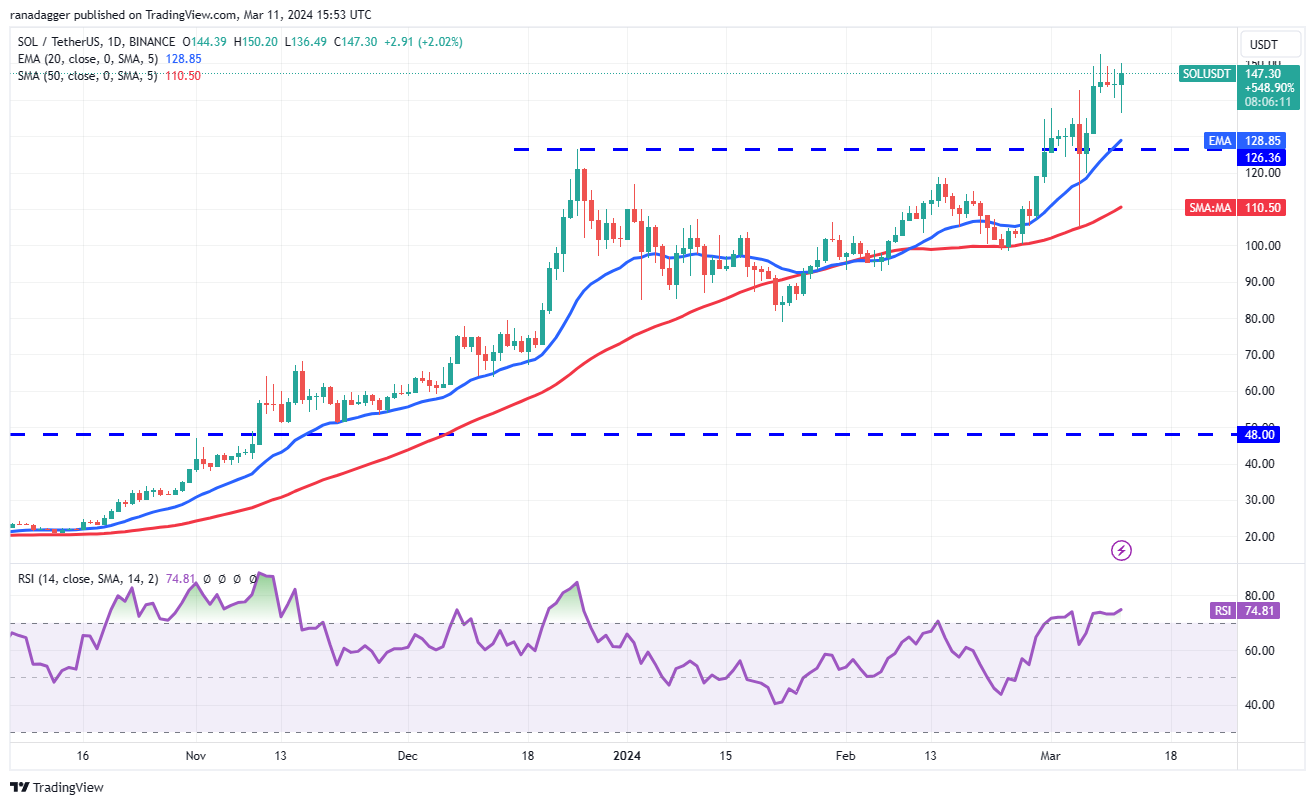
Buyers will take advantage of the situation and try to strengthen their position further by pushing the price above $153. If they do that, the SOL/USDT pair could resume the uptrend. The pair may then climb to $184.
구매자는 상황을 이용하여 가격을 153달러 이상으로 올려 자신의 입지를 더욱 강화하려고 노력할 것입니다. 그렇게 하면 SOL/USDT 쌍이 상승 추세를 재개할 수 있습니다. 그러면 그 쌍은 $184까지 오를 수 있습니다.
If bears want to prevent the upside, they will have to quickly yank the price below the breakout level of $126. That may accelerate selling, opening the doors for a drop to the 50-day SMA ($110).
하락세가 상승세를 막고 싶다면 가격을 돌파 수준인 $126 아래로 빠르게 끌어내려야 합니다. 이는 판매를 가속화하여 50일 SMA($110)로 하락할 수 있는 문을 열 수 있습니다.
Related: Why is Bitcoin price up today?
관련 항목: 오늘 비트코인 가격이 상승한 이유는 무엇입니까?
Cardano price analysis
카르다노 가격 분석
Cardano (ADA) dipped to the breakout level of $0.68 on March 11, but the long tail on the candlestick shows solid buying at lower levels.
Cardano(ADA)는 3월 11일 돌파 수준인 $0.68까지 떨어졌지만 캔들스틱의 롱테일은 낮은 수준에서 견고한 매수를 보여줍니다.
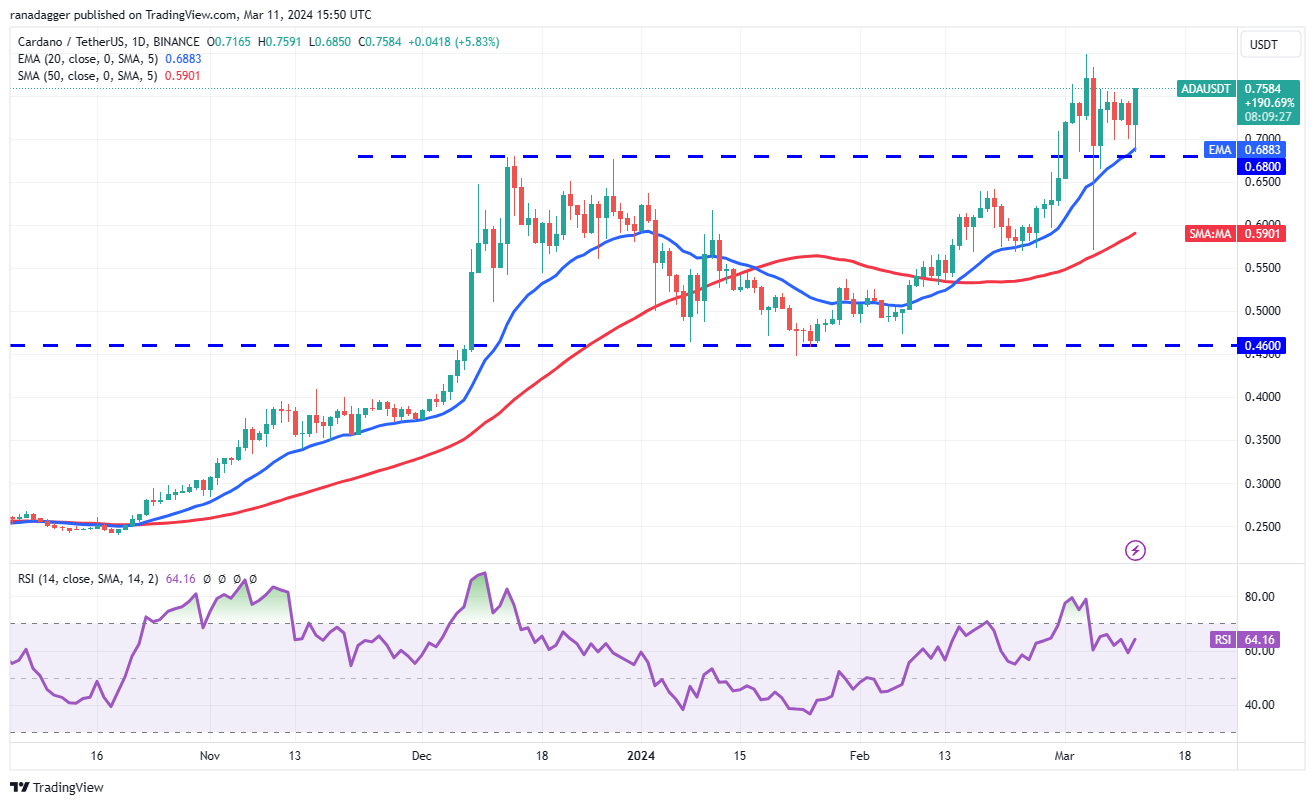
The upsloping 20-day EMA ($0.68) and the RSI in the positive territory suggest that the path of least resistance is to the upside. Buyers will try to propel the price to the March 4 high of $0.80. If this level is surmounted, the ADA/USDT pair could extend the rally to $0.90 and later to $1.25.
상승하는 20일 EMA($0.68)와 플러스 영역의 RSI는 저항이 가장 적은 경로가 상승세임을 나타냅니다. 구매자들은 가격을 3월 4일 최고치인 $0.80까지 끌어올리려고 노력할 것입니다. 이 수준이 초과되면 ADA/USDT 쌍은 랠리를 0.90달러, 나중에 1.25달러까지 확장할 수 있습니다.
This positive view will be invalidated in the near term if the price turns down and breaks below $0.68. That will indicate a comeback by the bears. The pair then risks a fall to the 50-day SMA ($0.59).
가격이 하락하여 $0.68 아래로 떨어지면 이러한 긍정적인 견해는 단기적으로 무효화됩니다. 이는 곰의 복귀를 의미합니다. 이후 해당 쌍은 50일 SMA($0.59)로 하락할 위험이 있습니다.
Dogecoin price analysis
도지코인 가격 분석
The bulls have been fighting with the bears to keep Dogecoin (DOGE) above the breakout level of $0.16.
상승세는 Dogecoin(DOGE)을 0.16달러 돌파 수준 이상으로 유지하기 위해 하락세와 싸우고 있습니다.
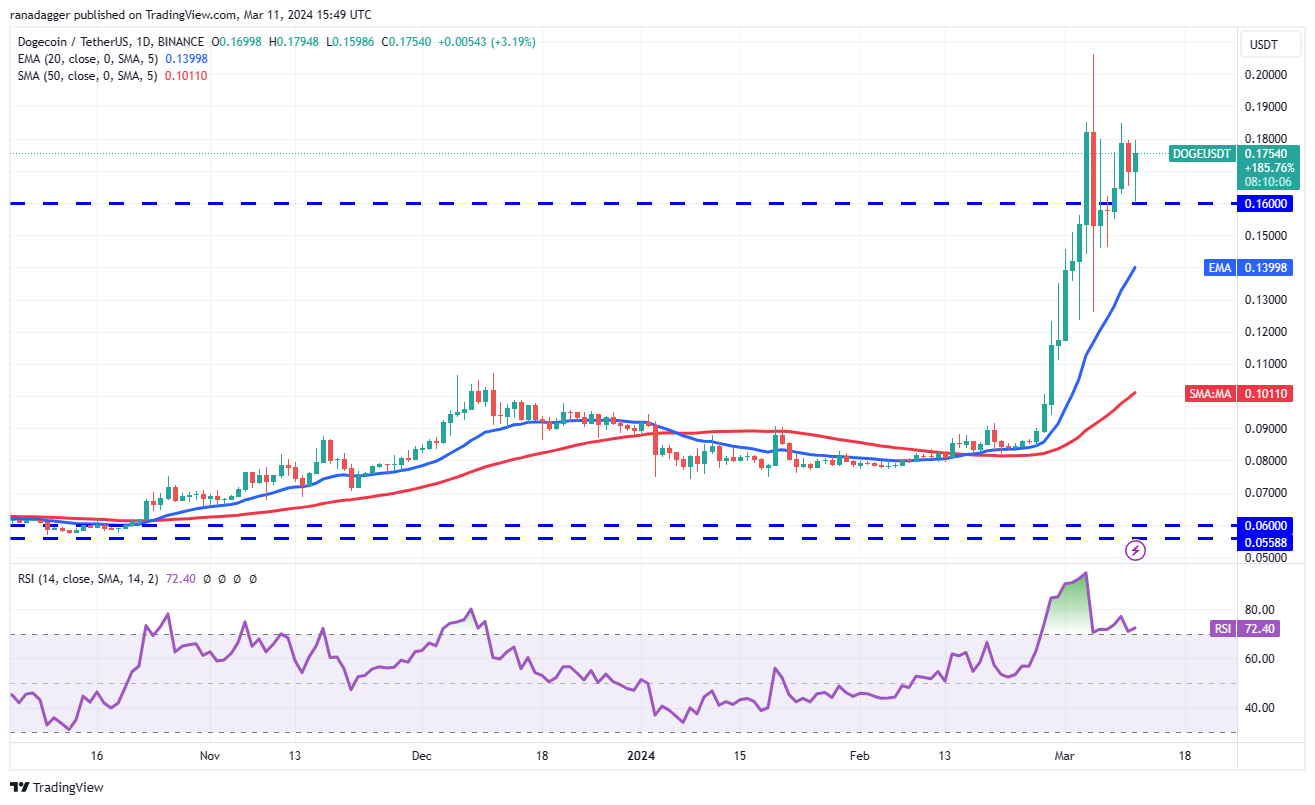
The rising 20-day EMA ($0.14) and the RSI in the overbought zone suggest that the bulls have an edge. If buyers propel and maintain the price above $0.000018, the DOGE/USDT pair could retest $0.21 and then rally to $0.26.
상승하는 20일 EMA($0.14)와 과매수 구간의 RSI는 상승세가 우위에 있음을 시사합니다. 구매자가 $0.000018 이상의 가격을 추진하고 유지하면 DOGE/USDT 쌍은 $0.21를 다시 테스트한 다음 $0.26으로 상승할 수 있습니다.
Contrarily, if the price breaks below $0.16, it will suggest that the bulls have given up. The pair may slump to the 20-day EMA, which remains the critical level to watch out for. A break below this support may start a deeper correction to $0.12.
반대로 가격이 0.16달러 아래로 떨어지면 상승세가 포기되었음을 의미합니다. 통화쌍은 여전히 주의해야 할 중요한 수준인 20일 EMA로 하락할 수 있습니다. 이 지지선 아래로 떨어지면 $0.12까지 더 깊은 조정이 시작될 수 있습니다.
Shiba Inu price analysis
시바견 가격 분석
Shiba Inu (SHIB) has been consolidating inside a large range between $0.000029 and $0.000039 after the sharp rally,
시바견(SHIB)은 급격한 랠리 이후 $0.000029에서 $0.000039 사이의 큰 범위 내에서 통합되었습니다.
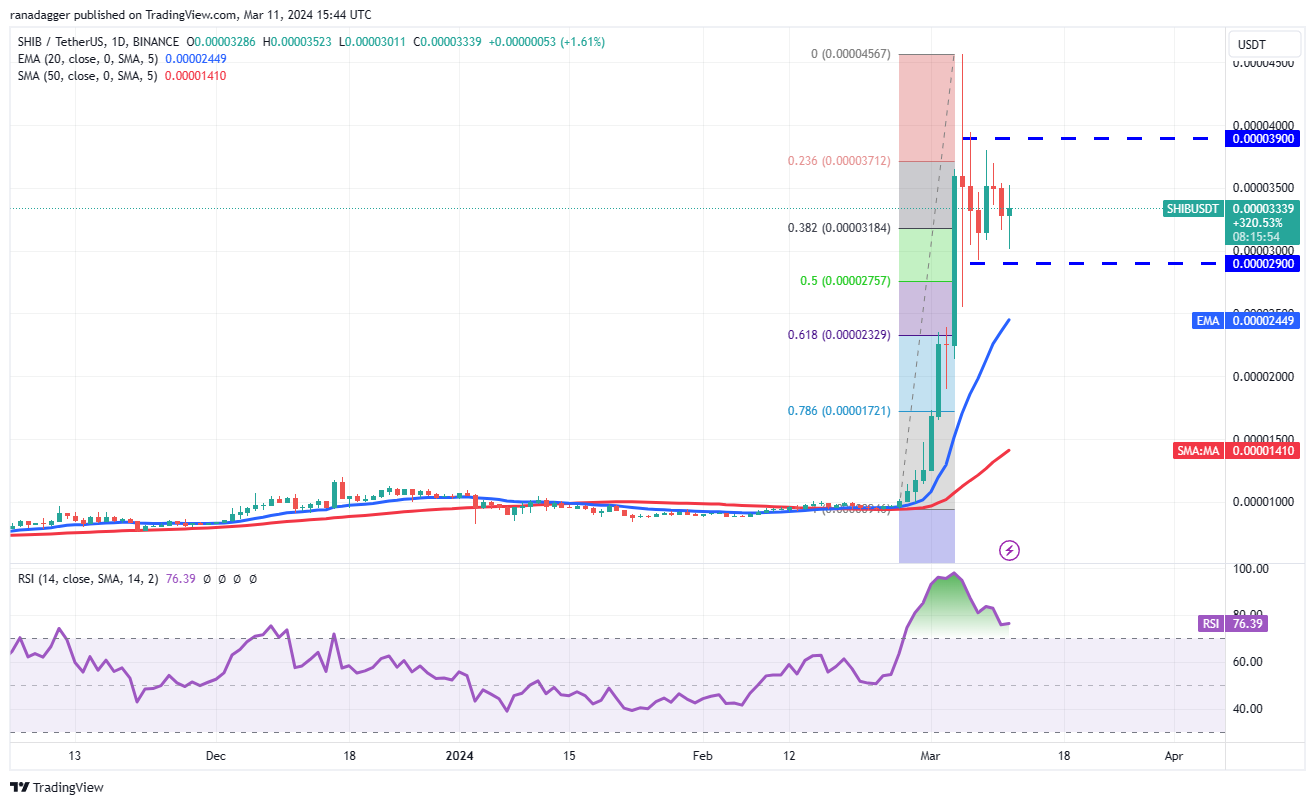
The range-bound action is correcting the deeply overbought levels on the RSI, suggesting that the markets are cooling down. The SHIB/USDT pair may trade inside the range for some more time.
범위 제한 조치는 RSI의 심각한 과매수 수준을 수정하여 시장이 냉각되고 있음을 나타냅니다. SHIB/USDT 쌍은 한동안 범위 내에서 거래될 수 있습니다.
If the price breaks below the range, the pair could slide to the 20-day EMA ($0.000024), a crucial level to watch out for. A break below this level will tilt the advantage in favor of the bears.
가격이 이 범위 아래로 떨어지면 주의해야 할 중요한 수준인 20일 EMA($0.000024)로 하락할 수 있습니다. 이 수준 이하로 하락하면 하락세에게 유리한 방향으로 유리하게 기울어질 것입니다.
On the contrary, a break above $0.000039 will signal that the bulls are back in command. The pair could then rise to $0.000046. If this level is crossed, the rally could reach $0.000065.
반대로 $0.000039를 넘어선다면 강세가 다시 주도권을 잡았다는 신호일 것입니다. 그러면 해당 쌍은 $0.000046까지 상승할 수 있습니다. 이 수준을 넘으면 랠리는 $0.000065에 도달할 수 있습니다.
This article does not contain investment advice or recommendations. Every investment and trading move involves risk, and readers should conduct their own research when making a decision.
이 글에는 투자 조언이나 추천이 포함되어 있지 않습니다. 모든 투자 및 거래 활동에는 위험이 수반되므로 독자는 결정을 내릴 때 스스로 조사해야 합니다.
 TheCoinrise Media
 TheCoinrise Media
 TheCoinrise Media
 DogeHome
 Cryptopolitan_News
 Coin Edition
 BlockchainReporter
 crypto.news
 Crypto Daily™


